. 2024 Jun 10;29(1):318.
doi: 10.1186/s40001-024-01893-6.

Establishment of a circRNA-regulated E3 ubiquitin ligase signature and nomogram to predict immunotherapeutic efficacy and prognosis in hepatocellular carcinoma

Affiliations

Establishment of a circRNA-regulated E3 ubiquitin ligase signature and nomogram to predict immunotherapeutic efficacy and prognosis in hepatocellular carcinoma

Gefeng Wu et al. Eur J Med Res. .

Abstract

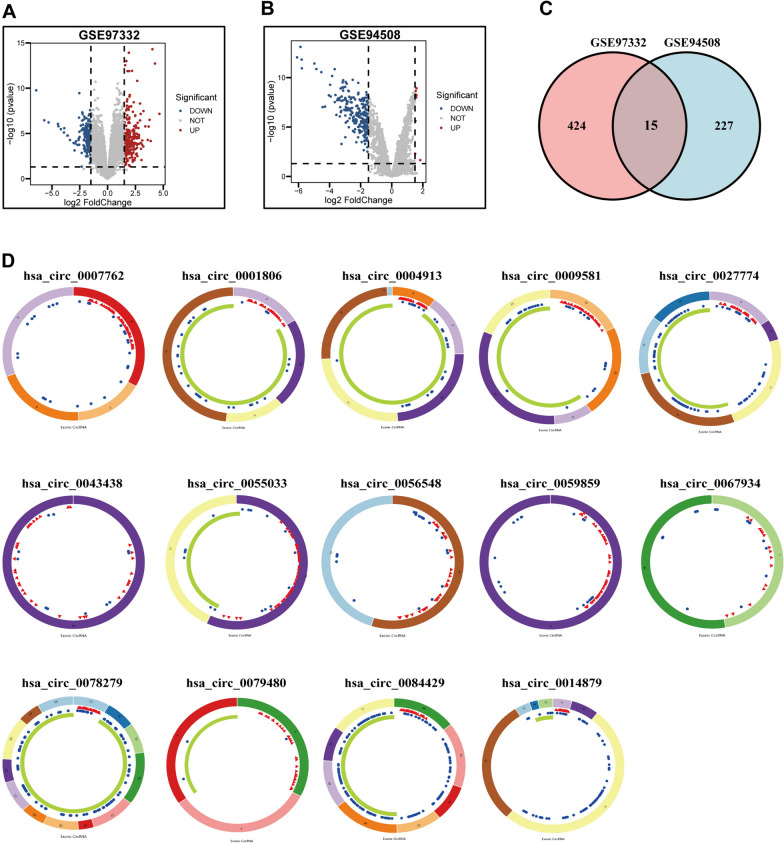
Background: Hepatocellular carcinoma (HCC) is a common type of malignant tumor where the prognosis is dismal. Circular RNA (CircRNA) is a novel RNA that regulates downstream gene transcription and translation to influence the progression of HCC. However, the regulatory relationship that exists between E3 ligases, which is a class of post-translational modifying proteins, and circRNA remains unclear.

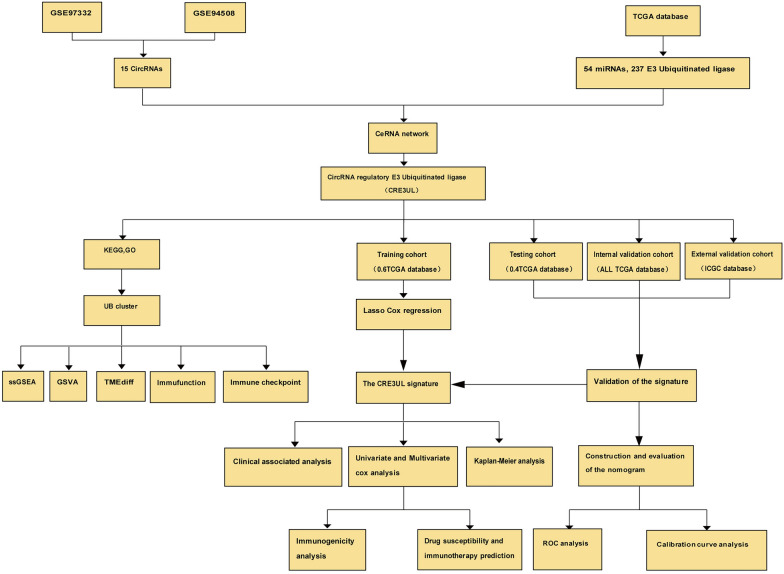
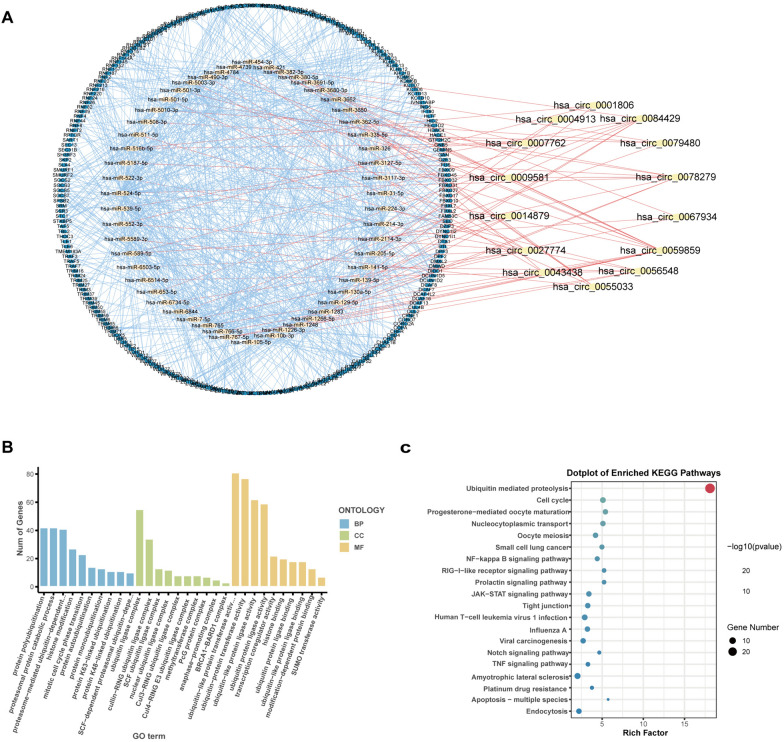
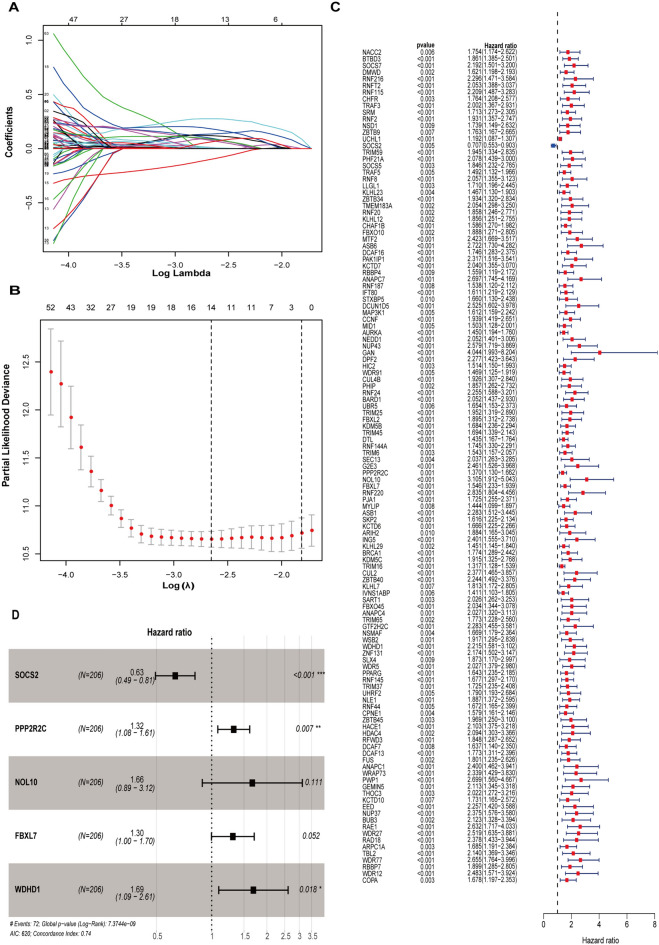
Methods: Based on the E3 ubiquitin ligase in the competitive endogenous RNA (ceRNA) network, a circRNA-regulated E3 ubiquitin ligase signature (CRE3UL) was developed. A CRE3UL signature was created using the least absolute shrinkage and selection operator (Lasso) and Cox regression analysis and merged it with clinicopathologic characteristics to generate a nomogram for prognosis prediction. The pRRophetic algorithm was utilized and immunological checkpoints were analyzed to compare the responses of patients in the high-risk group (HRG) and low-risk group (LRG) to targeted therapy and immunotherapy. Finally, experimental research will further elucidate the relationship between E3 ubiquitin ligase signature and HCC.

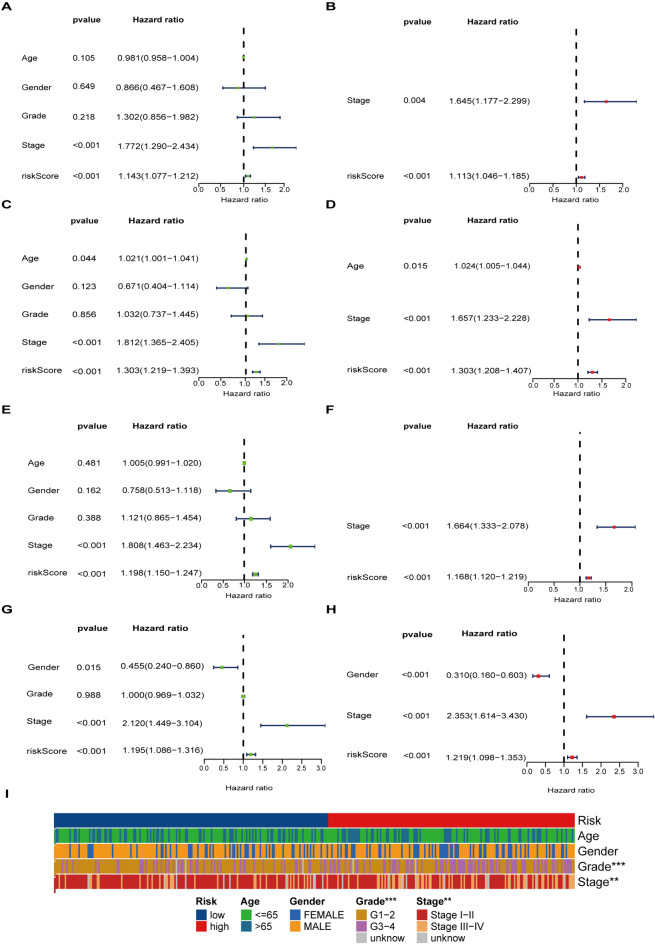
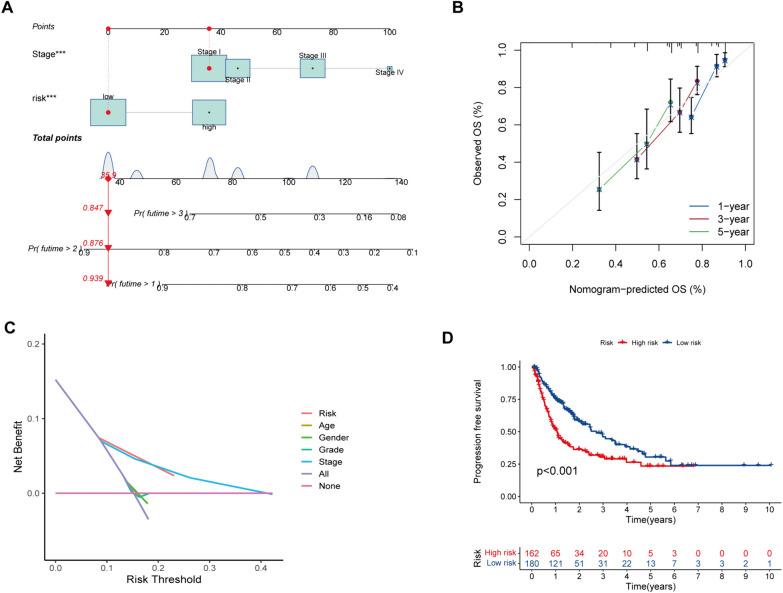
Results: HRG patients were found to have a worse prognosis than LRG patients. Furthermore, significant variations in prognosis were observed among different subgroups based on various clinical characteristics. The CRE3UL signature was identified as being an independent prognostic indicator. The nomogram that combined clinical characteristics and the CRE3UL signature was found to accurately predict the prognosis of HCC patients and demonstrated greater clinical utility than the current TNM staging approach. According to anticancer medication sensitivity predictions, the tumors of HRG patients were more responsive to gefitinib and nilotinib. From immune-checkpoint markers analysis, immunotherapy was identified as being more probable to assist those in the HRG.

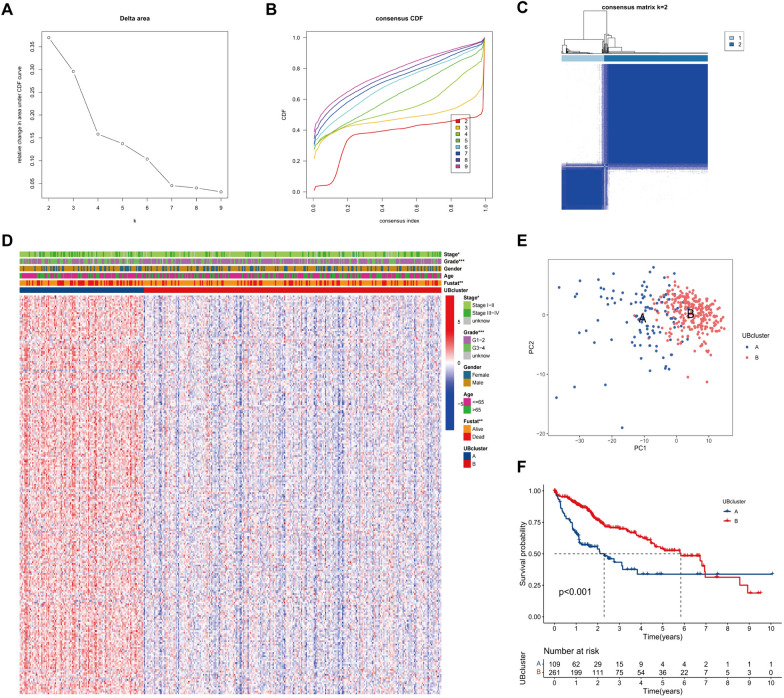
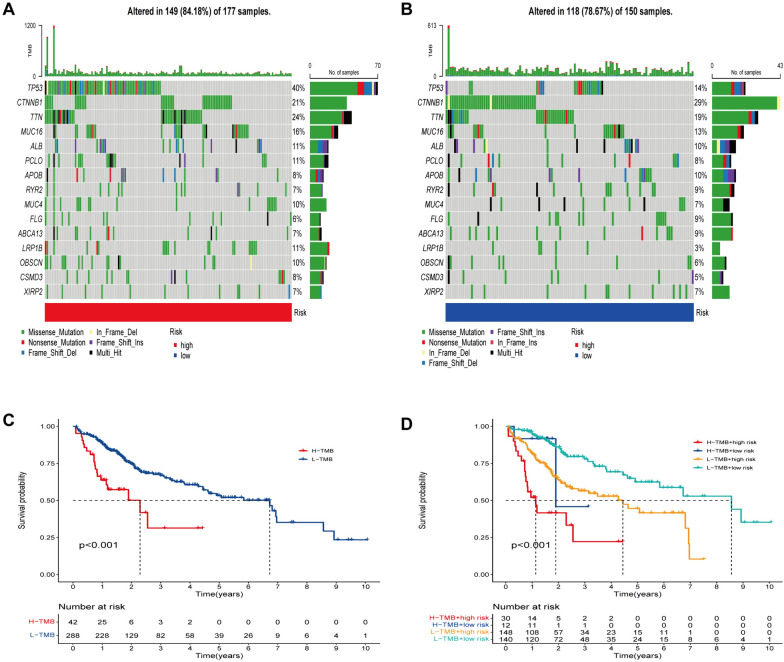
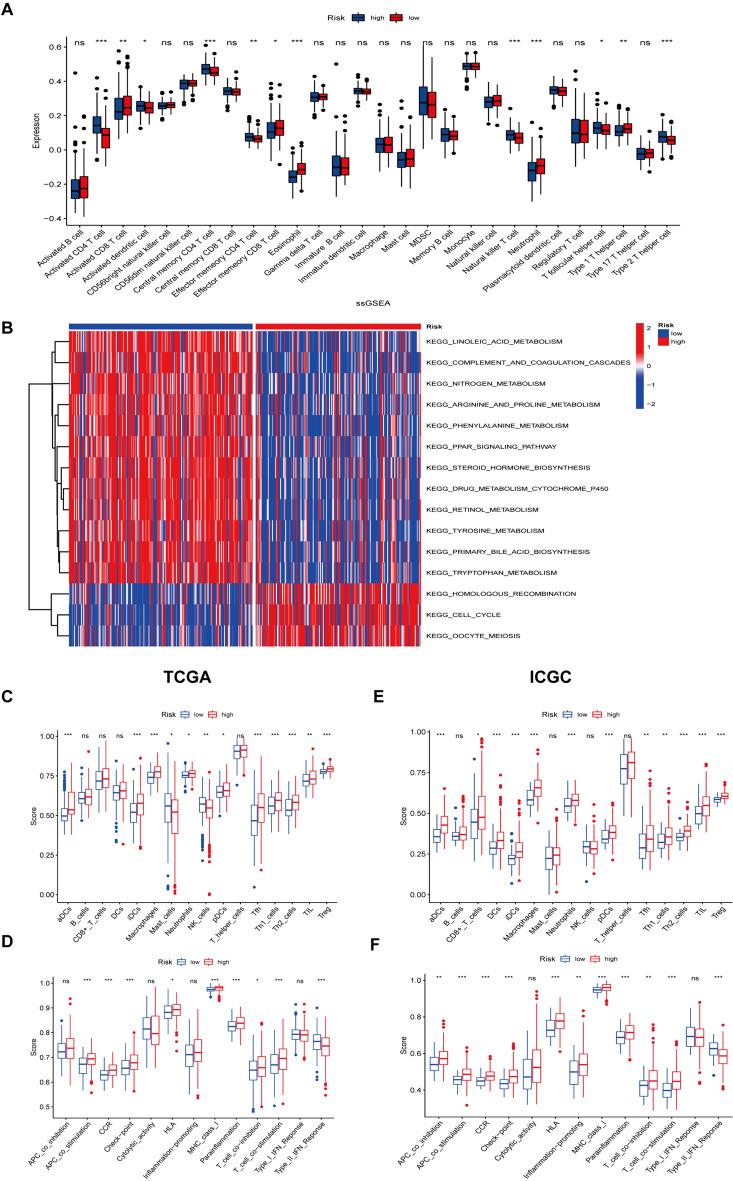
Conclusions: We found a significant correlation between the CRE3UL signature and the tumor microenvironment, enabling precise prognosis prediction for HCC patients. Additionally, a nomogram was developed that performs well in predicting the overall survival (OS) of HCC patients. This provides valuable guidance for clinicians in devising specific personalized treatment strategies.

Keywords: CircRNA; E3 ubiquitin ligase signature; Hepatocellular carcinoma; Immune and prognosis; Nomogram.


Conflict of interest statement

The authors have no competing of interests or financial ties to disclose.

Figures

Fig. 1
Fig. 1
Flowchart of the analysis
Fig. 2
Fig. 2
A Volcano plot of differentially expressed E3 ubiquitin ligase from GSE97332. B Volcano plot of differentially expressed E3 ubiquitin ligase from GSE94508. C Venn diagram to identify differentially expressed E3 ubiquitin ligase. D Interaction patterns of the 14 differentially expressed circRNAs in HCC. Red, blue, and green represent microRNA response elements, RNA-binding proteins, and open reading frames, respectively
Fig. 3
Fig. 3
Functional enrichment analysis of CRE3UL. A circRNA–miRNA–mRNA (E3) ceRNA network in CRE3UL. Red, yellow, and blue nodes indicate 14 DEcircRNAs, 54 DEmiRNAs, and 237 DEmRNAs (E3), respectively. B GO enrichment analysis. C KEGG enrichment analysis. CRE3UL, circRNA-regulated E3 ubiquitin ligase; ceRNA, competing endogenous RNA; GO, Gene Ontology; KEGG, Kyoto Encyclopedia of Genes and Genomes
Fig. 4
Fig. 4
Identification of CRE3UL-based UB cluster. A The corresponding relative change in area under the cumulative distribution function (C, D, F) curves and the optimal number of clusters (k) was 2. B Consensus clustering CDF for k = 2 to 9. C Heatmap of sample clustering at consensus k = 2. D Heatmap showing the GSVA score of stage, grade, gender, age, and fustat in two UB clusters. E PCA plot visualizing the two UB clusters F Kaplan–Meier survival plots of cluster 1 and cluster 2 for OS. OS, overall survival. PCA, principal component analysis. GSVA, Gene set variation analysis
Fig. 5
Fig. 5
Establishment of the circRNA regulatory E3 ubiquitin ligase prognostic signature for HCC patients. A, B Cross-validation for tuning the parameter selection in the LASSO regression. C Univariate Cox analysis of the genes selected by circRNA. D The presentation of five E3 ubiquitin ligases in multivariate Cox regression analysis
Fig. 6
Fig. 6
Univariate and multivariate Cox analyses of HCC. Univariate Cox regression results in the A TCGA training set, C TCGA testing set, E whole TCGA cohort, and G ICGC cohort. Multivariate Cox regression results in the B TCGA training set, D TCGA testing set, F whole TCGA cohort, and H ICGC cohort. I Relationship between the CRE3UL signature and clinical characteristics (***p < 0.001, **p < 0.01, *p < 0.05)
Fig. 7
Fig. 7
Establishment and assessment of a nomogram in the entire set. A The nomogram predicts the probability of the 1, 2, and 3 years of OS. B The calibration plot prediction via nomogram of the OS at 1, 2, and 3 years. C Decision curve analysis for the nomogram, age, gender, grade, stage, and risk score. D Kaplan–Meier survival analysis of the integrated nomogram for PFS in HCC patients
Fig. 8
Fig. 8
Relationship between the E3 ubiquitin ligase signature and somatic mutation. Waterfall plots of 15 genes with the highest mutation rates in the high-risk group (A) and the low-risk group (B). C Kaplan–Meier analysis of TMB in HCC patients. D Kaplan–Meier analysis of the correlation between risk score and TMB
Fig. 9
Fig. 9
Overview of CRE3UL signature-related immune infiltration. A The box plot presents the relative composition of multiple cell types in the high-risk and low-risk groups of patients with the CRE3UL signature. B GSVA analysis of biological pathways between the two distinct risk groups. C Comparison of immune cell infiltration in the high- and low-risk groups in the TCGA-LIHC cohort. D Comparison of immune function in the high- and low-risk groups in the TCGA-LIHC cohort. E Comparison of immune cell infiltration in the high- and low-risk groups in the ICGC-JIHC cohort. F Comparison of immune function in the high- and low-risk groups in the ICGC-JIHC cohort. Statistical significance was denoted with *p < 0.05, **p < 0.01, and ***p < 0.001
Fig. 10
Fig. 10
KEGG enrichment analysis for the high-risk (A) and low-risk groups (B) of CRE3UL. Validation of mRNA expression by real-time PCR and mRNA expression of five genes associated with E3 ubiquitin ligase in 24 HCC tissues and paracancerous tissues. ns, not statistically significant; *p < 0.05; **p < 0.01; ***p < 0.001 (C–F). G, H The cell types and their distribution in the GSE166635 dataset. I–M The distribution of five genes associated with E3 ubiquitin ligase in different cell types was analyzed using single-cell resolution in the GSE166635 dataset

Similar articles

References

    1. Llovet JM, Kelley RK, Villanueva A, Singal AG, Pikarsky E, Roayaie S, Lencioni R, Koike K, Zucman-Rossi J, Finn RS. Hepatocellular carcinoma. Nat Rev Dis Primers. 2021;7:6. doi: 10.1038/s41572-020-00240-3. - DOI - PubMed
    1. Siegel RL, Giaquinto AN, Jemal A. Cancer statistics, 2024. CA A Cancer J Clinicians. 2024;74:12–49. doi: 10.3322/caac.21820. - DOI - PubMed
    1. Sung H, Ferlay J, Siegel RL, Laversanne M, Soerjomataram I, Jemal A, Bray F. Global cancer statistics 2020: GLOBOCAN estimates of incidence and mortality worldwide for 36 cancers in 185 countries. CA A Cancer J Clin. 2021;71:209–249. doi: 10.3322/caac.21660. - DOI - PubMed
    1. Schulze K, Nault J-C, Villanueva A. Genetic profiling of hepatocellular carcinoma using next-generation sequencing. J Hepatol. 2016;65:1031–1042. doi: 10.1016/j.jhep.2016.05.035. - DOI - PubMed
    1. Allemani C, Matsuda T, Di Carlo V, Harewood R, Matz M, Nikšić M, Bonaventure A, Valkov M, Johnson CJ, Estève J, et al. Global surveillance of trends in cancer survival 2000–14 (CONCORD-3): analysis of individual records for 37 513 025 patients diagnosed with one of 18 cancers from 322 population-based registries in 71 countries. The Lancet. 2018;391:1023–1075. doi: 10.1016/S0140-6736(17)33326-3. - DOI - PMC - PubMed

MeSH terms