. 2024 Jun 10;22(1):556.
doi: 10.1186/s12967-024-05311-7.

Genome-wide DNA methylation in relation to ARID1A deficiency in ovarian clear cell carcinoma

Affiliations

Genome-wide DNA methylation in relation to ARID1A deficiency in ovarian clear cell carcinoma

Shang Li et al. J Transl Med. .

Abstract

Background: The poor chemo-response and high DNA methylation of ovarian clear cell carcinoma (OCCC) have attracted extensive attentions. Recently, we revealed the mutational landscape of the human kinome and additional cancer-related genes and found deleterious mutations in ARID1A, a component of the SWI/SNF chromatin-remodeling complex, in 46% of OCCC patients. The present study aims to comprehensively investigate whether ARID1A loss and genome-wide DNA methylation are co-regulated in OCCC and identify putative therapeutic targets epigenetically regulated by ARID1A.

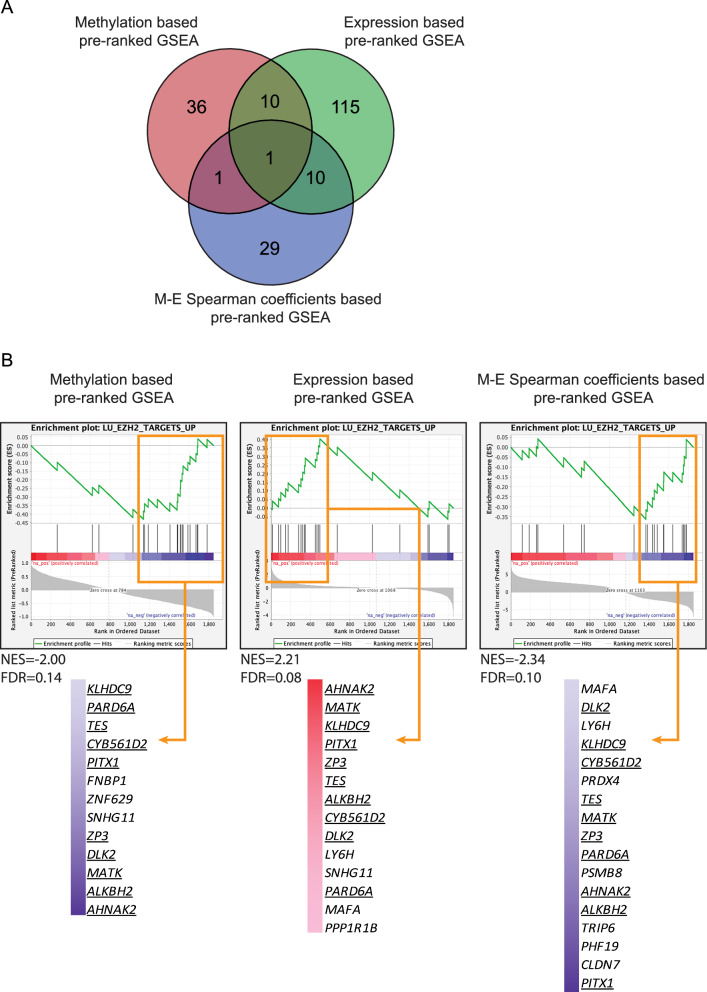
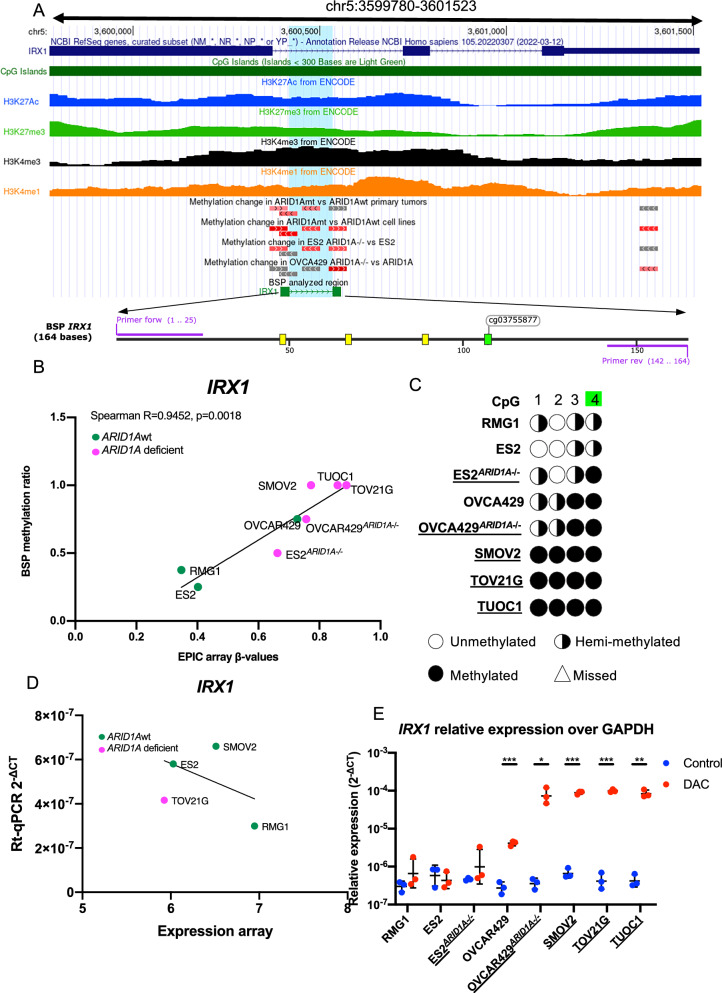
Methods: DNA methylation of ARID1Amt/ko and ARID1Awt OCCC tumors and cell lines were analyzed by Infinium MethylationEPIC BeadChip. The clustering of OCCC tumors in relation to clinical and mutational status of tumors were analyzed by hierarchical clustering analysis of genome-wide methylation. GEO expression profiles were used to identify differentially methylated (DM) genes and their expression level in ARID1Amt/ko vs ARID1Awt OCCCs. Combining three pre-ranked GSEAs, pathways and leading-edge genes epigenetically regulated by ARID1A were revealed. The leading-edge genes that passed the in-silico validation and showed consistent ARID1A-related methylation change in tumors and cell lines were regarded as candidate genes and finally verified by bisulfite sequencing and RT-qPCR.

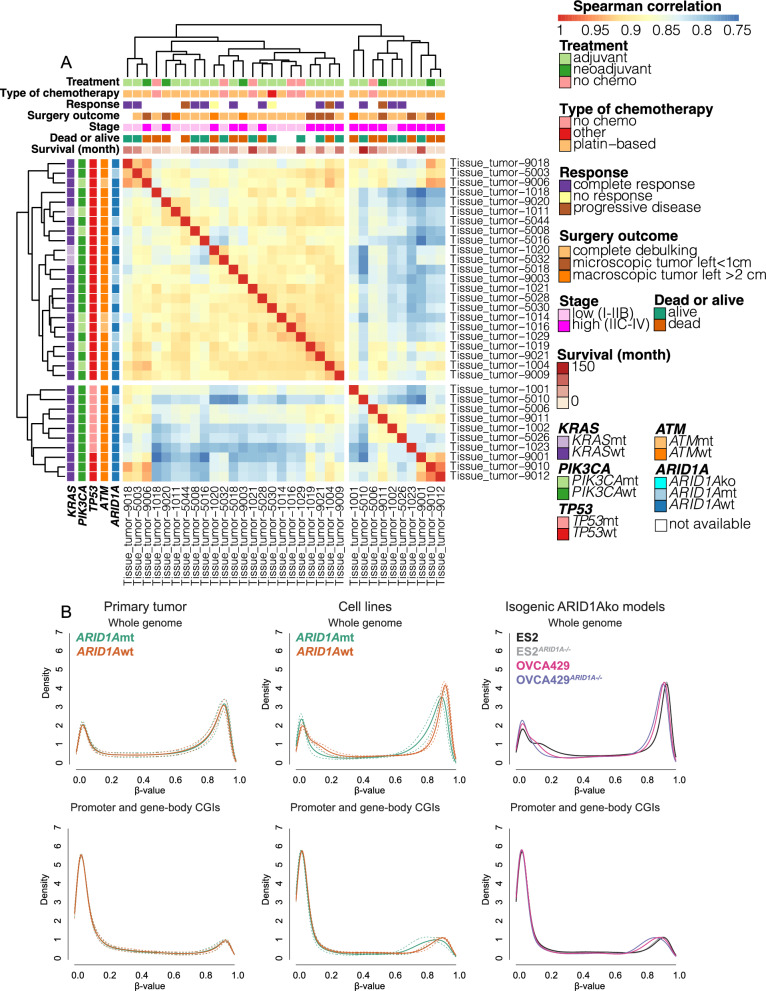
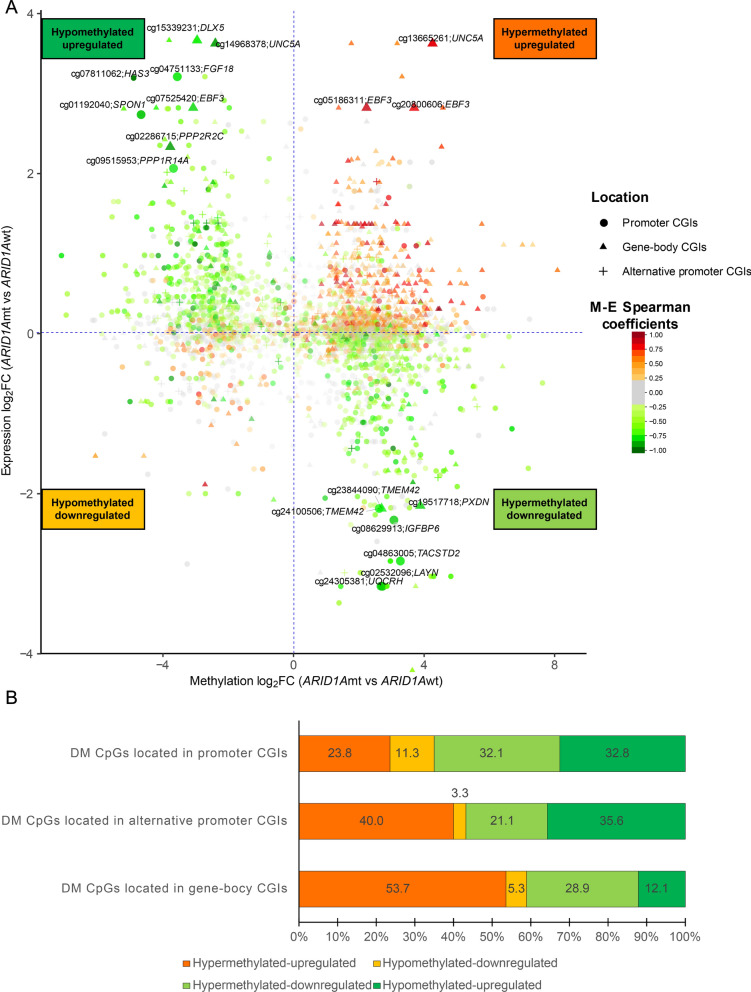
Results: Hierarchical clustering analysis of genome-wide methylation showed two clusters of OCCC tumors. Tumor stage, ARID1A/PIK3CA mutations and TP53 mutations were significantly different between the two clusters. ARID1A mutations in OCCC did not cause global DNA methylation changes but were related to DM promoter or gene-body CpG islands of 2004 genes. Three pre-ranked GSEAs collectively revealed the significant enrichment of EZH2- and H3K27me3-related gene-sets by the ARID1A-related DM genes. 13 Leading-edge DM genes extracted from the enriched gene-sets passed the expression-based in-silico validation and showed consistent ARID1A-related methylation change in tumors and cell lines. Bisulfite sequencing and RT-qPCR analysis showed promoter hypermethylation and lower expression of IRX1, TMEM101 and TRIP6 in ARID1Amt compared to ARID1Awt OCCC cells, which was reversed by 5-aza-2'-deoxycytidine treatment.

Conclusions: Our study shows that ARID1A loss is related to the differential methylation of a number of genes in OCCC. ARID1A-dependent DM genes have been identified as key genes of many cancer-related pathways that may provide new candidates for OCCC targeted treatment.

Keywords: ARID1A; DNA methylation; EZH2; Ovarian clear cell carcinoma.


Conflict of interest statement

The authors declare that they have no competing interests.

Figures

Fig. 1
Fig. 1
Methylation of OCCC tumors and cell lines. A Unsupervised two-dimensional hierarchical clustering of OCCC tumors based on β-values of 692,994 CpGs. The clinical data and genetic mutations of OCCC tumors are indicated. B Density distribution of methylation β-values of whole genome (up, 692,994 CpGs) and promoter and gene-body CGIs (down) are measured in ARID1Amt/ko vs ARID1Awt OCCC. Solid lines indicate the mean β-values, while dashed lines indicate the mean ± standard deviation of β-values
Fig. 2
Fig. 2
Identification of DM CpGs between ARID1Amt/ko vs ARID1Awt OCCC. A Volcano plot showing the identified DM CpGs in OCCC tumor, cell lines and isogenic ARID1Ako models. Scattered dots represent CpGs. The x-axis is the methylation log2fold change based on M-value, whereas the y-axis is -log10 transformed significance p-value of differential methylation obtained from” limma” method. Dots are colored based on the cut-offs they satisfy. The top altered CpGs based on M-value log2fold change were specified. The names of the target genes of specified CpGs are adjacent to the corresponding CpGs. B Venn diagram showing the number and corresponding percentage of DM CpGs in the 4 sample sets (OCCC tumors, cell lines and isogenic ARID1Ako models). Common DM CpGs which identified in at least 2 out of 4 sample sets are marked by the yellow line
Fig. 3
Fig. 3
Methylation of DM CpGs and expression of the target genes based on OCCC cell lines. A The x-axis is the methylation log2FC of DM CpGs. The y-axis is expression log2FC of their corresponding target genes. The shape of each CpG point is based on the transcriptional regulatory element it is located in, whereas the color of each CpG dot is based on the Spearman coefficient between its M-value and expression of its target gene (M-E Spearman coefficient). The enlarged points or triangles specify the CpGs that satisfy all of the 3 conditions: (1) methylation log2FC of the CpG is > 2; (2) expression log2FC of the target genes is > 2; (3) the absolute M-E Spearman coefficients between their methylation and expression of their target genes is > 0.75. The names of CpGs and their target genes are adjacent to the corresponding enlarged points. B The methylation changes of DM CpGs and the expression alteration of their target genes. DM CpGs and their target genes are divided based on the pattern of their methylation and expression alteration between ARID1Amt cell lines vs ARID1Awt OCCC cell lines: hypermethylated-upregulated (orange), hypomethylated-downregulated (yellow), hypermethylated-downregulated (light green) and hypomethylated-upregulated (green) genes. The percentage of each group in promoter, alternative promoter and gene-body DM CpGs are labeled on the corresponding bar
Fig. 4
Fig. 4
Significant gene-sets identified by the 3 different pre-ranked GSEA analyses. A Venn plot of significant gene-sets derived from methylation log2FC based pre-ranked GSEA, expression log2FC based pre-ranked GSEA and M-E Spearman coefficient based pre-ranked GSEA. B Enrichment curve of “LU EZH2 TARGETS UP” derived from methylation log2FC based pre-ranked GSEA, expression log2FC based pre-ranked GSEA and M-E Spearman coefficient based pre-ranked GSEA. The corresponding normalized enrichment scores (NES) and FDRs of “LU EZH2 TARGETS UP” are annotated. Orange boxes and arrows marked the leading-edge genes of “LU EZH2 TARGETS UP” derived from methylation log2FC based pre-ranked GSEA, expression log2FC based pre-ranked GSEA and M-E Spearman coefficient based pre-ranked GSEA. The corresponding locations of leading-edge genes inside the enrichment curve were indicated by the color bar next to them. Leading-edge genes of “LU EZH2 TARGETS UP” commonly identified by all three pre-ranked GSEA were underlined
Fig. 5
Fig. 5
ARID1A dependency and expression alteration of leading-edge genes. A Venn plot of leading-edge genes derived from methylation log2FC based pre-ranked GSEA, expression log2FC based pre-ranked GSEA and M-E Spearman coefficient based pre-ranked GSEA. B Dependency and expression alteration of leading-edge genes with consistent differential methylation in ARID1Amt OCCC tumor and cell lines. Leading-edge genes with differential methylation in both OCCC tumor and cell lines are shown in the columns of the heatmap, while the corresponding enriched gene-sets that shared more than 2 DM leading-edge genes are shown in the rows of the heatmap. The distance between every two components in columns (genes) or rows (gene-sets) was calculated based on Spearman coefficients. “ward.D2” method was used to cluster columns (genes) and rows (gene-sets) of the heatmap according to the corresponding Spearman coefficients. A black-colored cell depicts whether a certain gene is presented in a given gene-set. Methylation log2FCs of the DM CpG are indicated in the first panel of row annotations; Average dependency of corresponding leading-edge genes in ARID1Amt cell lines and ARID1Awt cell lines are indicated in the second panel of row annotations; Expression log2FC (9 cell lines) of leading-edge genes from GEO and expression log2FC from CCLE (12 cell lines) are indicated in the third panel of row annotations. The most significant FDR value of each enriched gene-set from three pre-ranked GSEA is indicated in the column annotation
Fig. 6
Fig. 6
DNA methylation and gene expression of IRX1 in ARID1A deficient OCCCs vs ARID1Awt OCCCs. A DNA methylation of IRX1 promoter in OCCC cell lines. UCSC genome browser (GRCh37/hg19) representation of the genomic organization of IRX1. The thick solid blocks indicate the coding regions, the thinner blocks indicate the 5' and 3'UTRs, blue lines indicate introns and arrows indicate the direction of gene transcription. The CGIs are represented as horizontal green bars. H3K27me3 (green), H3K27Ac (blue), H3K4me3 (black), H3K4me1 (orange) data from ENCODE project depict histone modification status as peaks. CpGs gaining methylation (red), losing methylation (blue), insignificant (gray) in ARID1A deficient vs ARID1Awt OCCC are represented as horizontal solid bars. BSP PCR product is indicated by solid boxes (primers) and green line (analyzed sequence). The BSP-analyzed region shaded in light blue is presented below with CpG located in the BSP-analyzed region depicted as yellow bars. The labeled and green CpGs are mutually analyzed by Infinium MethylationEPIC BeadChip arrays and BSP. B IRX1 BSP methylation ratio vs average β-value from Infinium MethylationEPIC BeadChip array in ARID1Amt (pink) and ARID1Awt (green) OCCC cells. The black solid line represents the regression line. C BSP result of IRX1 in OCCC cells. CpG sites located in the BSP-analyzed region are numbered and showed. CpG mutually analyzed by Infinium MethylationEPIC BeadChip arrays and BSP are specified with green color. Empty circles represent unmethylated CpGs, black circles represent methylated CpGs, half black circles represent hemi-methylated CpGs and empty triangles represent missed CpGs. ARID1A deficient cells are underlined. D IRX1 relative gene expression based on RT-qPCR vs publicly available expression profiles of ARID1Amt (pink) and ARID1Awt (green) OCCC cells. The black solid line represents the regression line. E RT-qPCR result of IRX1 in OCCC cells with (red) or without (blue) DAC treatment. ARID1A deficient cells are underlined. Statistical significance of Student T-test is notified as *p < 0.05; **p < 0.01; ***p < 0. 001

Similar articles

Cited by

References

    1. Sung H, Ferlay J, Siegel RL, Laversanne M, Soerjomataram I, Jemal A, et al. Global cancer statistics 2020: GLOBOCAN estimates of incidence and mortality worldwide for 36 cancers in 185 countries. CA Cancer J Clin. 2021;71(3):209–249. doi: 10.3322/caac.21660. - DOI - PubMed
    1. Anglesio MS, Carey MS, Köbel M, MacKay H, Huntsman DG. Clear cell carcinoma of the ovary: a report from the first ovarian clear cell symposium. Gynecol Oncol. 2011;121:407–15. doi: 10.1016/j.ygyno.2011.01.005. - DOI - PubMed
    1. Saito T, Takahashi F, Katabuchi H. Annual report of the committee on gynecologic oncology, japan society of obstetrics and gynecology: patient annual report for 2014 and treatment annual report for 2009. J Obstet Gynaecol Res. 2017;43(11):1667–1677. doi: 10.1111/jog.13450. - DOI - PubMed
    1. Goff BA, Sainz De La Cuesta R, Muntz HG, Fleischhacker D, Ek M, Rice LW, et al. Clinical characteristics of clear cell carcinoma of the ovary: a distinct histologic type with poor prognosis and resistance to platinum-based chemotherapy. Gynecol Oncol. 1996;88(3):412–7. doi: 10.1006/gyno.1996.0065. - DOI - PubMed
    1. Mizuno M, Kikkawa F, Shibata K, Kajiyama H, Ino K, Kawai M, et al. Long-term follow-up and prognostic factor analysis in clear cell adenocarcinoma of the ovary. J Surg Oncol. 2006;94(2):138–143. doi: 10.1002/jso.20251. - DOI - PubMed

MeSH terms