. 2024 Oct 14;5(10):101000.
doi: 10.1016/j.xplc.2024.101000. Epub 2024 Jun 10.

Haplotype-resolved T2T genome assemblies and pangenome graph of pear reveal diverse patterns of allele-specific expression and the genomic basis of fruit quality traits

Affiliations

Haplotype-resolved T2T genome assemblies and pangenome graph of pear reveal diverse patterns of allele-specific expression and the genomic basis of fruit quality traits

Qionghou Li et al. Plant Commun. .

Abstract

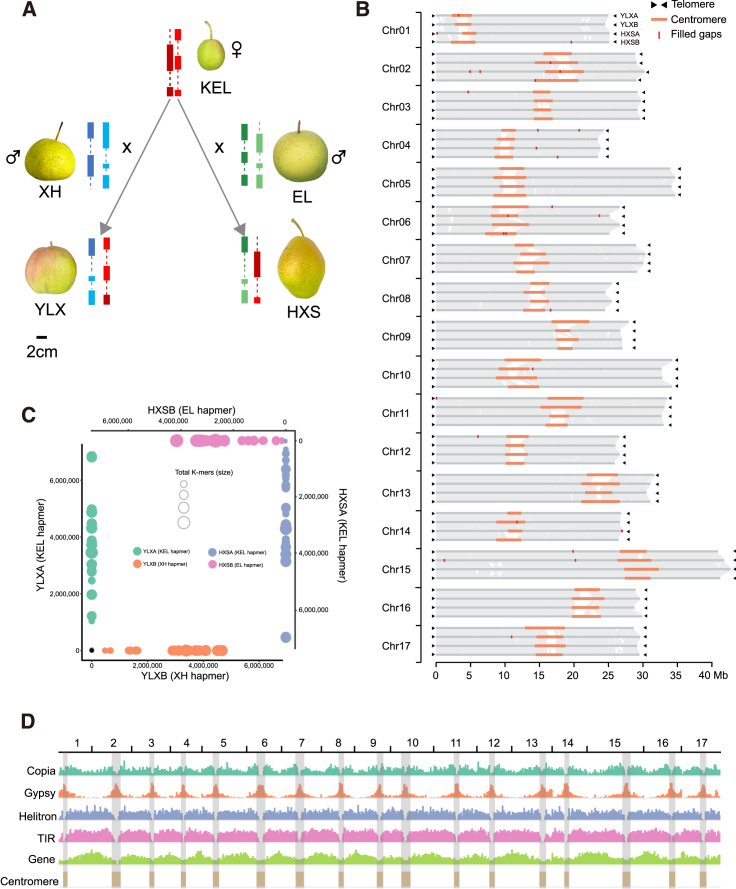
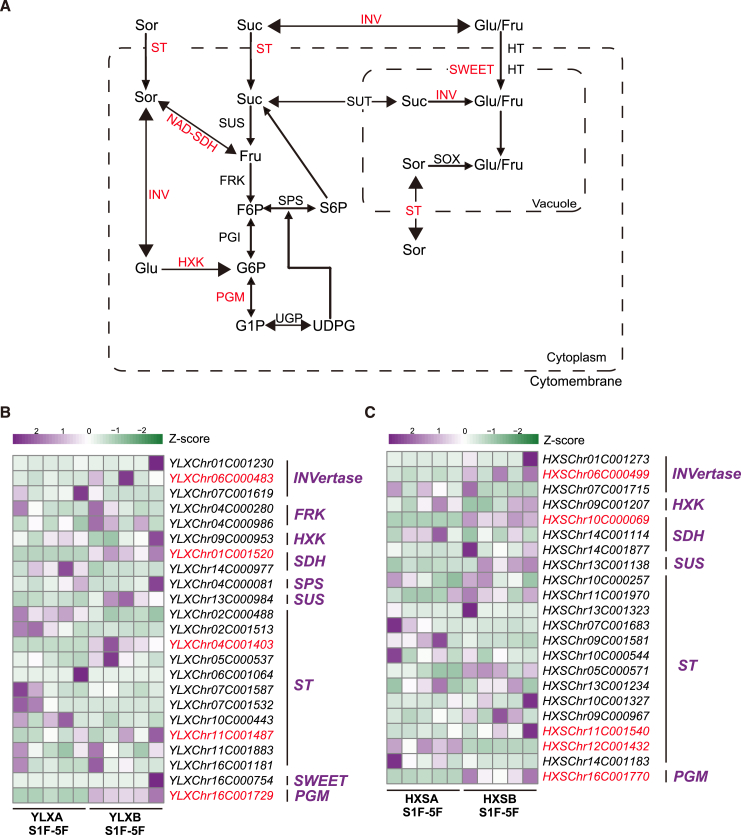
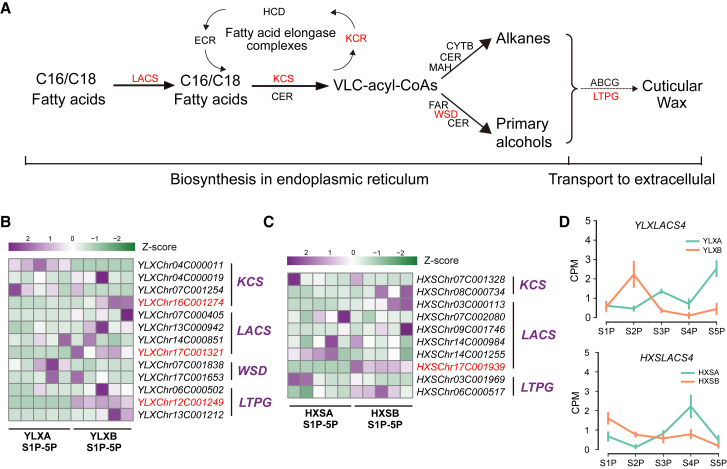
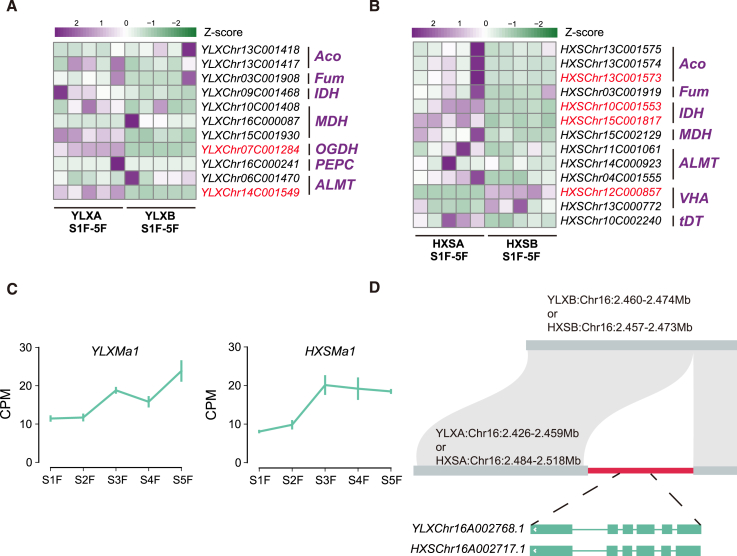
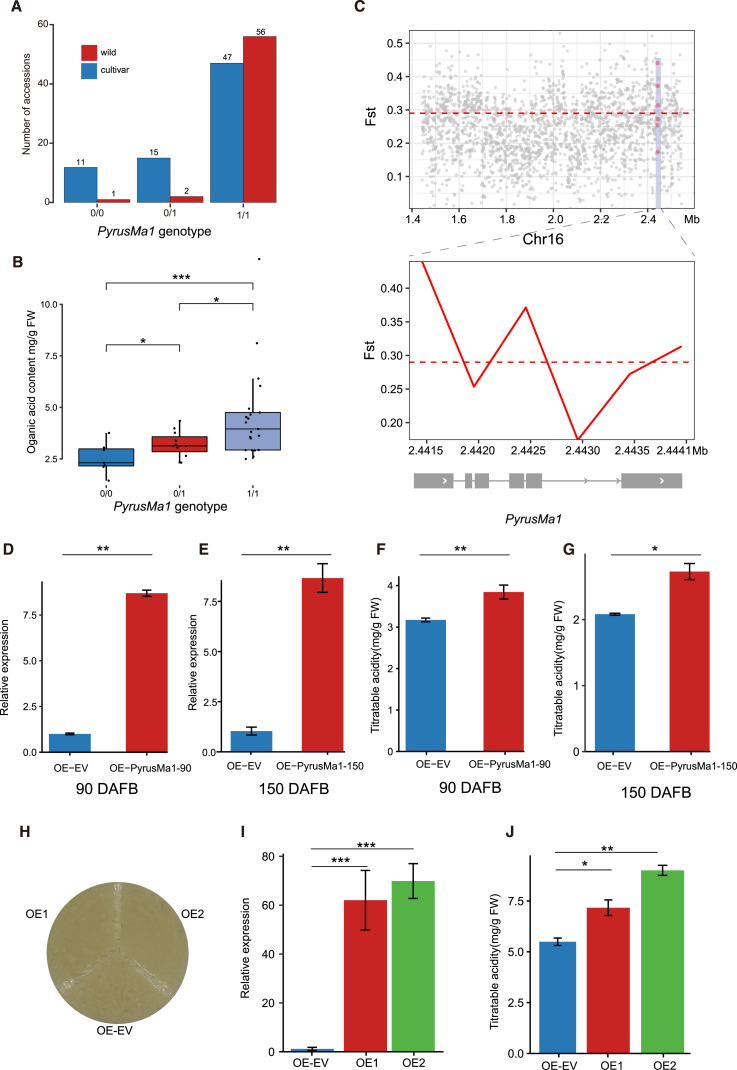
Hybrid crops often exhibit increased yield and greater resilience, yet the genomic mechanism(s) underlying hybrid vigor or heterosis remain unclear, hindering our ability to predict the expression of phenotypic traits in hybrid breeding. Here, we generated haplotype-resolved T2T genome assemblies of two pear hybrid varieties, 'Yuluxiang' (YLX) and 'Hongxiangsu' (HXS), which share the same maternal parent but differ in their paternal parents. We then used these assemblies to explore the genome-scale landscape of allele-specific expression (ASE) and create a pangenome graph for pear. ASE was observed for close to 6000 genes in both hybrid cultivars. A subset of ASE genes related to aspects of fruit quality such as sugars, organic acids, and cuticular wax were identified, suggesting their important contributions to heterosis. Specifically, Ma1, a gene regulating fruit acidity, is absent in the paternal haplotypes of HXS and YLX. A pangenome graph was built based on our assemblies and seven published pear genomes. Resequencing data for 139 cultivated pear genotypes (including 97 genotypes sequenced here) were subsequently aligned to the pangenome graph, revealing numerous structural variant hotspots and selective sweeps during pear diversification. As predicted, the Ma1 allele was found to be absent in varieties with low organic acid content, and this association was functionally validated by Ma1 overexpression in pear fruit and calli. Overall, these results reveal the contributions of ASE to fruit-quality heterosis and provide a robust pangenome reference for high-resolution allele discovery and association mapping.

Keywords: allele-specific expression; fruit quality traits; haplotype-resolved assembly; pangenome graph; pear.


Conflict of interest statement

The authors declare no competing interests.

Figures

Figure 1
Figure 1
Haplotype-resolved T2T genome assemblies of YLX and HXS. (A) Schematic diagram showing parental lines of the hybrid varieties YLX and HXS. YLX and HXS inherited their maternal haplotypes from KEL and their paternal haplotypes from XH and EL, respectively. (B) Whole-genome alignment of four haplotypes from YLX and HXS, with the order YLXA, YLXB, HXSA, and HXSB. The aligned regions between two haplotypes are linked by gray bands. Telomeres are denoted as black triangles. Centromeres are shown as orange blocks. The short red vertical bars represent filled gaps. (C) Hap-mer blob plot showing counts of parent-specific k-mers in maternal (y axis) and paternal (x axis) haplotypes of YLX or HXS. Blob size is proportional to contig size, and each blob/contig is plotted according to the number of contained paternal (x values) and maternal (y values) hap-mers. For the YLX assembly, XH-specific k-mers are detected in the paternal or XH-derived haplotype assembly with no KEL-specific k-mers, whereas KEL k-mers are detected in the maternal or KEL-derived assembly with almost no XH-specific k-mers. A similar result was found for HXS. (D) Chromosomal distribution of centromeres, together with genes and different types of TEs. Vertical bars indicate predicted centromeres. Chromosomes 1–17 are arranged from left to right.
Figure 2
Figure 2
Identification of ASEGs in YLX and HXS. (A and C) Multi-dimensional scaling (MDS) analysis of the expression profiles of alleles in different tissues and five developmental stages of fruit. Three replicates were used for each sample. YLX (A), HXS (C). (B and D) Overall comparison of the number of ASEGs between paternal and maternal haplotypes across different tissues/stages in YLX (B) and HXS (D). Asterisks denote significant differences determined by an independent t-test. ∗∗∗p < 0.001. (E and F) Comparison of promoter identity (E) and TE abundance (F) between promoter regions of ASEGs and non-ASEGs. Independent t-test. ∗∗∗p < 0.001. (G) Statistical Impact of SNPs in ASEGs. To illustrate proportional differences, this figure uses a percent stacked bar plot, with the actual gene counts indicated on the bars. “Trans” denotes direction-shifting ASEGs, and “Consis” represents consistent ASEGs. Red bars indicate ASEGs with high-impact variants, orange indicates those with moderate-impact variants, green represents ASEGs with low-impact variants, and blue indicates ASEGs with modifier low-impact variants. ASEGs from YLX and HXS were combined here. Hypergeometric tests were used to assess differences in high-impact genes between pairs (∗∗∗p < 0.001).
Figure 3
Figure 3
ASEGs involved in sugar biosynthesis, transformation, and transport. (A) Illustration of the sugar metabolism pathway, adapted from Qiao et al. (2018). (B) Sugar-related genes that show ASE in YLX. (C) Sugar-related genes that show ASE in HXS. Genes that show consistent ASE are highlighted in red. Glu, glucose; Fru, fructose; Sor, sorbitol; Suc, sucrose; F6P, fructose 6-phosphate; FRK, fructokinase; G1P, glucose 1-phosphate; G3P, glyceraldehyde 3-phosphate; G6P, glucose 6-phosphate; HXK, hexokinase; NAD-SDH, NAD-sorbitol dehydrogenase; PGI, phosphoglucose isomerase; PGM, phosphoglucomutase; S6P, sucrose 6-phosphate; SPS, sucrose phosphate synthase; SUS, sucrose synthase; SOX, sorbitol oxidase; UDPG, UDP-glucose; UGP, UDP-glucose pyrophosphorylase. INV, invertase; ST, sugar transporters; SWEET, SWEET transporter.
Figure 4
Figure 4
ASEGs involved in cuticular wax biosynthesis and transport. (A) Illustration of the cuticular wax biosynthesis and transport pathway, adapted from Ma et al. (2024). (B) Cuticular wax-related genes that show ASE in YLX. (C) Cuticular wax-related genes that show ASE in HXS. (D) Expression levels of the direction-shifting ASEG LACS4 at five fruit developmental stages in YLX and HXS. Genes that show consistent ASE are highlighted in red. LACS, long-chain acyl-CoA synthetase; KCR, β-ketoacyl-CoA reductase; KCS, β-ketoacyl-CoA synthase; ECR, enoyl-CoA reductase; HCD, 3-hydroxyacyl-CoA dehydratase; CYTB, cytochrome b; WSD, wax synthase/acyl-CoA:diacylglycerol acyltransferase; MAH, midchain alkane hydroxylase; CER, eceriferum; ABCG, ATP binding cassette G; LTPG, lipid transfer protein G.
Figure 5
Figure 5
ASEGs related to organic acid metabolism pathways. (A) Organic acid-related genes that show ASE in YLX. (B) Organic acid-related genes that show ASE in HXS. (C) Expression levels of the Ma1 gene at five fruit developmental stages in YLX and HXS. (D) Illustration of missing PyrusMa1 in haplotype B of YLX and HXS.Genes that show consistent ASE are highlighted in red. ACO, aconitase; FUM, fumarase; IDH, isocitrate dehydrogenase; MDH, NAD-malate dehydrogenase; OGDH, ketoglutarate dehydrogenase; PEPC, phosphoenolpyruvate carboxylase, ALMT, aluminum-activated malate transporter; VHA, V-type ATPase; tDT, tonoplast dicarboxylate transporter.
Figure 6
Figure 6
Construction of a pear pangenome graph and identification of SV hotspots. (A) Visualizing part of the pear pangenome graph (region: YLXB#Chr16B: 2 426 000–3 426 000). Paths in different colors represent different genomes. Within the pangenome graph, consensus regions of different genomes are marked by white frames. Different frames at the same locus indicate SNVs/SVs. If a white frame lacks a corresponding region, it means that this area is absent in other genomes (e.g., the last white frame). (B) Increase in pangenome length as more genomes are incorporated. Red indicates a noncore sequence, and brown indicates a core sequence present in all genomes. (C) Quantity of nonreference sequence in the pangenome graphs based on the minimum number of haplotypes in which it is present. (D) Size distribution of various structural variants (SVs) detected from the graph pangenome and population. The SVs identified from the graph pangenome are indicated in cyan, and the SVs recalled from pear population-level data are indicated in pink. (E) Chromosomal distribution of SVs. A 10-kb sliding window and 10-kb step size were used for plotting. Each bar on the chromosome represents the total number of SVs counted within a sliding window. The x axis represents the 17 pear chromosomes (Mb), and the y axis indicates the number of SVs. Windows with SV numbers in the top 5% were considered to be SV hotspots, and this threshold is indicated by the red line.
Figure 7
Figure 7
Presence–absence variations of the PyrusMa1 allele in the pear population and their associations with fruit acidity. (A) Number of wild and cultivated varieties in different groups of the pear population with 0/0, 0/1, and 1/1 genotypes for absence/presence of the PyrusMa1 allele. (B) Organic acid content of cultivars with three different PyrusMa1 genotypes. A Wilcoxon test was performed to evaluate the significance of differences between any two groups. (C) Selective sweep analysis involving the PyrusMa1 gene. The horizontal dotted line represents the 5% FST threshold. (D) Relative expression level of PyrusMa1 in control and PyrusMa1-overexpressing YLX fruit at 90 DAFB. (E) Relative expression level of PyrusMa1 in control and PyrusMa1-overexpressing YLX fruit at 150 DAFB. (F) Change in titratable acidity content after transient overexpression of PyrusMa1 in YLX fruit at 90 DAFB. (G) Change in titratable acidity content after transient overexpression of PyrusMa1 in YLX fruit at 150 DAFB. (H) Stable transformation of PyrusMa1 in pear calli. OE1 and OE2 represent two PyrusMa1-overexpressing lines. (I) Relative expression level of PyrusMa1 in pear calli. (J) Change in titratable acidity content of pear calli. Asterisks denote significant differences determined by independent Student’s t-tests. ∗p < 0.05; ∗∗p < 0.01; ∗∗∗p < 0.001.

Similar articles

Cited by

References

    1. Alonge M., Wang X., Benoit M., Soyk S., Pereira L., Zhang L., Suresh H., Ramakrishnan S., Maumus F., Ciren D., et al. Major Impacts of Widespread Structural Variation on Gene Expression and Crop Improvement in Tomato. Cell. 2020;182:145–161.e23. doi: 10.1016/j.cell.2020.05.021. - DOI - PMC - PubMed
    1. Aramaki T., Blanc-Mathieu R., Endo H., Ohkubo K., Kanehisa M., Goto S., Ogata H. KofamKOALA: KEGG Ortholog assignment based on profile HMM and adaptive score threshold. Bioinformatics. 2020;36:2251–2252. doi: 10.1093/bioinformatics/btz859. - DOI - PMC - PubMed
    1. Ashwini D., Tiwari S. Use of CTAB method for isolation of good quality and quantity of DNA. J. Pure Appl. Microbiol. 2015;9:2271–2274.
    1. Audano P.A., Sulovari A., Graves-Lindsay T.A., Cantsilieris S., Sorensen M., Welch A.E., Dougherty M.L., Nelson B.J., Shah A., Dutcher S.K., et al. Characterizing the Major Structural Variant Alleles of the Human Genome. Cell. 2019;176:663–675.e19. doi: 10.1016/j.cell.2018.12.019. - DOI - PMC - PubMed
    1. Bai S., Tao R., Tang Y., Yin L., Ma Y., Ni J., Yan X., Yang Q., Wu Z., Zeng Y., et al. BBX16, a B-box protein, positively regulates light-induced anthocyanin accumulation by activating MYB10 in red pear. Plant Biotechnol. J. 2019;17:1985–1997. doi: 10.1111/pbi.13114. - DOI - PMC - PubMed

LinkOut - more resources