. 2024 Feb;139(1):575-635.
doi: 10.1093/qje/qjad036. Epub 2023 Sep 5.

REPRESENTATION AND EXTRAPOLATION: EVIDENCE FROM CLINICAL TRIALS

Affiliations

REPRESENTATION AND EXTRAPOLATION: EVIDENCE FROM CLINICAL TRIALS

Marcella Alsan et al. Q J Econ. 2024 Feb.

Abstract

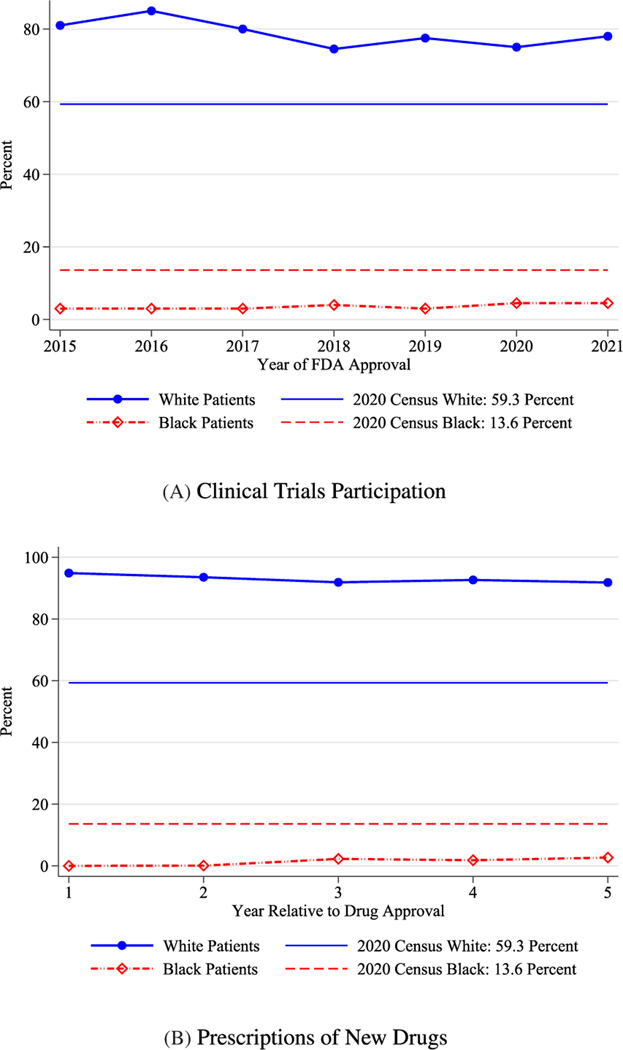
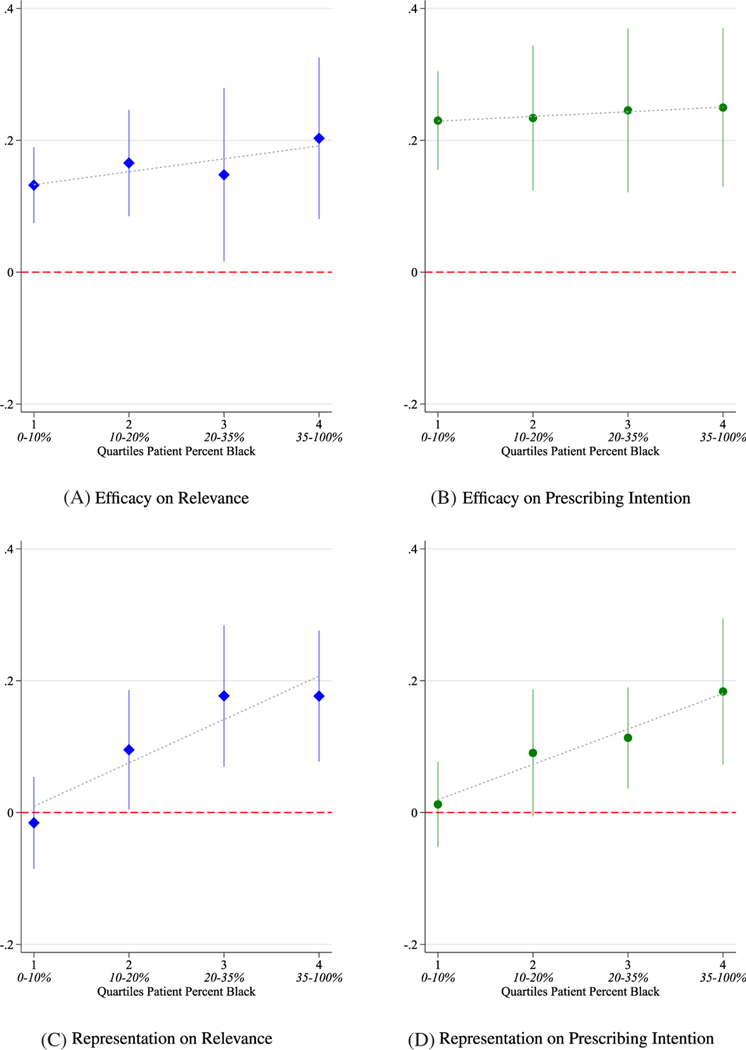
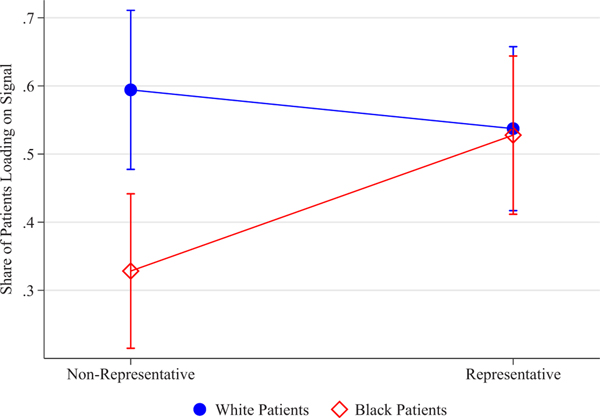
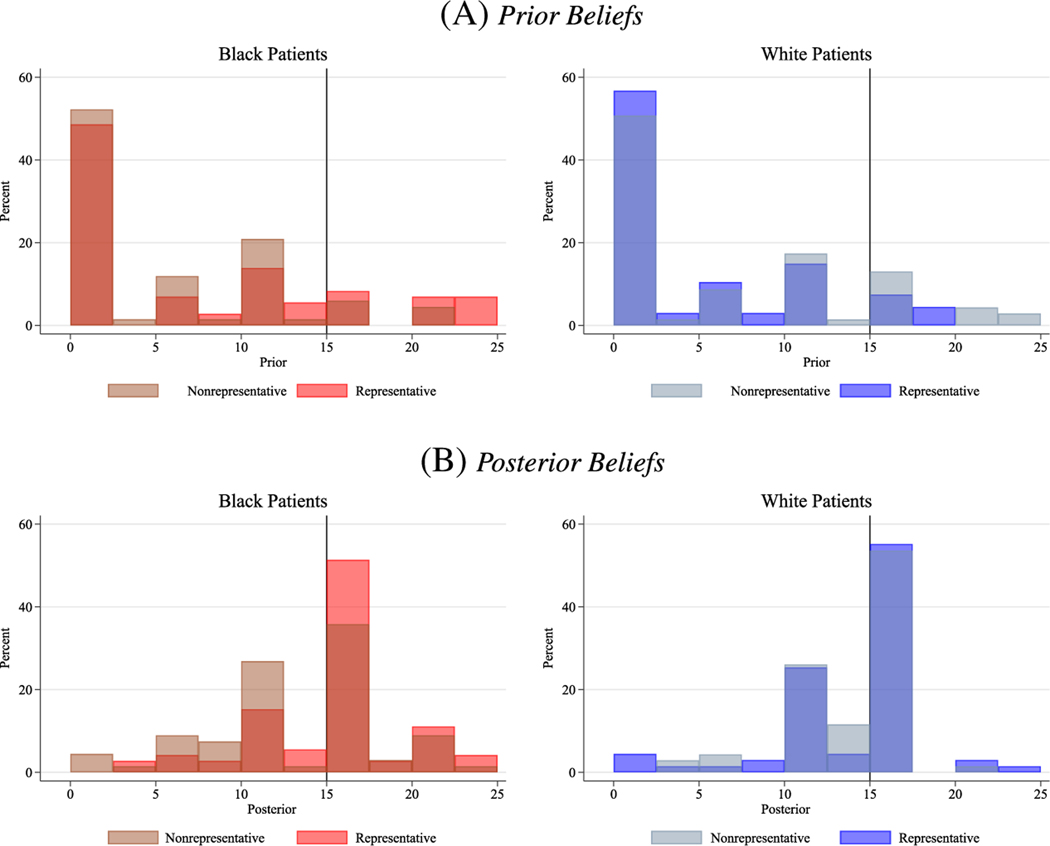
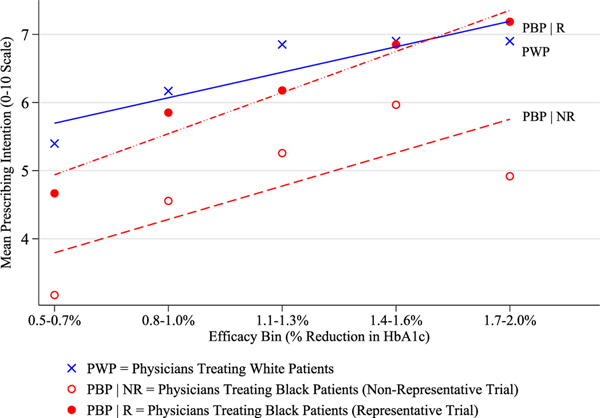
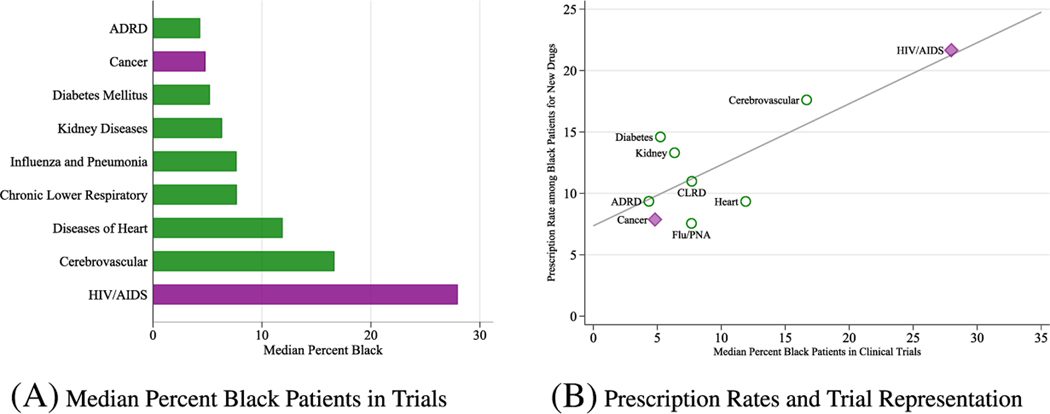
This article examines the consequences and causes of low enrollment of Black patients in clinical trials. We develop a simple model of similarity-based extrapolation that predicts that evidence is more relevant for decision-making by physicians and patients when it is more representative of the group being treated. This generates the key result that the perceived benefit of a medicine for a group depends not only on the average benefit from a trial but also on the share of patients from that group who were enrolled in the trial. In survey experiments, we find that physicians who care for Black patients are more willing to prescribe drugs tested in representative samples, an effect substantial enough to close observed gaps in the prescribing rates of new medicines. Black patients update more on drug efficacy when the sample that the drug is tested on is more representative, reducing Black-white patient gaps in beliefs about whether the drug will work as described. Despite these benefits of representative data, our framework and evidence suggest that those who have benefited more from past medical breakthroughs are less costly to enroll in the present, leading to persistence in who is represented in the evidence base.

Keywords: D91; I12; I14; O31; O33.


Figures

F<sc>igure</sc> I
Figure I. Racial Disparities in the Development and Distribution of New Drugs
Panel A plots the median enrollee percentage by race (Black and white) for pivotal clinical trials, studies that support new-drug applications to the FDA, over time. Panel B plots the median new drug prescription percentage by race in each year relative to its approval. Straight lines in Panels A and B plot population shares by race in the United States as reported in the 2020 census (Black population share is 13.6% and non-Hispanic white population share is 59.3%; U.S. Census Bureau 2021). Panel A is drawn from the FDA Drug Trials Snapshots data, and Panel B is from the Medical Expenditure Panel Survey data (Agency for Healthcare Research and Quality 2022). Online Appendix Figure B1 plots Panel A using a longer time series from ClinicalTrials.gov. Online Appendix Figure B2 plots the distribution of race in trials using both the ClinicalTrials.gov and FDA Drug Trials Snapshots data sets. Online Appendix Figure B4 plots prescribing rates of new drugs per 1,000 individuals in each racial group.
F<sc>igure</sc> II
Figure II. Heterogeneity among Physicians by Racial Composition of Patient Panel
The figure plots OLS estimates for two outcomes—Relevance (Panels A and C) and Prescribing Intention (Panels B and D)—from specifications estimated with interaction terms between each quartile of patient percent Black and either Representation or Efficacy. Fixed effects are residualized before estimating equation (2). The figure plots the linear combination of the main effect and the interaction with each quartile; quartile one is defined as the reference. Robust standard errors are clustered at the physician level. Ninety-five percent confidence intervals are displayed.
F<sc>igure</sc> III
Figure III. Loading on Signal by Race and Treatment Status
The figure plots the share of respondents who “Load on Signal”—whose posteriors are within 1 mmHg of the reported drug efficacy in our intervention (15 mmHg)—by race and treatment group. Load on Signal is an indicator variable that takes a value of 1 if the respondent’s posterior was between 14 and 16, and 0 otherwise. The x-axis reports values for two groups of respondents: nonrepresentative trials with < 1% Black patients and representative trials with 15% Black patients. Results are plotted separately by respondent race. Ninety-five percent confidence intervals are included.
F<sc>igure</sc> IV
Figure IV. Prior and Posterior Beliefs on Drug Efficacy by Patient Race and Trial Representation
The figure plots the prior and posterior distribution of beliefs about the perceived efficacy of the new antihypertensive medication for the patient’s own condition by respondent’s race and assigned treatment status (trial shown is either nonrepresentative or representative). The signal on efficacy shown to patients (15 mmHg) is displayed as a black vertical line and was revealed to patients following elicitation of priors. A Kolmogorov-Smirnov test fails to reject the null that the priors are identical across race (p-value = .960). For Black patients, a Kolmogorov-Smirnov test rejects the null that the posteriors are identical across arms (p-value = .026). For white patients, a Kolmogorov-Smirnov test fails to reject the null that the posteriors are identical across arms (p-value = .789).
F<sc>igure</sc> V
Figure V. Physician Prescribing Intention by Patient Composition and Trial Representation
The figure plots the relationship between Efficacy and Prescribing Intention (on a 0–10 scale) by patient composition and percent Black of trial subjects in the profiles shown to physicians. PBP (physicians treating Black patients) denotes physicians who report above the median percent Black patients in their patient panel. PWP (physicians treating white patients) is defined similarly with respect to white patients. NR indicates nonrepresentative (< 5% Black in trial) whereas R indicates representative (≥ 5% Black in trial). Note that 5% is the median percent Black in clinical trials (see Figure I).
F<sc>igure</sc> VI
Figure VI. Trial Representation by Condition and Association with New Drug Prescribing
Panel A plots the median share of Black patients in trials across HIV/AIDS and the 10 leading causes of death (excluding unintentional injuries and suicide) in the United States (Heron 2021). Data on trial composition are from ClinicalTrials.gov. Panel B plots the correlation between the prescription rate of new medications to Black Americans and the median percent Black in pivotal trials. We construct the prescription rate as the percentage of newly marketed drugs (on the market for five or fewer years) received by Black Americans in each major condition category. In Panel B, the y-axis value of Cancer includes outpatient cancer supportive therapies. CLRD, Diabetes, Heart, Kidney, and Flu/PNA indicate chronic lower respiratory diseases, diabetes mellitus, diseases of heart, kidney diseases, and influenza and pneumonia, respectively. Prescription data are from the Medical Expenditure Panel Survey. Observations associated with cancer and HIV/AIDS are denoted with diamonds (purple). See Online Appendix H for details.

Similar articles

Cited by

References

    1. Acemoglu Daron, Cutler David, Finkelstein Amy, and Linn Joshua, “Did Medicare Induce Pharmaceutical Innovation?,” American Economic Review, 96 (2006), 103–107. 10.1257/000282806777211766 - DOI - PubMed
    1. Acemoglu Daron, and Linn Joshua, “Market Size in Innovation: Theory and Evidence from the Pharmaceutical Industry,” Quarterly Journal of Economics, 119 (2004), 1049–1090. 10.1162/0033553041502144 - DOI
    1. Agency for Healthcare Research and Quality, “MEPS Prescribed Medicine Files 1996–2019,” 2022, https://meps.ahrq.gov/mepsweb/data_stats/download_data_files.jsp.
    1. Agha Leila, and Molitor David, “The Local Influence of Pioneer Investigators on Technology Adoption: Evidence from New Cancer Drugs,” Review of Economics and Statistics, 100 (2018), 29–44. 10.1162/REST_a_00670 - DOI - PMC - PubMed
    1. Aghion Philippe, Akcigit Ufuk, Bergeaud Antonin, Blundell Richard, and Hémous David, “Innovation and Top Income Inequality,” Review of Economic Studies, 86 (2019), 1–45. 10.1093/restud/rdy027 - DOI