

Chronobiology of Viscum album L.: a time series of daily metabolomic fingerprints spanning 27 years
- PMID: 38860114
- PMCID: PMC11163206
- DOI: 10.3389/fphys.2024.1396212
Chronobiology of Viscum album L.: a time series of daily metabolomic fingerprints spanning 27 years
Abstract
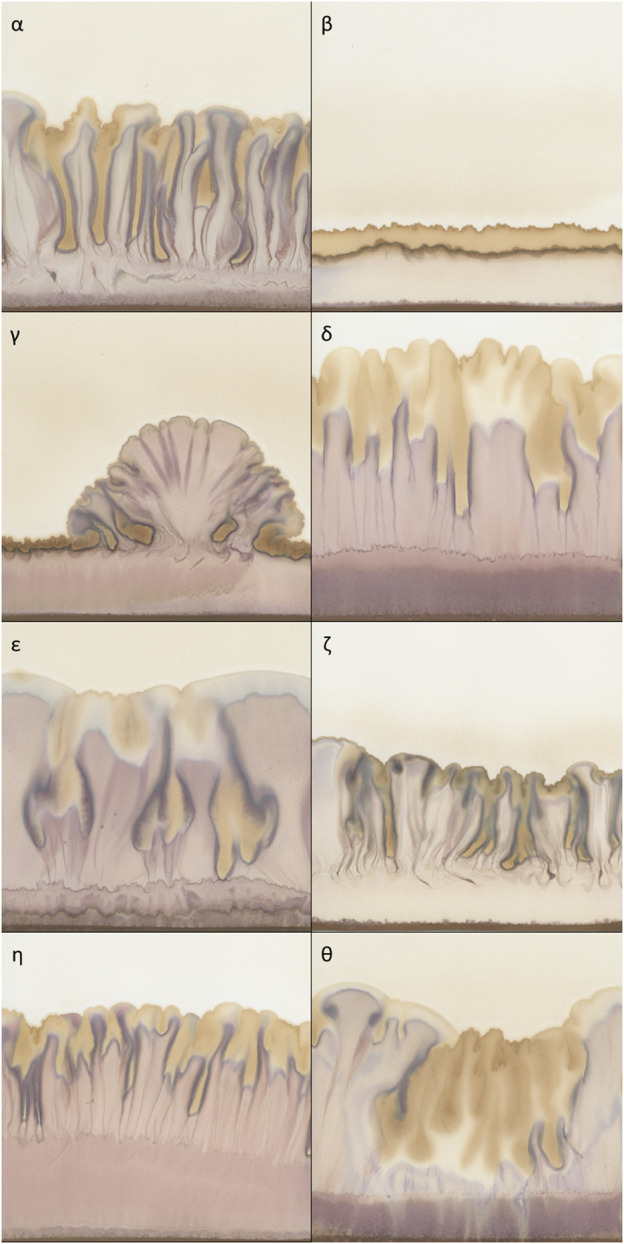
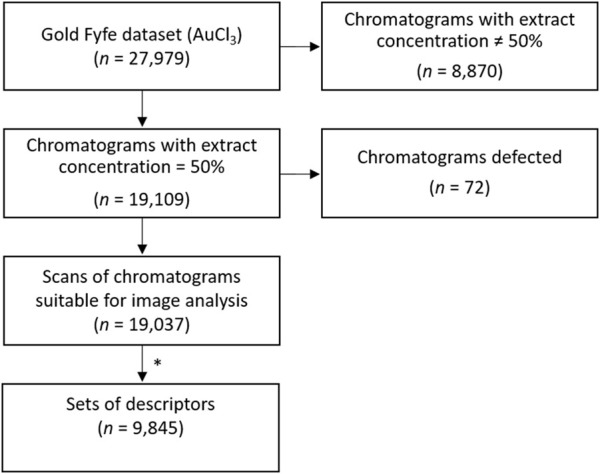
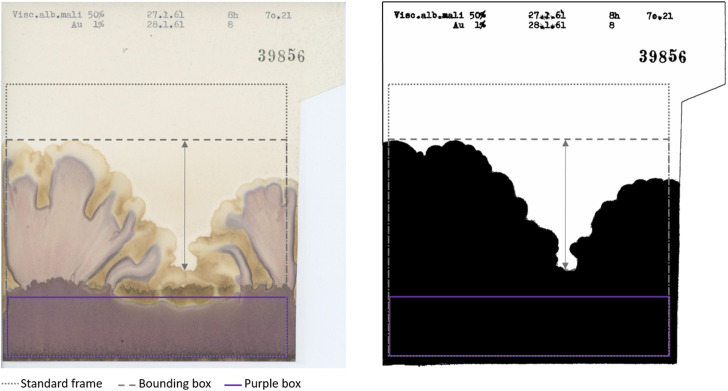
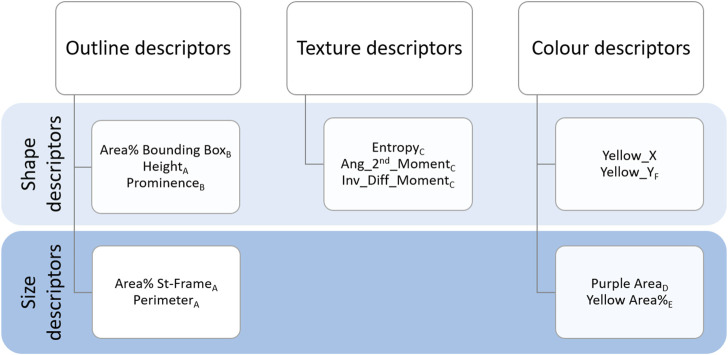
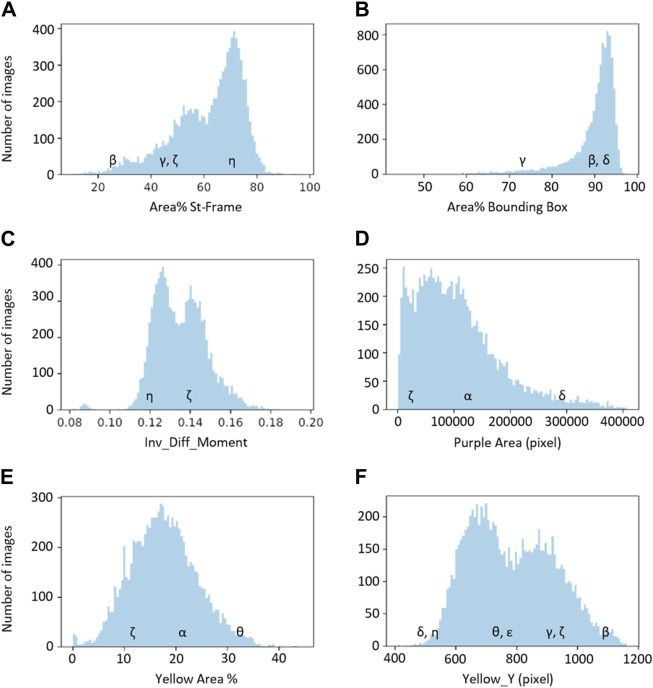
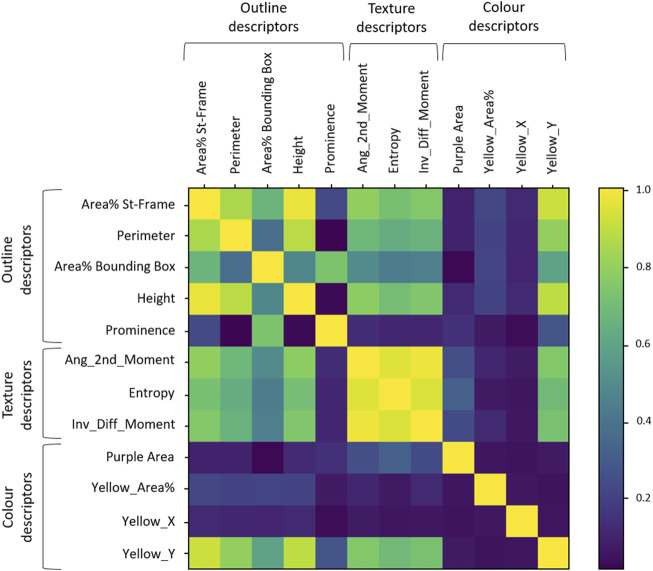
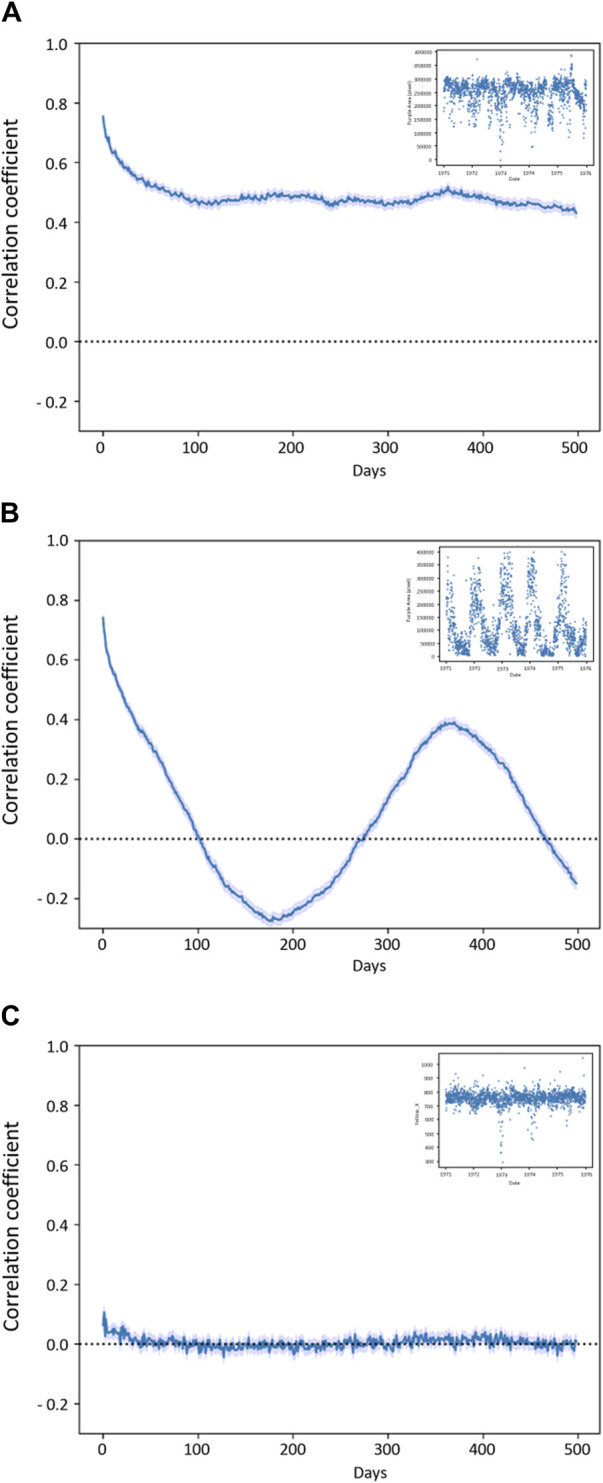
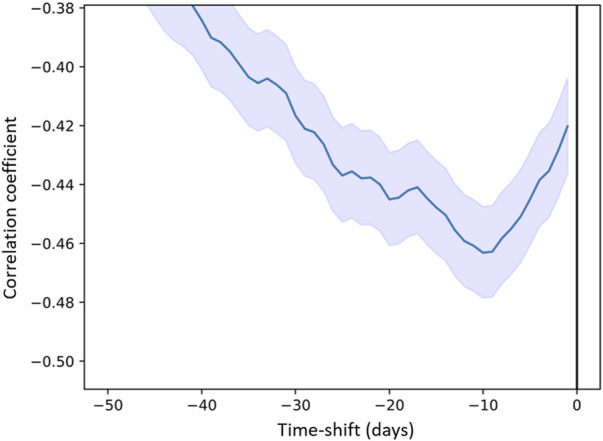
Introduction: European mistletoe (Viscum album L.) has been gaining increasing interest in the field of oncology as a clinically relevant adjunctive treatment in many forms of cancer. In the field of phytopharmacology, harvesting time is pivotal. In the last century, a form of metabolomic fingerprinting based on pattern formation was proposed as a way to determine optimal harvesting times to ensure high quality of mistletoe as raw material for pharmaceutical use. In order to further evaluate the information obtained with this metabolomic fingerprinting method, we analysed a large time series of previously undigitised daily mistletoe chromatograms dating back to the 1950s. Methods: These chromatograms were scanned and evaluated using computerized image analysis, resulting in 12 descriptors for each individual chromatogram. We performed a statistical analysis of the data obtained, investigating statistical distributions, cross-correlations and time self-correlations. Results: The analysed dataset spanning about 27 years, contains 19,037 evaluable chromatograms in daily resolution. Based on the distribution and cross-correlation analyses, the 12 descriptors could be clustered into six independent groups describing different aspects of the chromatograms. One descriptor was found to mirror the annual rhythm being well correlated with temperature and a phase shift of 10 days. The time self-correlation analysis showed that most other descriptors had a characteristic self-correlation of ∼50 days, which points to further infradian rhythms (i.e., more than 24 h). Discussion: To our knowledge, this dataset is the largest of its type. The combination of this form of metabolomic fingerprinting with the proposed computer analysis seems to be a promising tool to characterise biological variations of mistletoe. Additional research is underway to further analyse the different rhythms present in this dataset.
Keywords: chronobiology; image analysis; medicinal plants; metabolomic fingerprinting; mistletoe; pattern formation.
Copyright © 2024 Guglielmetti, Baumgartner, Scherr, Martin and Tournier.
Conflict of interest statement
The authors declare that the research was conducted in the absence of any commercial or financial relationships that could be construed as a potential conflict of interest.
Figures
Similar articles
-
Viscotoxins, mistletoe lectins and their isoforms in mistletoe (Viscum album L.) extracts Iscador.Arzneimittelforschung. 2006 Jun;56(6A):428-34. doi: 10.1055/s-0031-1296808. Arzneimittelforschung. 2006. PMID: 16927522
-
Use and safety of intratumoral application of European mistletoe (Viscum album L) preparations in Oncology.Integr Cancer Ther. 2015 Mar;14(2):140-8. doi: 10.1177/1534735414563977. Epub 2014 Dec 30. Integr Cancer Ther. 2015. PMID: 25552476
-
Proteomic fingerprinting of mistletoe (Viscum album L.) via combinatorial peptide ligand libraries and mass spectrometry analysis.J Proteomics. 2017 Jul 5;164:52-58. doi: 10.1016/j.jprot.2017.05.025. Epub 2017 May 29. J Proteomics. 2017. PMID: 28571969
-
Viscum album (mistletoe) extract for dogs with cancer?Front Vet Sci. 2024 Jan 3;10:1285354. doi: 10.3389/fvets.2023.1285354. eCollection 2023. Front Vet Sci. 2024. PMID: 38234984 Free PMC article. Review.
-
[Mistletoe (Viscum album) preparations: an optional drug for cancer patients?].Harefuah. 2006 Jan;145(1):42-6, 77. Harefuah. 2006. PMID: 16450726 Review. Hebrew.
References
-
- Aono Y., Kazui K. (2008). Phenological data series of cherry tree flowering in Kyoto, Japan, and its application to reconstruction of springtime temperatures since the 9th century. Int. J. Climatol. 28, 905–914. 10.1002/joc.1594 - DOI