. 2024 May 27:12:1393413.
doi: 10.3389/fbioe.2024.1393413. eCollection 2024.

Computational analysis of cancer cell adhesion in curved vessels affected by wall shear stress for prediction of metastatic spreading

Affiliations

Computational analysis of cancer cell adhesion in curved vessels affected by wall shear stress for prediction of metastatic spreading

Nahid Rahmati et al. Front Bioeng Biotechnol. .

Abstract

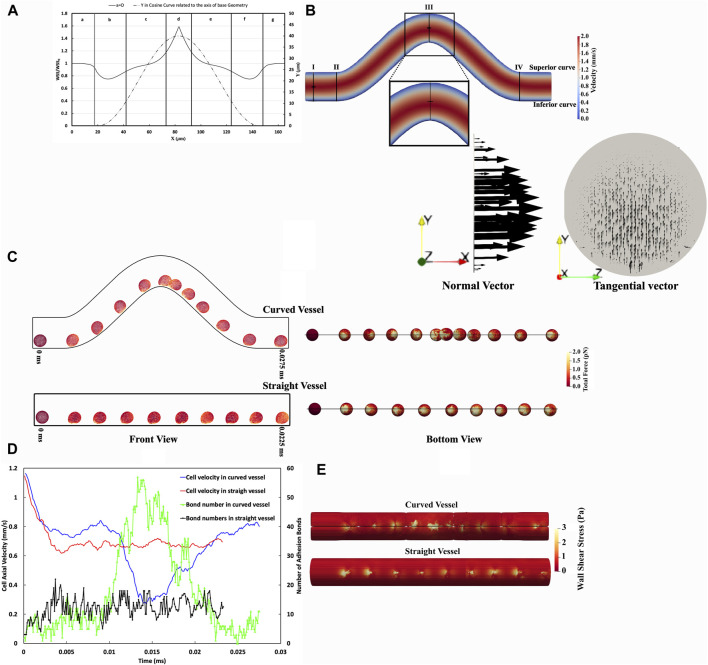
Introduction: The dynamics of circulating tumor cells (CTCs) within blood vessels play a pivotal role in predicting metastatic spreading of cancer within the body. However, the limited understanding and method to quantitatively investigate the influence of vascular architecture on CTC dynamics hinders our ability to predict metastatic process effectively. To address this limitation, the present study was conducted to investigate the influence of blood vessel tortuosity on the behaviour of CTCs, focusing specifically on establishing methods and examining the role of shear stress in CTC-vessel wall interactions and its subsequent impact on metastasis. Methods: We computationally simulated CTC behaviour under various shear stress conditions induced by vessel tortuosity. Our computational model, based on the lattice Boltzmann method (LBM) and a coarse-grained spectrin-link membrane model, efficiently simulates blood plasma dynamics and CTC deformability. The model incorporates fluid-structure interactions and receptor-ligand interactions crucial for CTC adhesion using the immersed boundary method (IBM). Results: Our findings reveal that uniform shear stress in straight vessels leads to predictable CTC-vessel interactions, whereas in curved vessels, asymmetrical flow patterns and altered shear stress create distinct adhesion dynamics, potentially influencing CTC extravasation. Quantitative analysis shows a 25% decrease in the wall shear stress in low-shear regions and a 58.5% increase in the high-shear region. We observed high-shear regions in curved vessels to be potential sites for increased CTC adhesion and extravasation, facilitated by elevated endothelial expression of adhesion molecules. This phenomenon correlates with the increased number of adhesion bonds, which rises to approximately 40 in high-shear regions, compared to around 12 for straight vessels and approximately 5-6 in low-shear regions. The findings also indicate an optimal cellular stiffness necessary for successful CTC extravasation in curved vessels. Discussion: By the quantitative assessment of the risk of CTC extravasation as a function of vessel tortuosity, our study offers a novel tool for the prediction of metastasis risk to support the development of personalized therapeutic interventions based on individual vascular characteristics and tumor cell properties.

Keywords: cancer models; cell adhesion; computational biophysics; metastasis; microvessel configuration.


Conflict of interest statement

The authors declare that the research was conducted in the absence of any commercial or financial relationships that could be construed as a potential conflict of interest.

Figures

FIGURE 1
FIGURE 1
The flowchart illustrating the algorithm employed in the present study.
FIGURE 2
FIGURE 2
Comparison of deformation of a capsule freely flowing in a capillary between our results and Takeishi et al. (2016). The investigation examines two distinct shear rate values, denoted as capillary numbers: Ca = 0.02 (left) and Ca = 0.052 (right), considering a Dc/Dv ratio of 0.77.
FIGURE 3
FIGURE 3
Comparative Analysis of Adhesion States: (A–C) findings obtained from Wang et al. (2021) under CC-BY 4.0: https://creativecommons.org/licenses/by/4.0/ license, (D–F) from our findings for the last 4 times, Re = 0.1 scenario. The detachment state (A and D) emerges under Ca = 0.015 and Koff = 1.0 conditions. The rolling adhesion state (B and E) is observed at Ca = 0.005 and Koff = 0.01. Meanwhile, the firm adhesion state (C and F) is pronounced at Ca = 0.015 and Koff = 0.01. (G) Temporal Changes in Translational Velocity observed across the three adhesion states. The Reynolds number is equal to 0.1, while K on remains consistent at 10. Detachment transpires under Ca = 0.015 with K off = 1; rolling adhesion manifests at Ca = 0.005 with K off = 0.01; and firm adhesion prevails at Ca = 0.015 with K off = 0.01.
FIGURE 4
FIGURE 4
Comparative Analysis of CTC Adhesion and Rolling in Curved Versus Straight Vessels. (A) Spatial distribution WSS ratio on the inferior curvature in the curved vessel relative to a straight one considering pure blood flow without any cell with the same Reynolds number. (B) The velocity contour dynamics in a curved vessel. The maximum velocity in the straight part (Section aa) occurs at the midpoint of this section, whereas, in the high shear stress region (Section cc), the maximum velocity is skewed toward the inferior curve. (C) Temporal sequence of CTC transiting through curved vessel and straight vessel every 0.0025 ms, front view (right), and bottom view (left). These temporal sequences highlight variations in CTC deformation and experience force. (D) The temporal variation of CTC velocity and adhesion bonds in vascular geometries, illustrating the differences in CTC velocity and the quantity of adhesion bonds as cells traverse through both curved and straight vessels. In the straight vessel, cell velocity and adhesion bonds are comparatively uniform, in contrast to the curved vessel, where these parameters fluctuate in response to the variable WSS, as indicated in panel (A). (E) The WSS distribution in the vicinity of CTCs, illustrating uniform WSS in the straight vessel and variable WSS in the curved vessel, correlating with regions of high and low cell adhesion. It is worth mentioning that the visible lines in the curved vessel contour represent a visualization artifact resulting from the merging of data processed by multiple processors in ParaView.
FIGURE 5
FIGURE 5
Dependency of dynamics of CTC on Wall shear stress in curved vascular configurations. (A) The relationship between the number of adhesion bonds and the WSS ratio. (B) The relationship between cell residence time and WSS ratio. (C) the trajectory of cells in the x-y plane, with colours representing the residence time of cells within the curved vascular domain.
FIGURE 6
FIGURE 6
The effect of varying Poff on cellular behavior in terms of axial cell velocity, bond numbers, and aspect ratio. (A–B) The temporal and spatial evolutions of cell axial velocity. Increasing Poff increases the cell axial velocity in low-shear regions and reduces it in the high-shear region, influencing the likelihood of cell detachment in low-shear regions and subsequent reattachment in the high-shear region, particularly at higher Poff values of −10 and −20. (C) the total number of adhesion bonds as cells traverse the curved vessel, showing that an increase in Poff leads to fewer bonds in low shear regions (regions II and VI in Figure 4A) due to elevated rupture rates, while in the high shear region (region IV in Figure 4A), bond numbers increase, potentially leading to firm adhesion when Poff exceeds an absolute value of 10. (D) The spatial variation in cell aspect ratio, reflecting cell deformation in response to bond dynamics and shear. An increased deformability is observed in the high shear region (region IV in Figure 4A) and reduced deformation in the low shear regions (regions II and VI in Figure 4A) with increasing Poff ; in cases of detachment, the cell deforms back, indicated by a decreasing aspect ratio toward zero to recover a spherical shape.
FIGURE 7
FIGURE 7
Analysis of the effect of the vessel Tortuosity Index (TI) on cell adhesion dynamics. (A) Temporal variation of cell velocity across different TIs, demonstrating the influence of vessel tortuosity on the transit time of CTC through the curved vessels. (B) Spatial variation of CTC velocity for varying TIs, showing consistent speeds at the initial straight part (x < 20 µm) and divergent behaviours in the low shear region (20–40 µm). In the high shear region, especially near x = 90 μm, the velocity substantially decreases with higher TIs, showcasing a trend of reducing minimum velocity as TI increases, which is indicative of stronger cell adhesion in regions of greater curvature. (C) Adhesion force mapping along the vessel path, with distinct peaks at high shear region VI or different curve amplitudes, revealing a higher adhesion force and a lower bond rupture rate for vessels of higher TIs. (D) Variation in the aspect ratio of CTCs indicative of cell deformation through the curved vessel, comparing different TIs. (E) Minimum cell velocity, maximum and minimum cell aspect ratio, and their difference as a function of TI, emphasizing the deceleration of cells and increase in cell deformation at higher TIs. (F) Maximum adhesion force as a function of the TI, emphasizing an increase in adhesion forces at higher TIs in the high shear region around x = 90 μm, and estimation of the most likely position for maximum cell adhesion and minimum velocity, with a shift towards larger x values for lower TIs, but occurring nearer to the peak curvature for higher TIs, suggesting increased chances of cell extravasation due to stronger adhesion.
FIGURE 8
FIGURE 8
Analysis of the effect of CTC shear moduli on its deformation. (A) Stretch test simulation on CTCs with different stiffness. Top: undeformed CTC; Bottom: CTCs with various shear moduli under tension force of 2000 pN; (B) Aspect Ratio-Tension Force obtained from numerical simulation of stretch test.
FIGURE 9
FIGURE 9
Analysis of the effect of CTC stiffness on its adhesion dynamics. (A) Temporal variation of cell velocity across different cell shear moduli, demonstrating the influence of cell stiffness on the transit time of the CTC through the curved vessels. (B) Spatial variation of CTC velocity for varying cell stiffness, showing divergent behaviours in the low-shear region (20–40 µm) for varying stiffness specifically for very soft cells, indicating the cell detachment in the low-shear region. (C) Adhesion force mapping along the vessel path, with distinct peaks at high-shear regions for cells of different shear moduli, revealing a higher adhesion force and a lower bond rupture rate for softer cells, assuming cell attachment in the low-shear region. (D) Variation in the aspect ratio of CTCs indicative of cell deformation through the curved vessel for different cell stiffnesses. (E) Minimum cell velocity, maximum and minimum cell aspect ratio, and their difference (ΔAR) as a function of the shear modulus of the cell, emphasizing the deceleration of cells and increase in cell deformation for softer cells, in case of rolling over whole domain (F) Maximum adhesion force as a function of the shear modulus of the cell, emphasizing a decrease in adhesion forces for the stiffest CTCs in the high shear region around x = 90 μm, suggesting increased chances of cell extravasation due to stronger adhesion; and estimation of the most likely position for maximum cell adhesion and minimum velocity, with a shift towards larger x values for softer cells, but occurring nearer to the peak curvature for the stiffest CTCs.

Similar articles

Cited by

References

    1. Anvari S., Nambiar S., Pang J., Maftoon N. (2021). Computational models and simulations of cancer metastasis. Arch. Comput. Methods Eng. 28, 4837–4859. 10.1007/s11831-021-09554-1 - DOI
    1. Anvari S., Osei E., Maftoon N. (2022). Interactions of platelets with circulating tumor cells contribute to cancer metastasis. Sci. Rep. 11, 15477. 10.1038/s41598-021-94735-y - DOI - PMC - PubMed
    1. Arabghahestani M., Poozesh S., Akafuah N. K. (2019). Advances in computational fluid mechanics in cellular flow manipulation: a review. Appl. Sci. 9, 4041. 10.3390/app9194041 - DOI
    1. Azizi Tarksalooyeh V. W., Závodszky G., van Rooij J. M., Hoekstra A. G. (2018). Inflow and outflow boundary conditions for 2D suspension simulations with the immersed boundary lattice Boltzmann method. Comput. Fluids 172, 312–317. 10.1016/j.compfluid.2018.04.025 - DOI
    1. Bagnall J. S., Byun S., Begum S., Miyamoto D. T., Hecht V. C., Maheswaran S., et al. (2015). Deformability of tumor cells versus blood cells. Sci. Rep. 5, 1–11. 10.1038/srep18542 - DOI - PMC - PubMed

LinkOut - more resources