Review
. 2024 Jun 7:12:e17556.
doi: 10.7717/peerj.17556. eCollection 2024.

Research advances in predicting the expansion of hypertensive intracerebral hemorrhage based on CT images: an overview

Affiliations
Review

Research advances in predicting the expansion of hypertensive intracerebral hemorrhage based on CT images: an overview

Min Ai et al. PeerJ. .

Abstract

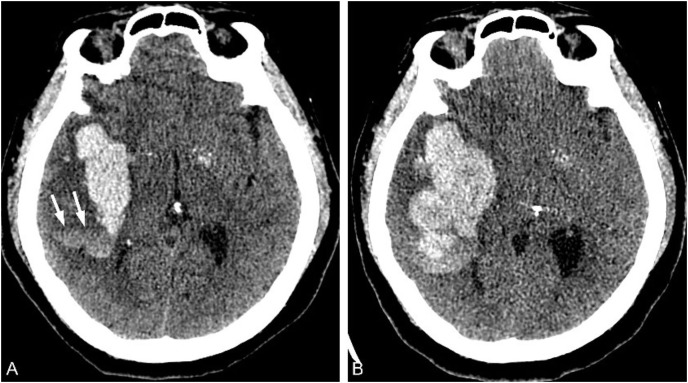
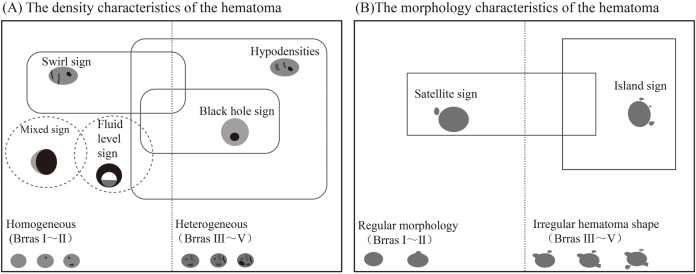
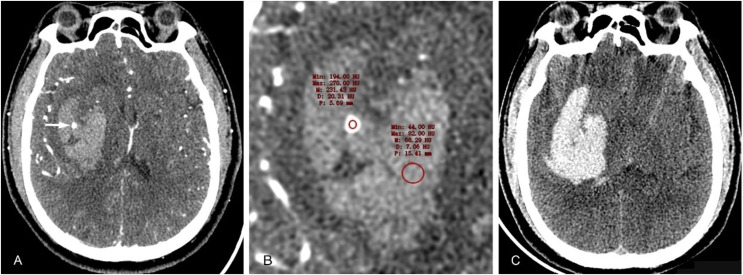
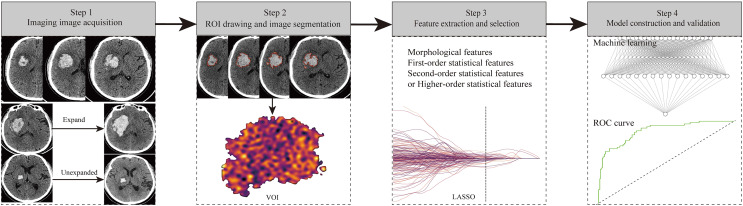
Hematoma expansion (HE) is an important risk factor for death or poor prognosis in patients with hypertensive intracerebral hemorrhage (HICH). Accurately predicting the risk of HE in patients with HICH is of great clinical significance for timely intervention and improving patient prognosis. Many imaging signs reported in literatures showed the important clinical value for predicting HE. In recent years, the development of radiomics and artificial intelligence has provided new methods for HE prediction with high accuracy. Therefore, this article reviews the latest research progress in CT imaging, radiomics, and artificial intelligence of HE, in order to help identify high-risk patients for HE in clinical practice.

Keywords: Artificial intelligence; Hematoma expansion; Hypertensive intracerebral hemorrhage; Imaging signs; Radiomics.


Conflict of interest statement

The authors declare that they have no competing interests.

Figures

Figure 1
Figure 1. Irregular hematoma shape and heterogeneous hematoma density.
A 71-year-old male patient was admitted to the hospital with a sudden weakness in his left limb that lasted for 1 h, and he had previously experienced a maximum blood pressure of 190/100 mmHg. (A) Irregular hematoma shape; (B) Heterogeneous hematoma density.
Figure 2
Figure 2. Hypodensity sign.
A 73-year-old man was admitted to the hospital with sudden dizziness and weakness in his left limb for 2 h. The patient had a history of hypertension for over 2 years, and his blood pressure upon admission was 183/101 mmHg. (A) He was admitted to the hospital 2 h after the onset of the disease for a CT examination. Clumps of high-density hematoma were found in the right basal ganglia, and low-density shadows were observed in the lesion that were not connected with the surrounding brain parenchyma (arrow). (B) The CT examination conducted 14 h after the onset of the disease revealed a significant increase in hematoma volume and its occupying effect.
Figure 3
Figure 3. Black hole sign.
A 50-year-old male patient was admitted to the hospital with a sudden headache, dizziness, and weakness in his right limb for 2 h. His blood pressure was 141/82 mmHg. (A) CT examination conducted 2 h after the onset of the patient revealed a high-density hematoma shadow in the left basal ganglia, with a small round low-density shadow inside that was not connected to the surrounding cerebral parenchyma and had clear boundaries. (B) The CT value of the low-density area was approximately 32 Hounsfield units lower than that of the high-density hematoma in the periphery. (C) The CT examination conducted at 4.75 h after the onset of the disease revealed a significant increase in hematoma volume, an intensified occupying effect, and cerebral herniation accompanied by subarachnoid blood and ventricular system involvement.
Figure 4
Figure 4. Blend sign.
A 55-year-old male patient was admitted to the hospital for 4 h due to sudden weakness in his left limb. The patient had a history of hypertension for many years and presented with a blood pressure of 181/100 mmHg upon admission. (A) A plain CT scan conducted 4.5 h after the onset of the patient revealed a high-density hematoma in the right hemioval center, with a clearly demarcated area of high density and an adjacent area of relatively low density. (B) CT examination 11 h after the onset of the disease showed that the hematoma volume increased.
Figure 5
Figure 5. Swirl sign.
A 65-year-old male patient presented with sudden left limb weakness for over an hour upon admission and had a blood pressure reading of 248/112 mmHg. (A) A total of 1 h after the onset of the patient, a high-density hematoma shadow was observed in the right basal ganglia on CT examination. Inside, there was a low-density bar shadow known as the swirl sign (arrow). (B) The CT examination conducted at 7.5 h after the onset of the disease revealed an increase in hematoma volume and occupying effect.
Figure 6
Figure 6. Island sign.
A 78-year-old male patient was admitted to the hospital due to left limb weakness and slurred speech that had lasted for over an hour. He had a history of hypertension for more than 10 years, and his blood pressure upon admission was 183/101 mmHg. (A) CT examination conducted 1 h after the onset of the patient revealed a hematoma in the right basal ganglia area, surrounded by four small hematoma shadows that were separated from the main hematoma (arrow). (B) The CT reexamination about 8.5 h after the onset of the patient showed that the volume of hematoma had increased and the occupying effect was slightly aggravated.
Figure 7
Figure 7. Satellite sign.
A 58-year-old male patient was admitted to the hospital with a sudden disturbance of consciousness and dysfunction in his right limb for 2 h. He had a history of hypertension for several years, and his blood pressure measured 186/116 mmHg. (A) The CT examination conducted 2 h after the onset of the patient revealed a high-density hematoma shadow near the left ventricle and a small hematoma surrounding the main hematoma. (B) CT examination conducted approximately 6 h after the onset of the disease revealed a significant increase in hematoma volume and occupying effect.
Figure 8
Figure 8. Fluid level sign.
A 66-year-old female patient was admitted to the hospital because of sudden dizziness accompanied by weakness in her left limb that lasted for more than 5 h. She had been diagnosed with hypertension for over 7 years, and her blood pressure measured at 192/101 mmHg. (A) CT examination conducted approximately 5 h after the onset of the disease revealed a high-density hematoma in the right basal ganglia and temporal lobe, with uneven density and stratified signs (arrow). (B) CT reexamination conducted about 15 h after the onset of the disease revealed an increase in both hematoma volume and occupying effect.
Figure 9
Figure 9. Schematic diagram of potential overlap between CT plain scan imaging signs.
(A) The density characteristics of the hematoma. (B) The morphology characteristics of the hematoma.
Figure 10
Figure 10. CTA spot sign.
A 40-year-old male patient with a history of hypertension for many years was admitted due to sudden left limb weakness and loss of consciousness for 2 h, with a blood pressure of 214/119 mmHg. (A) CTA examination conducted about 2 h after the onset of the disease revealed a high-density hematoma shadow in the right basal ganglia, with a CT value of approximately 68HU. Additionally, there was a separate contrast agent aggregation shadow (dot sign) that was not connected to the surrounding blood vessels. (B) The CT value of the contrast media in the hematoma was 231HU. (C) The CT examination, conducted 4.7 h after the onset of the disease, revealed a significant increase in hematoma volume.
Figure 11
Figure 11. The flow chart of radiomics study design.

Similar articles

Cited by

References

    1. Al-Ajlan FS, Gladstone DJ, Song D, Thorpe KE, Swartz RH, Butcher KS, Del Campo M, Dowlatshahi D, Gensicke H, Lee GJ, Flaherty ML, Hill MD, Aviv RI, Demchuk AM. Time course of early hematoma expansion in acute spot-sign positive intracerebral hemorrhage: prespecified analysis of the SPOTLIGHT randomized clinical trial. Stroke. 2023;54(3):715–721. doi: 10.1161/STROKEAHA.121.038475. - DOI - PubMed
    1. Al-Shahi Salman R, Frantzias J, Lee RJ, Lyden PD, Battey TWK, Ayres AM, Goldstein JN, Mayer SA, Steiner T, Wang X, Arima H, Hasegawa H, Oishi M, Godoy DA, Masotti L, Dowlatshahi D, Rodriguez-Luna D, Molina CA, Jang DK, Davalos A, Castillo J, Yao X, Claassen J, Volbers B, Kazui S, Okada Y, Fujimoto S, Toyoda K, Li Q, Khoury J, Delgado P, Sabín J, Hernández-Guillamon M, Prats-Sánchez L, Cai C, Kate MP, McCourt R, Venkatasubramanian C, Diringer MN, Ikeda Y, Worthmann H, Ziai WC, d’Esterre CD, Aviv RI, Raab P, Murai Y, Zazulia AR, Butcher KS, Seyedsaadat SM, Grotta JC, Martí-Fàbregas J, Montaner J, Broderick J, Yamamoto H, Staykov D, Connolly ES, Selim M, Leira R, Moon BH, Demchuk AM, Di Napoli M, Fujii Y, Anderson CS, Rosand J. Absolute risk and predictors of the growth of acute spontaneous intracerebral haemorrhage: a systematic review and meta-analysis of individual patient data. The Lancet Neurology. 2018;17(10):885–894. doi: 10.1016/S1474-4422(18)30253-9. - DOI - PMC - PubMed
    1. Amoo M, Henry J, Alabi PO, Husien MB. The ‘swirl sign’ as a marker for haematoma expansion and outcome in intra-cranial haemorrhage: a meta-analysis. Journal of Clinical Neuroscience. 2021;87:103–111. doi: 10.1016/j.jocn.2021.02.028. - DOI - PubMed
    1. Anand S, Choudhury SS, Pradhan S, Mulmuley MS. Normotensive state during acute phase of hypertensive intracerebral hemorrhage. Journal of Neurosciences in Rural Practice. 2023;14:465–469. doi: 10.25259/JNRP. - DOI - PMC - PubMed
    1. Barras CD, Tress BM, Christensen S, MacGregor L, Collins M, Desmond PM, Skolnick BE, Mayer SA, Broderick JP, Diringer MN, Steiner T, Davis SM. Density and shape as CT predictors of intracerebral hemorrhage growth. Stroke. 2009;40(4):1325–1331. doi: 10.1161/STROKEAHA.108.536888. - DOI - PubMed

MeSH terms