

Undernutrition as a risk factor for tuberculosis disease
- PMID: 38860538
- PMCID: PMC11165671
- DOI: 10.1002/14651858.CD015890.pub2
Undernutrition as a risk factor for tuberculosis disease
Abstract
Background: Tuberculosis (TB) is a leading cause of mortality due to an infectious disease, with an estimated 1.6 million deaths due to TB in 2022. Approximately 25% of the global population has TB infection, giving rise to 10.6 million episodes of TB disease in 2022. Undernutrition is a key risk factor for TB and was linked to an estimated 2.2 million TB episodes in 2022, as outlined in the World Health Organization (WHO) Global Tuberculosis Report.
Objectives: To determine the prognostic value of undernutrition in the general population of adults, adolescents, and children for predicting tuberculosis disease over any time period.
Search methods: We searched the literature databases MEDLINE (via PubMed) and WHO Global Index Medicus, as well as the WHO International Clinical Trials Registry Platform (ICTRP) on 3 May 2023 (date of last search for all databases). We placed no restrictions on the language of publication.
Selection criteria: We included retrospective and prospective cohort studies, irrespective of publication status or language. The target population comprised adults, adolescents, and children from diverse settings, encompassing outpatient and inpatient cohorts, with varying comorbidities and risk of exposure to tuberculosis.
Data collection and analysis: We used standard Cochrane methodology and the Quality In Prognosis Studies (QUIPS) tool to assess the risk of bias of the studies. Prognostic factors included undernutrition, defined as wasting, stunting, and underweight, with specific measures such as body mass index (BMI) less than two standard deviations below the median for children and adolescents and low BMI scores (< 18.5) for adults and adolescents. Prognostication occurred at enrolment/baseline. The primary outcome was the incidence of TB disease. The secondary outcome was recurrent TB disease. We performed a random-effects meta-analysis for the adjusted hazard ratios (HR), risk ratios (RR), or odds ratios (OR), employing the restricted maximum likelihood estimation. We rated the certainty of the evidence using the GRADE approach.
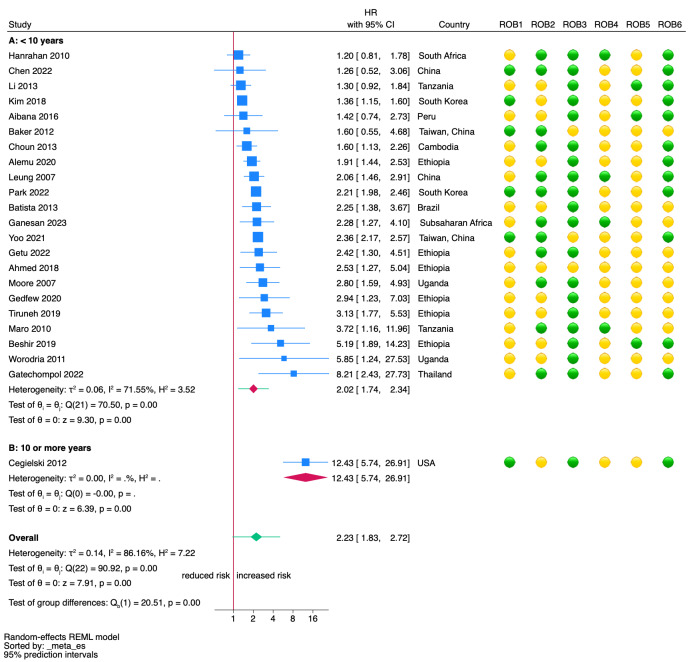
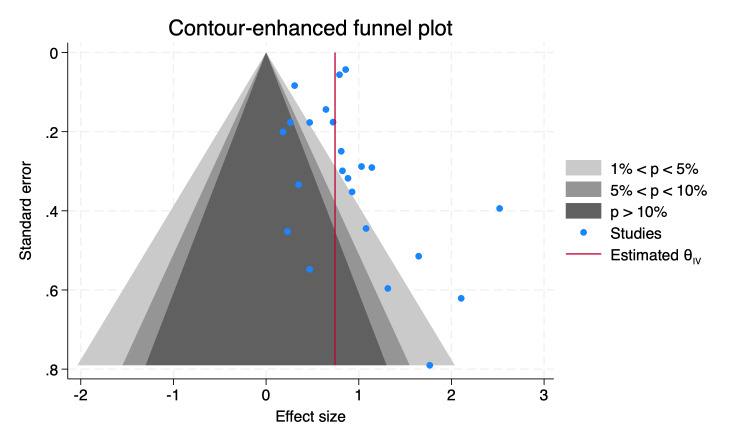
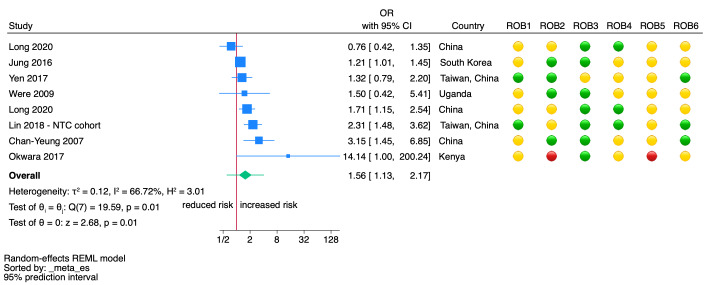
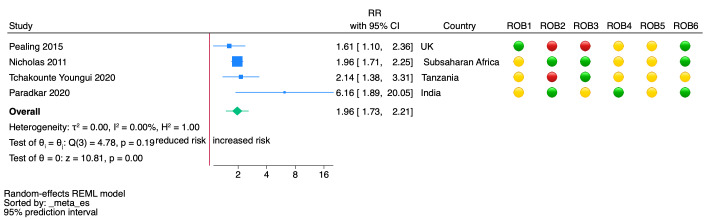
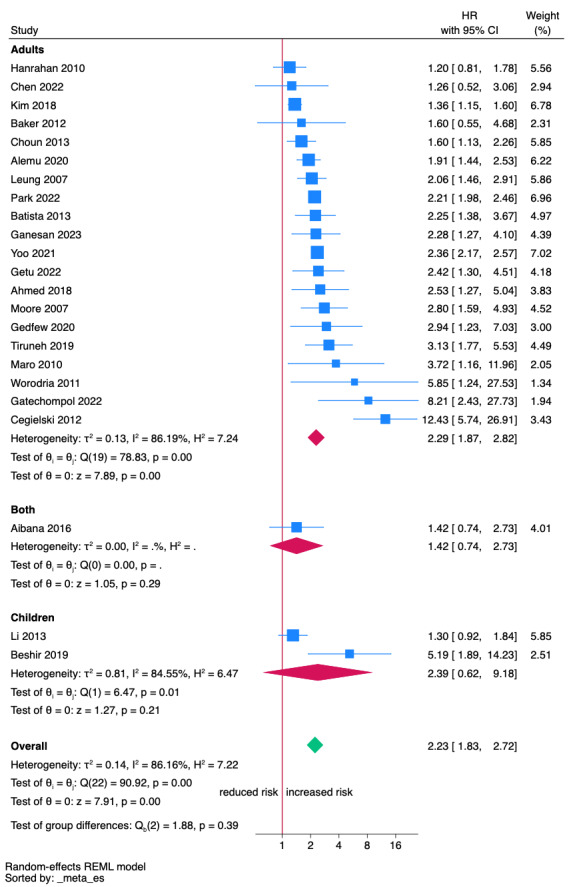
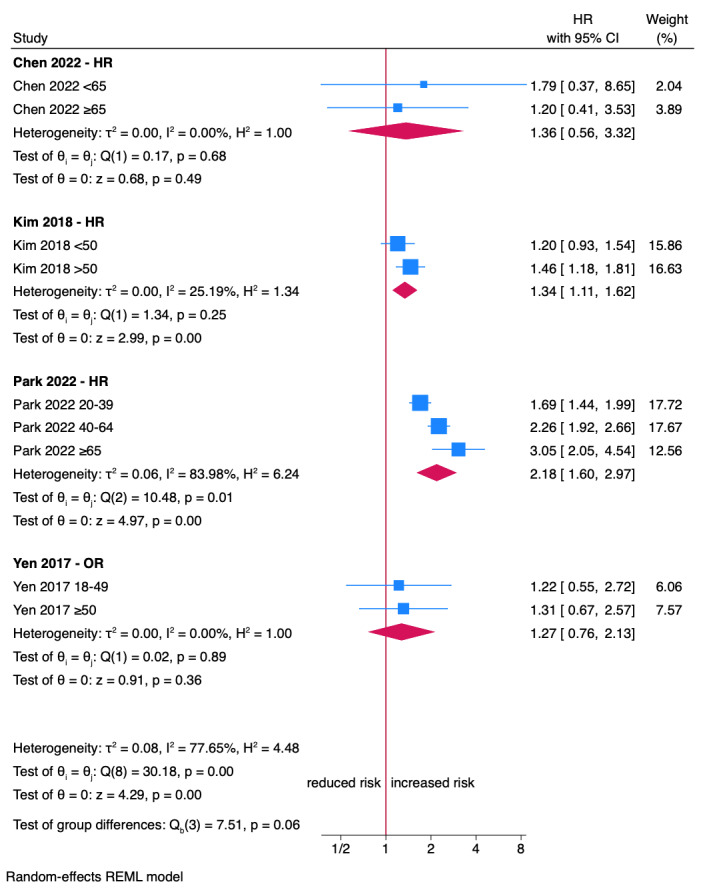
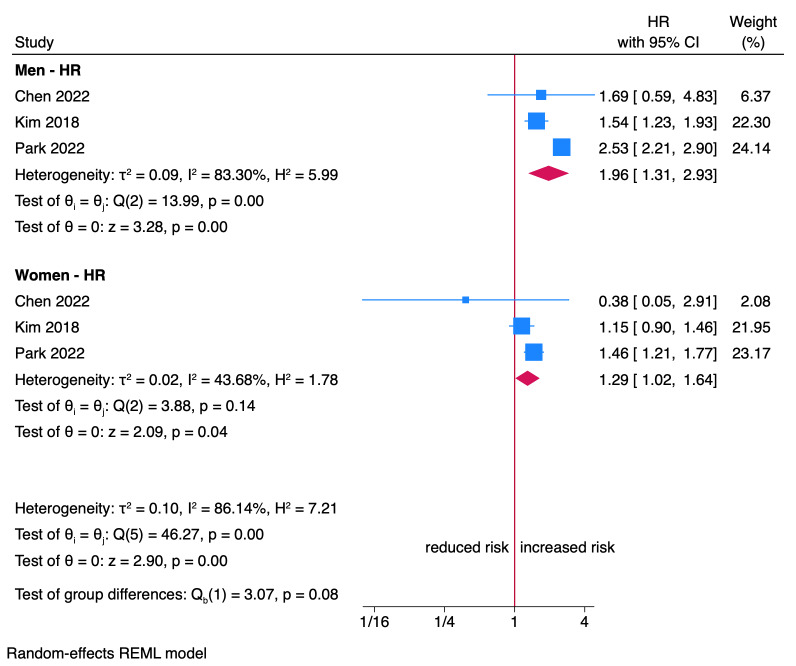
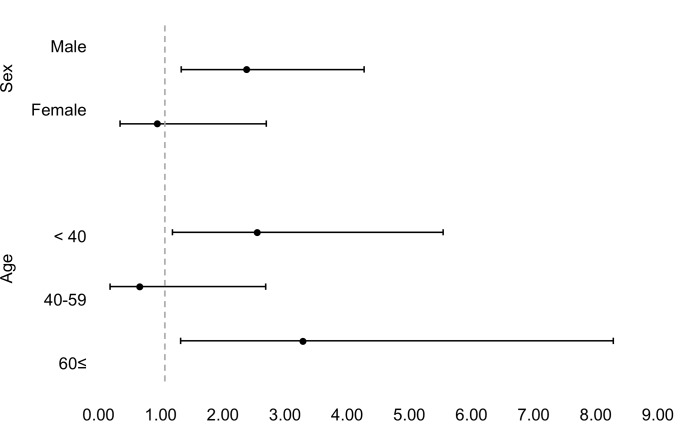
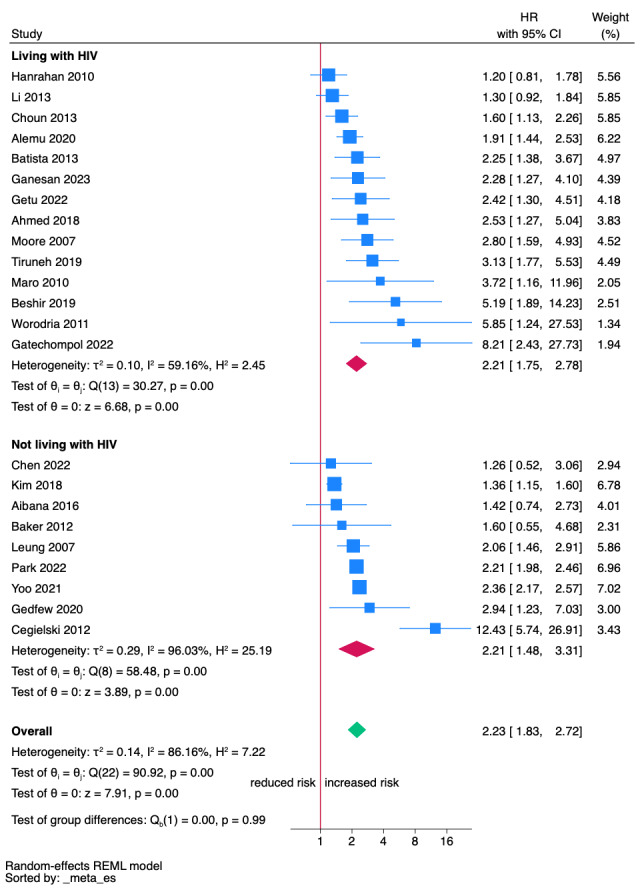
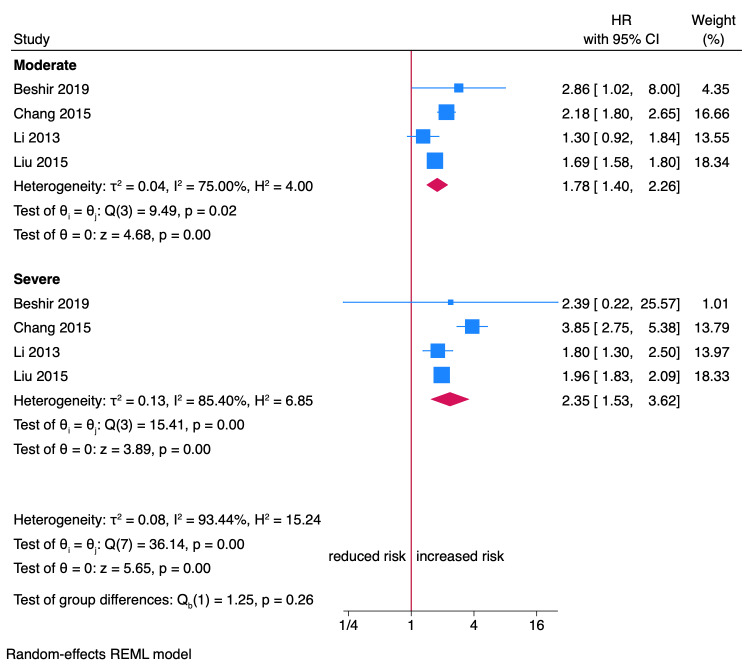
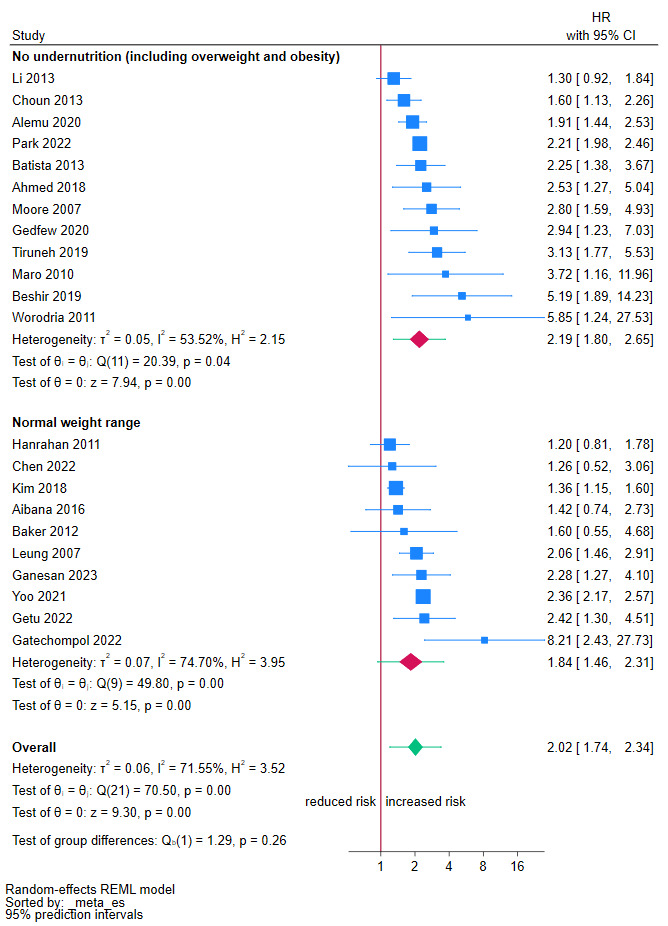
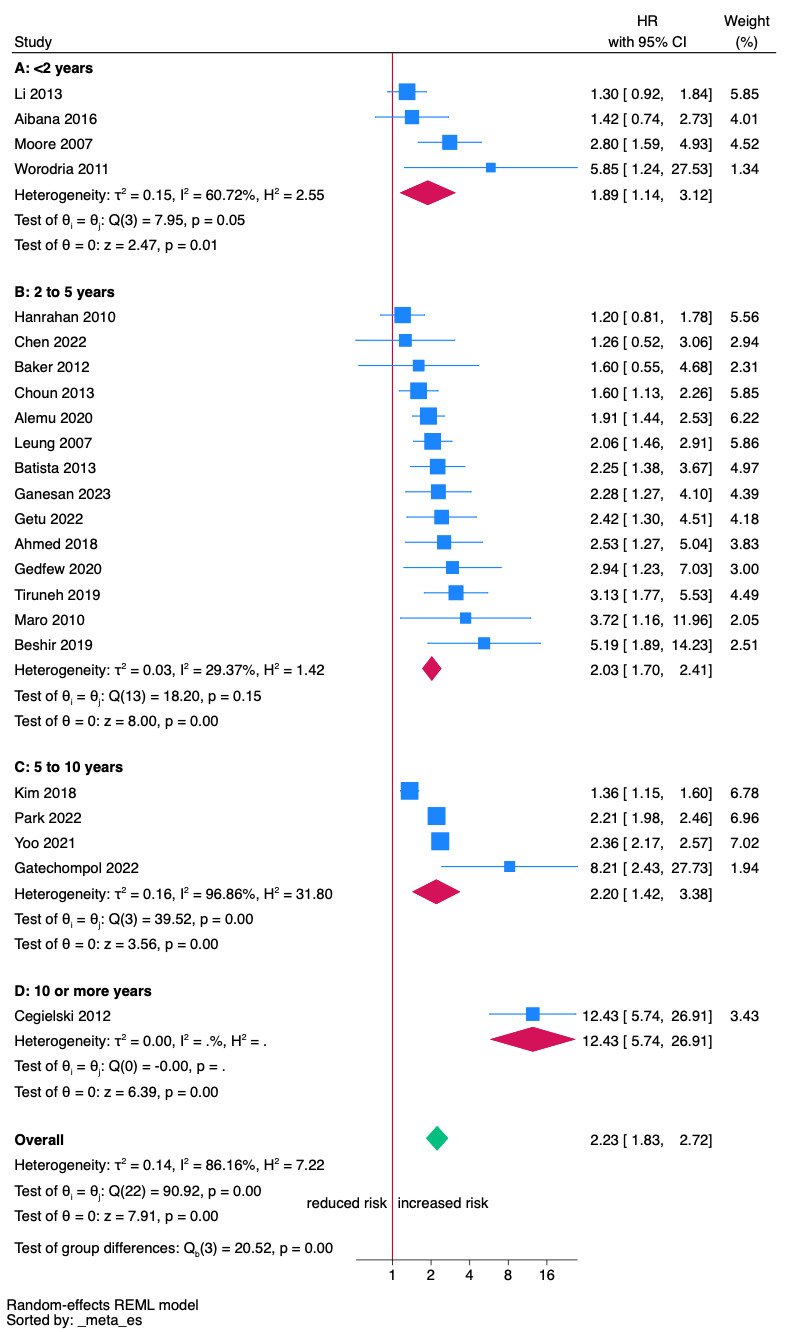
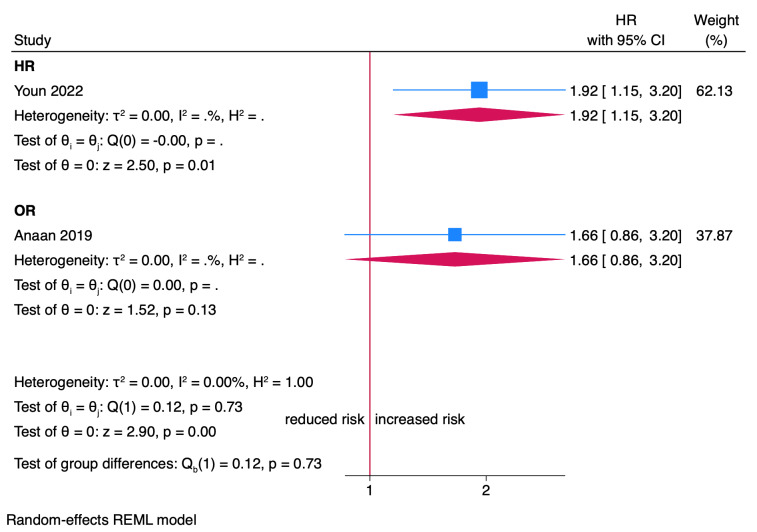
Main results: We included 51 cohort studies with over 27 million participants from the six WHO regions. Sixteen large population-based studies were conducted in China, Singapore, South Korea, and the USA, and 25 studies focused on people living with HIV, which were mainly conducted in the African region. Most studies were in adults, four in children, and three in children and adults. Undernutrition as an exposure was usually defined according to standard criteria; however, the diagnosis of TB did not include a confirmatory culture or molecular diagnosis using a WHO-approved rapid diagnostic test in eight studies. The median follow-up time was 3.5 years, and the studies primarily reported an adjusted hazard ratio from a multivariable Cox-proportional hazard model. Hazard ratios (HR) The HR estimates represent the highest certainty of the evidence, explored through sensitivity analyses and excluding studies at high risk of bias. We present 95% confidence intervals (CI) and prediction intervals, which present between-study heterogeneity represented in a measurement of the variability of effect sizes (i.e. the interval within which the effect size of a new study would fall considering the same population of studies included in the meta-analysis). Undernutrition may increase the risk of TB disease (HR 2.23, 95% CI 1.83 to 2.72; prediction interval 0.98 to 5.05; 23 studies; 2,883,266 participants). The certainty of the evidence is low due to a moderate risk of bias across studies and inconsistency. When stratified by follow-up time, the results are more consistent across < 10 years follow-up (HR 2.02, 95% CI 1.74 to 2.34; prediction interval 1.20 to 3.39; 22 studies; 2,869,077 participants). This results in a moderate certainty of evidence due to a moderate risk of bias across studies. However, at 10 or more years of follow-up, we found only one study with a wider CI and higher HR (HR 12.43, 95% CI 5.74 to 26.91; 14,189 participants). The certainty of the evidence is low due to the moderate risk of bias and indirectness. Odds ratio (OR) Undernutrition may increase the odds of TB disease, but the results are uncertain (OR 1.56, 95% CI 1.13 to 2.17; prediction interval 0.61 to 3.99; 8 studies; 173,497 participants). Stratification by follow-up was not possible as all studies had a follow-up of < 10 years. The certainty of the evidence is very low due to the high risk of bias and inconsistency. Contour-enhanced funnel plots were not reported due to the few studies included. Risk ratio (RR) Undernutrition may increase the risk of TB disease (RR 1.96, 95% CI 1.73 to 2.21; prediction interval 1.50 to 2.56; 4 studies; 1,475,867 participants). Stratification by follow-up was not possible as all studies had a follow-up of < 10 years. The certainty of the evidence is low due to the high risk of bias. Contour-enhanced funnel plots were not reported due to the few studies included.
Authors' conclusions: Undernutrition probably increases the risk of TB two-fold in the short term (< 10 years) and may also increase the risk in the long term (> 10 years). Policies targeted towards the reduction of the burden of undernutrition are not only needed to alleviate human suffering due to undernutrition and its many adverse consequences, but are also an important part of the critical measures for ending the TB epidemic by 2030. Large population-based cohorts, including those derived from high-quality national registries of exposures (undernutrition) and outcomes (TB disease), are needed to provide high-certainty estimates of this risk across different settings and populations, including low and middle-income countries from different WHO regions. Moreover, studies including children and adolescents and state-of-the-art methods for diagnosing TB would provide more up-to-date information relevant to practice and policy.
Funding: World Health Organization (203256442).
Registration: PROSPERO registration: CRD42023408807 Protocol: https://doi.org/10.1002/14651858.CD015890.
Copyright © 2024 The Authors. Cochrane Database of Systematic Reviews published by John Wiley & Sons, Ltd. on behalf of The Cochrane Collaboration.
Conflict of interest statement
Juan Victor Ariel Franco: none known.
Brenda Bongaerts: none known.
Maria‐Inti Metzendorf: none known.
Agostina Risso: none known.
Yang Guo: none known.
Laura Peña Silva: none known.
Melanie Boeckmann: none known.
Sabrina Schlesinger: Novo Nordisk (Independent Contractor), Alpro Foundation (Grant/Contract).
Johanna AAG Damen: Universitair Medisch Centrum Utrecht (Employment).
Bernd Richter: consultant for the World Health Organization.
Anna Carlqvist: consultant for the World Health Organization.
Mathieu Bastard: employee of the World Health Organization.
Maria Nieves Garcia‐Casal: employee of the World Health Organization.
Bianca Hemmingsen: employee of the World Health Organization.
Farai Mavhunga: employee of the World Health Organization.
Jennifer Manne‐Goehler: consultant for the World Health Organization and National Institutes of Health (Grant/Contract).
Kerri Viney: employee of the World Health Organization.
Annabel Baddeley: employee of the World Health Organization.
Juan Victor Ariel Franco, Maria‐Inti Metzendorf, Brenda Bongaerts, and Bernd Richter are editors for Cochrane Metabolic and Endocrine Disorders, but they were excluded from the editorial processing of this review. The authors alone are responsible for the views expressed in this article and they do not necessarily represent the views, decisions or policies of the institutions with which they are affiliated.
Figures
Update of
References
-
- World Health Organization. Global Tuberculosis Report 2023. https://www.who.int/teams/global-tuberculosis-programme/tb-reports/globa... (accessed 8 December 2023).
-
- CDC. Core Curriculum on Tuberculosis: What the clinician should know. https://www.cdc.gov/tb/education/corecurr/index.htm (accessed 21 April 2023).
-
- Brett K, Dulong C, Severn M. Prevention of Tuberculosis: A Review of Guidelines [Internet]. Ottawa (ON): Canadian Agency for Drugs and Technologies in Health 2020. pubmed.ncbi.nlm.nih.gov/33048484/. [PMID: ] - PubMed
-
- World Health Organization. Tuberculosis and vulnerable populations. https://www.who.int/europe/news-room/fact-sheets/item/tuberculosis-and-v... (accessed 7 July 2023).
Publication types
MeSH terms
Grants and funding
LinkOut - more resources
Full Text Sources
Medical