. 2024 Aug 1;327(2):L232-L249.
doi: 10.1152/ajplung.00324.2023. Epub 2024 Jun 11.

Activation of alveolar epithelial ER stress by β-coronavirus infection disrupts surfactant homeostasis in mice: implications for COVID-19 respiratory failure

Affiliations

Activation of alveolar epithelial ER stress by β-coronavirus infection disrupts surfactant homeostasis in mice: implications for COVID-19 respiratory failure

Aditi Murthy et al. Am J Physiol Lung Cell Mol Physiol. .

Abstract

COVID-19 syndrome is characterized by acute lung injury, hypoxemic respiratory failure, and high mortality. Alveolar type 2 (AT2) cells are essential for gas exchange, repair, and regeneration of distal lung epithelium. We have shown that the causative agent, severe acute respiratory syndrome coronavirus 2 (SARS-CoV-2), and other members of the β-coronavirus genus induce an endoplasmic reticulum (ER) stress response in vitro; however, the consequences for host AT2 cell function in vivo are less understood. To study this, two murine models of coronavirus infection were used-mouse hepatitis virus-1 (MHV-1) in A/J mice and a mouse-adapted SARS-CoV-2 strain. MHV-1-infected mice exhibited dose-dependent weight loss with histological evidence of distal lung injury accompanied by elevated bronchoalveolar lavage fluid (BALF) cell counts and total protein. AT2 cells showed evidence of both viral infection and increased BIP/GRP78 expression, consistent with activation of the unfolded protein response (UPR). The AT2 UPR included increased inositol-requiring enzyme 1α (IRE1α) signaling and a biphasic response in PKR-like ER kinase (PERK) signaling accompanied by marked reductions in AT2 and BALF surfactant protein (SP-B and SP-C) content, increases in surfactant surface tension, and emergence of a reprogrammed epithelial cell population (Krt8+ and Cldn4+). The loss of a homeostatic AT2 cell state was attenuated by treatment with the IRE1α inhibitor OPK-711. As a proof-of-concept, C57BL6 mice infected with mouse-adapted SARS-CoV-2 demonstrated similar lung injury and evidence of disrupted surfactant homeostasis. We conclude that lung injury from β-coronavirus infection results from an aberrant host response, activating multiple AT2 UPR stress pathways, altering surfactant metabolism/function, and changing AT2 cell state, offering a mechanistic link between SARS-CoV-2 infection, AT2 cell biology, and acute respiratory failure.NEW & NOTEWORTHY COVID-19 syndrome is characterized by hypoxemic respiratory failure and high mortality. In this report, we use two murine models to show that β-coronavirus infection produces acute lung injury, which results from an aberrant host response, activating multiple epithelial endoplasmic reticular stress pathways, disrupting pulmonary surfactant metabolism and function, and forcing emergence of an aberrant epithelial transition state. Our results offer a mechanistic link between SARS-CoV-2 infection, AT2 cell biology, and respiratory failure.

Keywords: SARS-CoV-2; alveolar type 2 cell; mouse hepatitis virus-1 (MHV-1); pulmonary surfactant; transitional epithelial cell state.


Conflict of interest statement

No conflicts of interest, financial or otherwise, are declared by the authors.

Figures

None
Graphical abstract
Figure 1.
Figure 1.
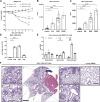
MHV-1 β-coronavirus induces lung injury and inflammation. A/J mice (6–8 wk old) were infected with 50 µL of MHV-1 virus at the doses indicated by intratracheal delivery. A: body weight loss recorded daily starting at 24 h after infection and expressed as % of starting (day 0) weight; ****P < 0.0001 at day 7 vs. sham control by two-way ANOVA. B and C: dose-dependent response to MHV-1 infection in mice at 8 days after inoculation (at indicated dosage expressed as PFU) determined as total cell counts (B) and total protein (C) in BALF measured as described; data are expressed as means ± SE; n = 8 (500 PFU), n = 39 (5,000 PFU), n = 6 (25,000 PFU), n = 21 (sham control); *P < 0.05, ***P < 0.0005, ****P < 0.0001 vs. sham control by one-way ANOVA. D: time-dependent viral protein load within lungs inoculated with 5,000 PFU of MHV-1 determined as Nsp15 expression using qRT-PCR as described; data are expressed as means ± SE; n = 3/time point; *P < 0.05, **P < 0.005 vs. sham control at indicated time points as marked by one-way ANOVA. E: frequencies of macrophage, monocyte, and neutrophils in lung tissue homogenates from control or 4 and 8 days postinfection (dpi) with 5,000 PFU MHV-1; data are expressed as means ± SE; n = 3/condition; *P < 0.05, **P < 0.005 vs. sham control at indicated time point using (n = 4/time point) one-way ANOVA as marked. F: representative H&E staining of formalin-fixed, paraffin-embedded tissue harvested at 8 days after inoculation with 5,000 PFU MHV-1 (a) or DMEM Control (b) showing presence of lung injury marked by inflammatory cellular infiltrates in distal airspaces. Bar: a = 2 mm; b = 200.5 µm. Insets 14 depicting magnified views of rectangular regions marked as indicated. Bar (14) = 501 µm each. H&E, hematoxylin and eosin; MHV-1, mouse hepatitis virus-1; PFU, plaque-forming units.
Figure 2.
Figure 2.
MHV-1 virus infection in vivo induces defects in lung aggregate (LA) surfactant composition and function. A and B: schematic for generation of MHV-1-infected mice and subsequent LA surfactant preparation from harvested BALF as described in materials and methods. C: total phospholipid content of LA surfactant measured as described (data expressed as nmoles lipid/mouse); *P < 0.05, **P < 0.005, vs. control as indicated using one-way ANOVA. D: surface tension of LA surfactant fractions recovered from control (uninfected) and MHV-1-infected mice (4 and 8 dpi) measured in a CDS assayed at a concentration of 0.1 µg/µL and cycled 25 times as published (47) and described in materials and methods. Values obtained after each cycle were plotted as means ± SE, n = 10 mice/condition and comparisons of STmin between groups made at cycle 24 using one-way ANOVA, *P < 0.05. E (top): representative Western blots of LA surfactant fractions for SP-A, SP-B, SP-C, and SP-D proteins from control and mice infected with 5,000 PFU of MHV-1 virus harvested at 8 dpi. Each lane contained 1 µg total protein with equal protein loading confirmed after transfer using LI-COR protein stain and samples immunoblotted as described in materials and methods; bottom: densitometric quantitation of each surfactant protein band is expressed as fold change vs. control (n = 5–8 mice in each group). P values as indicated (*P < 0.05; **P < 0.005; ***P < 0.0005) between groups as marked. BALF, bronchoalveolar lavage fluid; CDS, constrained drop surfactometer; dpi, days post infection; MHV-1, mouse hepatitis virus-1; PFU, plaque-forming units; SP, surfactant protein; STmin, minimum surface tension. [Image was created with a licensed version of BioRender.com.]
Figure 3.
Figure 3.
MHV-1 induces loss of alveolar type 2 (AT2) cell-specific markers. AT2 cells isolated from lungs of control (DMEM inoculated) and MHV-1-infected (5,000 PFU) mice at 4 dpi and 8 dpi were used to prepare cell lysates and total mRNA as described in materials and methods. A (left): representative Western blots for SP-B, SP-C, and β-actin; right: densitometric scanning of identified bands from multiple blots normalized to β-actin. Data are expressed as fold change vs. control; *P < 0.05 vs. control as marked by 1-way ANOVA, n = 4–9/condition. B: qRT-PCR analysis of total AT2 mRNA for AT2 markers—Abca3, Sftpb, and Sftpc each normalized to 18 s rRNA. Data are expressed as fold change compared with sham-inoculated (DMEM) control mice; n = 4–7 mice in each group. *P < 0.05; **P < 0.005; and ****P < 0.0001 vs. control as marked, determined using one-way ANOVA. dpi, days post infection; MHV-1, mouse hepatitis virus-1; SP, surfactant protein.
Figure 4.
Figure 4.
Emergence of a reprogrammed epithelial cell population in MHV-1-infected mice. A: representative lung section obtained from MHV-1-infected mouse at 8 dpi with immunofluorescence staining for proSP-C+ AT2 cells (a; green) and reprogrammed Krt8+ (b; red) epithelial cells. Nuclei were identified in the same section with DAPI (c; blue). Merged image (d) with unaffected (yellow box) and damaged (blue box) regions marked. Inset 1 magnified showing Krt8+ or Krt8+AT2 cells (white arrows) and inset 2 magnified showing “undamaged” areas with mainly Krt8/SP-C+ AT2 cells (yellow arrows). Bar: 100 µm. B: gating strategy and flow cytometric quantitation of CD45CD31Epcam + CD104MHCIIHi CD51+ transitional epithelial cells identified in control (sham-inoculated and MHV-1-infected mice at 4 and 8 dpi); **P < 0.005, ***P < 0.0005 vs. control as marked, determined using 1-way ANOVA. C: expression of viral transcripts in control (Sham) AT2, MHV-1-infected AT2 (4 dpi), and MHV-1-infected transitional cell populations (4 dpi) isolated by FACS as described in materials and methods as labeled; *P < 0.05 and **P < 0.005 between groups as marked, determined using 2-way ANOVA. D: heat map of select differential-expressed genes from bulk RNA-Seq analysis of FACS-purified CD51+ transitional AT2 and CD51 AT2 cells sorted from MHV-1-infected mice at 4 dpi and compared with AT2 isolated from control (sham-inoculated) mouse lungs (n = 3 or 4 mice/group as indicated). Expression of mRNA markers of AT2 cells (Sftpc, Sftpb, and Abca3) and reprogrammed transitional epithelial cells (Cldn4, FN1, and Krt8) in each population is labeled using select differentially expressed markers [FC > 1.5; false discovery rate (FDR) <0.05]. E (top): representative Picrosirius red staining of fixed lung sections prepared at 14 dpi from control (sham) and MHV-1-infected mice; bottom: quantification was performed using ImageJ from sections from control (sham) and MHV-1-infected mice prepared at 8and 14 dpi (n = 3–7 mice/group); *P < 0.05 between groups as marked, determined using 1-way ANOVA. F (ac; left): representative sections from 3 separate lobes from an MHV-1-infected mouse harvested at 14 dpi and stained with PSR. Bar = 100 µm; PSR+ areas were identified in 3 separate lobes (ac), and in serial sections of corresponding lung samples, immunofluorescence was performed (13; blue box). Magnified insets 13 for sections a–c, respectively, showing nuclei identified by costaining with DAPI (middle; blue) and reprogrammed Krt8+ (right; white) epithelial cells identified within the same PSR-rich and highly cellular regions (as DAPI) in 14 dpi mouse lungs. Bar = 100 µm. AT2, alveolar type 2; dpi, days post infection; FC, fold change; MHV-1, mouse hepatitis virus-1; PSR, Picrosirius red; SP, surfactant protein.
Figure 5.
Figure 5.
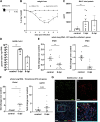
β-coronavirus induces activation of UPR (ER stress) pathways in AT2 cells. Temporal analysis of UPR pathways and apoptosis markers was performed using cell lysates and mRNA prepared from bulk AT2 cells isolated from lungs of control and MHV-1-infected (4 or 8 dpi) mice. A (left): representative Western blot images for GRP78/BIP, p-EIF2α, t-EIF2 α, and GAPDH; right: densitometric quantitation of identified bands from multiple blots was performed as in Fig. 3A, and all data are expressed as fold change from control. For GRP78, GAPDH served as a loading control. p-EIF2α signals were normalized to total t-Eif2 α; *P < 0.05 and **P < 0.005 between groups as marked by 1-way ANOVA. n = 4–7 mice/group as indicated. B: qRT-PCR of total AT2 mRNA was performed with primers for Hsp5a (BIP/Grp78) for downstream pEIF2 α pathway targets Atf4, Gadd34, and Dditt (CHOP) and for the IRE1α target sXBP-1 (sXBP-1). Data were normalized to 18 s RNA and expressed as fold change vs. sham-infected (control) mice. n = 4–7 mice/group as indicated. *P < 0.05; **P < 0.005; ****P < 0.0001 for comparisons performed between groups as marked by 1-way ANOVA. C: densitometric quantitation for apoptosis marker caspase 3 data expressed as fold change from control and normalized to β-actin; *P < 0.05 between groups as marked by 1-way ANOVA, n = 3 or 4 mice/group as indicated. AT2, alveolar type 2; dpi, days post infection; ER, endoplasmic reticulum; MHV-1, mouse hepatitis virus-1; UPR, unfolded protein response; SP, surfactant protein.
Figure 6.
Figure 6.
IRE1α inhibition attenuates a viral-induced loss of function AT2 phenotype in MHV-1-infected mice. A: schematic of protocol for treatment of MHV-1-infected mice with OPK-711 (20 mg/kg) or vehicle-administered via oral gavage beginning at 1 dpi. B: qPCR analysis of bulk AT2 cells isolated from 8 dpi MHV-1-infected lungs for sXBP1, demonstrating target engagement by OPK-711. Data are expressed as fold change over vehicle-treated mice; **P < 0.005 by unpaired t test (n = 7–9/group). C: Kaplan–Meier survival of MHV-1-infected mice treated with OPK-711 (n = 15) or vehicle (n = 15) at 1 dpi. Death was defined as spontaneous death or loss of >77% of initial body weight. P = 0.08 using log-rank (Mantel–Cox) test. D and E: BALF total cell counts and total protein measured as described in materials and methods in OPK-711-treated MHV-1 mice were compared with vehicle-treated and untreated MHV-1-infected mice at 8 dpi. *P < 0.05 as marked by 1-way ANOVA. F and G: purified AT2 cells isolated from vehicle or OPK-711-treated MHV-1 mouse lungs at 7 dpi were used to prepare cell lysates and total mRNA. F: Western blotting of AT2 lysates for SP-B, and densitometric analysis of visualized bands was performed and normalized to β-actin as a loading control. Data are expressed as fold change over vehicle-treated mice; *P < 0.05 by unpaired t test (n = 4–7/group). G: qRT-PCR was performed for Sftpc, normalized to 18 s mRNA, and data are expressed as fold change over vehicle;*P < 0.05 by 1-way ANOVA (n = 3–7/group). H: MLE-12 cells infected with MHV-1 virus at MOI of 0.5 or mock infected with DMEM were treated with OPK-711 (200 nM) or vehicle. mRNA was prepared from cells harvested at 48 h and qPCR performed for MHV-1 Nsp15. Data are expressed as fold change over uninfected control mice, ***P < 0.001 by 1-way ANOVA (n = 3 per group). AT2, alveolar type 2; BALF, bronchoalveolar lavage fluid; dpi, days post infection; IRE1α, inositol-requiring enzyme 1α; SP, surfactant protein; MOI, multiplicity of infection.
Figure 7.
Figure 7.
Mouse-adapted SARS-CoV-2 infection induces lung injury and disruption of surfactant. A: C76BL6 mice were infected with 1,500 PFU mouse adapted strain of SARS-CoV-2 MA30 virus by intranasal delivery and taken down at 3 and 8 dpi. B: body weights recorded daily, and data are expressed as % day 0 weight ± SE (*P < 0.05, **P < 0.005, ***P < 0.001, and ****P < 0.0001) between groups on different days post infection determined using 2-way ANOVA. C: total protein content of BALF collected at 3 dpi and 8 dpi; **P < 0.005 between groups as marked, determined by 1-way ANOVA. D: viral load within lung measured by qPCR for viral genome; **P < 0.005 vs. control as marked using one-way ANOVA. E and F: qPCR analysis of whole lung for AT2 genes, Sftpb and Sftpc, and reprogrammed epithelial cells transcripts, Cldn4 and Gdf15; *P < 0.05, **P < 0.005, and ****P < 0.0001 for comparisons between groups as marked, assessed using unpaired t test. G: representative immunofluorescence microscopy of lung sections prepared from 8 dpi SARS-CoV-2-infected mice stained for SP-C (AT2 cells) (a; green) and Krt8 (transitional epithelial cells) (b; red). Merged image at lower left showing costaining with DAPI to identify nuclei (blue). Image at lower right represents magnified inset from blue box (inset left), demarcating a region of severe damage showing Krt8+ and DAPI cells. Bar = 100 µm. AT2, alveolar type 2; BALF, bronchoalveolar lavage fluid; dpi, days post infection; SP, surfactant protein.

Similar articles

  • The IRE1α-XBP1 arm of the unfolded protein response is a host factor activated in SARS-CoV-2 infection.
    Fernández JJ, Marín A, Rosales R, Penrice-Randal R, Mlcochova P, Alvarez Y, Villalón-Letelier F, Yildiz S, Pérez E, Rathnasinghe R, Cupic A, Kehrer T, Uccellini MB, Alonso S, Martínez F, McGovern BL, Clark JJ, Sharma P, Bayón Y, Alonso A, Albrecht RA, White KM, Schotsaert M, Miorin L, Stewart JP, Hiscox JA, Gupta RK, Irigoyen N, García-Sastre A, Crespo MS, Fernández N. Fernández JJ, et al. Biochim Biophys Acta Mol Basis Dis. 2024 Jun;1870(5):167193. doi: 10.1016/j.bbadis.2024.167193. Epub 2024 Apr 20. Biochim Biophys Acta Mol Basis Dis. 2024. PMID: 38648902 Free PMC article.
  • Effects of immunoproteasome inhibition on acute respiratory infection with murine hepatitis virus strain 1.
    Steigmann JC, Zhou X, Suttenberg LN, Salman I, Rehmathullah ZF, Weinberg JB. Steigmann JC, et al. J Virol. 2024 Dec 17;98(12):e0123824. doi: 10.1128/jvi.01238-24. Epub 2024 Nov 7. J Virol. 2024. PMID: 39508578 Free PMC article.
  • SARS-CoV-2 ORF3a induces COVID-19-associated kidney injury through HMGB1-mediated cytokine production.
    Zhang C, Gerzanich V, Cruz-Cosme R, Zhang J, Tsymbalyuk O, Tosun C, Sallapalli BT, Liu D, Keledjian K, Papadimitriou JC, Drachenberg CB, Nasr M, Zhang Y, Tang Q, Simard JM, Zhao RY. Zhang C, et al. mBio. 2024 Nov 13;15(11):e0230824. doi: 10.1128/mbio.02308-24. Epub 2024 Sep 30. mBio. 2024. PMID: 39345136 Free PMC article.
  • Antibody tests for identification of current and past infection with SARS-CoV-2.
    Fox T, Geppert J, Dinnes J, Scandrett K, Bigio J, Sulis G, Hettiarachchi D, Mathangasinghe Y, Weeratunga P, Wickramasinghe D, Bergman H, Buckley BS, Probyn K, Sguassero Y, Davenport C, Cunningham J, Dittrich S, Emperador D, Hooft L, Leeflang MM, McInnes MD, Spijker R, Struyf T, Van den Bruel A, Verbakel JY, Takwoingi Y, Taylor-Phillips S, Deeks JJ; Cochrane COVID-19 Diagnostic Test Accuracy Group. Fox T, et al. Cochrane Database Syst Rev. 2022 Nov 17;11(11):CD013652. doi: 10.1002/14651858.CD013652.pub2. Cochrane Database Syst Rev. 2022. PMID: 36394900 Free PMC article.
  • Physical interventions to interrupt or reduce the spread of respiratory viruses.
    Jefferson T, Dooley L, Ferroni E, Al-Ansary LA, van Driel ML, Bawazeer GA, Jones MA, Hoffmann TC, Clark J, Beller EM, Glasziou PP, Conly JM. Jefferson T, et al. Cochrane Database Syst Rev. 2023 Jan 30;1(1):CD006207. doi: 10.1002/14651858.CD006207.pub6. Cochrane Database Syst Rev. 2023. PMID: 36715243 Free PMC article.

Cited by

References

    1. Budinger GRS, Misharin AV, Ridge KM, Singer BD, Wunderink RG. Distinctive features of severe SARS-CoV-2 pneumonia. J Clin Invest 131: e149412, 2021. doi: 10.1172/JCI149412. - DOI - PMC - PubMed
    1. Wang Y, Perlman S. COVID-19: inflammatory profile. Annu Rev Med 73: 65–80, 2022. doi: 10.1146/annurev-med-042220-012417. - DOI - PubMed
    1. Gong HH, Worley MJ, Carver KA, Goldstein DR, Deng JC. Neutrophils drive pulmonary vascular leakage in MHV-1 infection of susceptible A/J mice. Front Immunol 13: 1089064, 2023. doi: 10.3389/fimmu.2022.1089064. - DOI - PMC - PubMed
    1. Katzen J, Beers MF. Contributions of alveolar epithelial cell quality control to pulmonary fibrosis. J Clin Invest 130: 5088–5099, 2020. doi: 10.1172/JCI139519. - DOI - PMC - PubMed
    1. Mulugeta S, Nureki S, Beers MF. Lost after translation: insights from pulmonary surfactant for understanding the role of alveolar epithelial dysfunction and cellular quality control in fibrotic lung disease. Am J Physiol Lung Cell Mol Physiol 309: L507–L525, 2015. doi: 10.1152/ajplung.00139.2015. - DOI - PMC - PubMed

MeSH terms