. 2024 Aug 5;221(8):e20232091.
doi: 10.1084/jem.20232091. Epub 2024 Jun 11.

A human STAT3 gain-of-function variant drives local Th17 dysregulation and skin inflammation in mice

Affiliations

A human STAT3 gain-of-function variant drives local Th17 dysregulation and skin inflammation in mice

Kelsey A Toth et al. J Exp Med. .

Abstract

Germline gain-of-function (GOF) variants in STAT3 cause an inborn error of immunity associated with early-onset poly-autoimmunity and immune dysregulation. To study tissue-specific immune dysregulation, we used a mouse model carrying a missense variant (p.G421R) that causes human disease. We observed spontaneous and imiquimod (IMQ)-induced skin inflammation associated with cell-intrinsic local Th17 responses in STAT3 GOF mice. CD4+ T cells were sufficient to drive skin inflammation and showed increased Il22 expression in expanded clones. Certain aspects of disease, including increased epidermal thickness, also required the presence of STAT3 GOF in epithelial cells. Treatment with a JAK inhibitor improved skin disease without affecting local Th17 recruitment and cytokine production. These findings collectively support the involvement of Th17 responses in the development of organ-specific immune dysregulation in STAT3 GOF and suggest that the presence of STAT3 GOF in tissues is important for disease and can be targeted with JAK inhibition.


Conflict of interest statement

Disclosures: B.S. Kim is founder of Klirna Biotech; he has served as a consultant for 23andMe, ABRAX Japan, AbbVie, Almirall, Amagma Therapeutics, Amgen, Arcutis Biotherapeutics, Arena Pharmaceuticals, argenx, AstraZeneca, Boehringer Ingelheim, Bristol Myers Squibb, Cara Therapeutics, Clexio Biosciences, Eli Lilly and Company, Escient Pharmaceuticals, Evommune, Galderma, Genentech, GlaxoSmithKline, Granular Therapeutics, Incyte Corporation, Innovaderm Research, Janssen, Kiniksa, LEO Pharma, Maruho, Novartis, Pfizer, Recens Medical, Regeneron Pharmaceuticals, Sanofi, Septerna, Vial, WebMD; he has stock in ABRAX Japan, KliRNA Biotech, Locus Biosciences, and Recens Medical; he holds a patent for the use of JAK1 inhibitors for chronic pruritus; he has a patent pending for the use of JAK inhibitors for interstitial cystitis. He has research grants from AbbVie, Cara Therapeutics, LEO Pharma, and Veradermics. No other disclosures were reported.

Figures

None
Graphical abstract
Figure 1.
Figure 1.
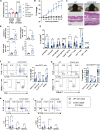
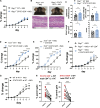
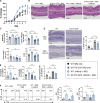
Older adult STAT3 GOF (p.G421R) mice develop spontaneous skin inflammation. (A) Ear thickness of young adult and older adult mice. w, week. (B) Percent change in ear thickness of older adult mice relative to baseline at 13 wk. (C) Representative pictures of older adult mice and H&E ear sections. (D) Histological measurements of ears. (E) Quantification of skin immune cell frequencies by flow cytometry, including dendritic epidermal T cells (DETCs). (F and G) (F) Representative flow plots and quantification of IL-17A+, RORγt+, and IL-22+ skin CD4+ and (G) skin γδ T cells. Cytokines were assessed after PMA/ionomycin stimulation. (H and I) (H) Representative flow plot and quantification of IL-17A+ and IL-22+ CD4+ T cells in CLN and (I) spleen T cells after PMA/ionomycin stimulation. Bars: mean ± SEM. Statistical significance determined by unpaired two-tailed or Welch’s t test (A and D–I), or two-way repeated measures ANOVA with Šídák’s multiple comparisons test (B), *P < 0.05, **P < 0.01, ***P < 0.001, ****P < 0.0001. Data are representative of >3 experiments with 4–16 mice/group.
Figure S1.
Figure S1.
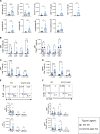
Older adult STAT3 GOF (Stat3 p.G421R/+ ) mice develop spontaneous skin inflammation, related to Fig. 1 . (A) Absolute cell numbers of cells per ear and of skin immune cells of older adult WT and STAT3 GOF mice. (B) Absolute cell numbers of CD45.2+ CD3+ TCRγδ CD8 CD4+ (left) and CD45.2+ CD3+ TCRγδmid (right) T cells expressing RORγt, IL-17A, and/or IL-22 in the skin. (C and D) Absolute cell numbers of CD45.2+ CD3+ TCRγδ CD8 CD4+ T cells expressing IL-17A and/or IL-22 in the (C) CLN and (D) spleen. (E and F) Representative flow plots, quantification, and absolute cell number of IL-17A, and IL-22 expression in CD45.2+ CD3+ TCRγδ+ T cells in the (E) CLN and (F) spleen. Cytokine expression assessed after PMA/ionomycin stimulation. Bars: mean ± SEM. Statistical significance determined by unpaired two-tailed or Welch’s t test, *P < 0.05, **P < 0.01, ***P < 0.001, ****P < 0.0001. Data represent three experiments with 10–16 mice.
Figure 2.
Figure 2.
Th17 polarization is enhanced in naïve and bulk STAT3 GOF CD4 + T cells. (A) Representative flow plot and quantification of IL-17A following Th17 polarization of naïve CD4+ T cells with varying concentrations of IL-6. (B) Quantification of Th17 polarization of bulk splenic CD4+ T cells with varying concentrations of IL-6. w, week. Bars: mean ± SEM. Statistical significance was determined by two-way ANOVA with Sidak’s multiple comparisons test (A and B), ****P < 0.0001. Data represent two independent experiments with six to seven mice/group.
Figure 3.
Figure 3.
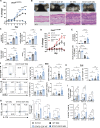
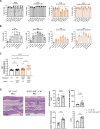
Topical IMQ elicits severe skin inflammation and a Th17 response in young adult STAT3 GOF mice. (A) Adult WT and Stat3 p.G421R/+ littermates were treated with topical 5% IMQ cream on both ears for 7 consecutive days. Percent change in ear thickness of IMQ-treated young adult mice relative to baseline. (B) Representative pictures of NT and IMQ-treated mice and H&E ear sections. (C) Histological measurements of ears. (D) IMQ-treated adult WT and Stat3 p.T716M/+ littermates. Percent change in ear thickness during the course of IMQ treatment relative to baseline. (E) Frequency and quantification of skin immune cells of STAT3 GOF (p.G421R) mice. (F) Analysis of immune cell populations from the skin of IMQ-treated adult Il17a-GFP and STAT3 GOF x Il17a-GFP littermates, with representative flow plots gated on CD4+ T cells. Quantification of skin CD4+ T cells that are Il17a-GFP+, RORγt+, or FoxP3+ RORγt. Lower right represents quantification of the percent of CD4+FoxP3+ RORγt+ (parent gate) that are Il17a-GFP+. (G) Representative flow plot and quantification of skin IL-17A+ and IL-22+ CD4+ T cells after PMA/ionomycin. (H) Frequency and total number of CLN Il17a-GFP+ CD4+ T cells. (I) Frequency and total number of CLN IL-17A+ and IL-22+ CD4+ T cells after PMA/ionomycin. (E–I) IL-17 GFP mice treated with IMQ. Bars: mean ± SEM. Statistical significance determined by two-way repeated measures ANOVA with Šídák’s multiple comparisons test (A and D) or one-way ANOVA with Šídák’s multiple comparisons test (C and E–I). *P < 0.05, **P < 0.01, ***P < 0.001, ****P < 0.0001. Data represent three to four experiments with 5–12 mice/group.
Figure S2.
Figure S2.
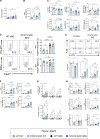
Cell populations in skin and CLN of IMQ-treated young adult WT and STAT3 GOF mice, related to Fig. 3 . (A) Total number of cells per ear. (B) Total number of CLN cells. (C) Frequency and total number of lymphocyte populations in CLN. (D) Representative flow plots and frequency of CD45.2+ CD3+ TCRγδmid Il17a-GFP+ and RORγt+ cells. (E) Representative flow plots and frequency of CD45.2+ CD3+ TCRγδmid IL-17A+ and IL-22+ populations in skin. Cytokine expression assessed after PMA/ionomycin stimulation. (F) Frequency and number of CD45.2+ CD3+ TCRγδ+ Il17a-GFP+ or RORγt+ populations in CLN. (G) Frequency and total number of CD45.2+ CD3+ TCRγδmid IL-17A+ and IL-22+ populations in skin. Cytokine expression assessed after PMA/ionomycin stimulation. (H) Frequency and total number of CD45.2+ CD3+ TCRγδ CD4+ FoxP3+ RORγt, FoxP3+ RORγt+, and total RORγt+ populations in CLN. Bars: mean ± SEM. Statistical significance was determined by one-way ANOVA with Sidak’s multiple comparisons test. *P < 0.05, **P < 0.01, ***P < 0.001, ****P < 0.0001. Data represent three to four experiments with 5–12 mice.
Figure 4.
Figure 4.
CD4 + T cells are sufficient, and γδ T cells and CD8 + T cells are not required to mediate IMQ-induced inflammation in STAT3 GOF mice. (A) Percent change in ear thickness of IMQ-treated Rag1 −/− mice. (B) Representative images of ears and H&E sections of IMQ-treated Rag1 −/− mice. (C) Histological measurements from ears of IMQ-treated Rag1 −/− mice. (D) Percent change in ear thickness of IMQ-treated Tcrd −/− mice. (E) Percent change in ear thickness of IMQ-treated CD8-depleted Tcrd −/− mice. (F) Percent change in ear thickness of IMQ-treated Rag1 −/− mice that received 5 × 10⁶ WT or STAT3 GOF CD4+ T cells. (G) Percent change in ear thickness of IMQ-treated STAT3 GOF → WT BM chimeras. (H) Quantification of donor and recipient-derived CD4+ IL-17A+ and IL-22+ frequencies in IMQ-treated STAT3 GOF → WT skin by flow cytometry. Bars: mean ± SEM. Statistical significance was determined by two-way repeated measures ANOVA with Šídák’s multiple comparisons test (A and D–G) or unpaired two-tailed or Welch’s t test (C and H). *P < 0.05, **P < 0.01, ***P < 0.001, ****P < 0.0001. Data represent three to four experiments with 4–12 mice/group. Percent changes in ear thickness are relative to baseline.
Figure S3.
Figure S3.
CD4 + T cells are sufficient, and γδ T cells and CD8 + T cells are not required to mediate IMQ-induced inflammation in STAT3 GOF mice, related to Fig. 4 . (A) Skin immune cell frequencies of Tcrd −/− mice treated with IMQ. (B) Histological measurements from H&E sections of ear tissue of Tcrd −/− mice treated with IMQ + anti-CD8. (C) Skin immune cell frequencies of Tcrd −/− mice treated with IMQ + anti-CD8. (D) Frequency of CD45.2+ CD3+ TCRγδ CD8 CD4+ T cells expressing IL-17A or IL-22 in Tcrd −/− mice treated with IMQ + anti-CD8. Cytokine expression assessed after PMA/ionomycin stimulation. (E) Quantification of skin immune cell frequencies of Rag1 −/− control or adoptive transfer (CD4+ T cells) recipients treated with IMQ. (F) Quantification of total adoptively transferred CD45.2+ CD4+ T cells and transcription factor/cytokine frequencies of transferred CD4+ T cells found in skin. Bars: mean ± SEM. Statistical significance determined by unpaired two-tailed or Welch’s t test (A–D and F) or one-way ANOVA with Sidak’s multiple comparisons test (E). *P < 0.05, **P < 0.01, ***P < 0.001, ****P < 0.0001. Data represent three experiments with five to seven mice.
Figure S4.
Figure S4.
STAT3 GOF BM can exacerbate inflammation in WT mice, related to Fig. 4 . (A and B) (A) Peripheral blood and (B) skin donor engraftment 12 wk after transplant in NT mice, including Ly6G+ polymorphonuclear neutrophils (PMNs). (C) Ear thickness of untreated BM chimeras 12 wk after transplant. (D) Histological measurements from H&E sections of ear tissue of IMQ-treated WT → WT or STAT3 GOF → WT chimeras. Bars: mean ± SEM. Statistical significance determined by one-way ANOVA with Sidak’s multiple comparisons test (C) or unpaired two-tailed or Welch’s t test (D). *P < 0.05, **P < 0.01, ***P < 0.001, ****P < 0.0001. Data represent four experiments with 8–12 mice per group.
Figure 5.
Figure 5.
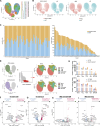
T cell scRNA-seq with and without IMQ treatment. (A and B) (A) UMAP projection of CD3+ T cells from CLN of NT or IMQ-treated mice (n = 2/group) used in CITE-seq experiment showing unique clusters and (B) sample identity by genotype and treatment. (C) Number of cells in each cluster by genotype. (D) Single-positive CD4 T cells separated by Cellselector function, then renormalized and reclustered based on CD44 and CD62L surface expression and canonical gene expression. (E) Frequencies of NT (top) and IMQ (bottom) annotated CD4+ clusters. (F–I) Volcano plots showing differential expression comparing WT and STAT3 GOF (false discovery rate [FDR] < 0.05, average log2 fold change >0.25 or less than −0.25) in cells identified as NT TCM (F), NT Exh, (G), IMQ Eff/TEM (H), and IMQ Treg (I). Ribosomal genes, genes ending in -Rik, and genes beginning with Gm- are not labeled in volcano plots. Data are representative of one experiment with two mice/group.
Figure S5.
Figure S5.
STAT3 GOF T cell scRNA-seq after IMQ treatment, related to Fig. 5 . (A) Cellselector function was used to separate single-positive CD8 T cells, which were renormalized and reclustered based on CD44 and CD62L surface protein expression and canonical gene expression. (B) Frequencies of annotated CD8+ clusters based on genotype and treatment. (C) Clonotype frequency of the NT and IMQ-treated CD8+ T cells by annotated cluster generated with ScRepertoire. (D and E) Volcano plots showing differential expression (adjusted P < 0.05, average log2 fold change >0.25 or less than −0.25) in (D) NT CD8 expanded clones and (E) IMQ CD8 expanded clones, comparing WT and STAT3 GOF. Ribosomal genes, genes ending in -Rik, and genes beginning with Gm- are not labeled on volcano plots. Data are representative of one experiment with two mice/group.
Figure 6.
Figure 6.
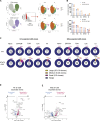
STAT3 GOF CD4 + T cells show increased clonal expansion at baseline and after IMQ. (A) Clonotype frequency of NT and IMQ-treated CD4+ T cells by annotated cluster used in scRNA-seq experiment, generated with ScRepertoire. (B–D) Volcano plot showing differential expression comparing WT and STAT3 GOF (FDR < 0.05, average log2 fold change >0.25 or less than −0.25) in NT CD4+ expanded clones (B), IMQ CD4+ expanded clones (C), and IMQ Treg expanded clones (D). (E–G) Volcano plot showing differential expression comparing WT and STAT3 GOF (FDR < 0.05, average log2 fold change >0.25 or less than −0.25) in IMQ CD4+ single clones (E), IMQ CD4+ Eff/TEM single clones (F), and IMQ CD4+ Treg single clones (G). Ribosomal genes, genes ending in -Rik, and genes beginning with Gm- are not labeled in volcano plots. Data are representative of one experiment with two mice/group.
Figure 7.
Figure 7.
Older adult Il22 −/− STAT3 GOF mice do not develop spontaneous skin inflammation. (A) Percent change in ear thickness of older adult Il22 −/− and Il22 −/− STAT3 GOF mice relative to baseline at 13 wk. (B) Quantification of skin immune cell frequencies by flow cytometry at 23 wk of age. (C) Representative flow plots and quantification of IL-17A+ CD4+ and γδ T cell frequencies and total number in the skin. Cytokines assessed after PMA/ionomycin stimulation. (D) Total cellularity of CLN. w, week. (E) Quantification of IL-17A+ CD4+ and γδ T cell frequencies and total number in the CLN. Cytokines assessed after PMA/ionomycin stimulation. Bars: mean ± SEM. Statistical significance determined by unpaired two-tailed or Welch’s t test (B–E), or two-way repeated measures ANOVA with Šídák’s multiple comparisons test (A), *P < 0.05, **P < 0.01, ****P < 0.0001. Data are representative of one experiment with five to eight mice/group.
Figure 8.
Figure 8.
IL-22 signaling contributes to increased IMQ-induced inflammation in STAT3 GOF. (A) Percent change in ear thickness of Il22 +/+ and Il22 −/− WT and STAT3 GOF mice during IMQ treatment relative to baseline. Day 7 statistics shown (top: Il22 +/+ STAT3 GOF versus Il22 −/− STAT3 GOF; bottom: Il22 −/− WT versus Il22 −/− STAT3 GOF). (B) Representative images of ears and H&E sections of IMQ-treated Il22 −/− mice. (C) Histological measurements from ears. (D) Frequency and quantification of skin immune cells measured by flow cytometry. (E) Representative flow plot and quantification of IL-17A expression and total cell number of skin CD4+ T cells. Cytokines assessed after PMA/ionomycin stimulation. (F) Quantification of IL-17A expression and total cell number of skin γδ T cells. Cytokines assessed after PMA/ionomycin stimulation. (G) Total CLN cell number. (H) Representative flow plot and quantification of IL-17A expression and total cell number of CLN CD4+ T cells measured by flow cytometry. Cytokines assessed after PMA/ionomycin stimulation. (I) Quantification of IL-17A expression and total cell number of CLN γδ T cells measured by flow cytometry. Cytokines assessed after PMA/ionomycin stimulation. (J) Percent change in ear thickness of IL-17A–depleted Il22 −/− WT and STAT3 GOF mice during IMQ treatment relative to baseline. Day 7 statistics shown (Il22 −/− WT + anti-IL-17A versus Il22 −/− STAT3 GOF + anti-IL-17A). Bars: mean ± SEM. Statistical significance was determined by two-way repeated measures ANOVA with Tukey’s multiple comparisons test (A and J) or unpaired two-tailed or Welch’s t test (D–I). *P < 0.05, **P < 0.01, ***P < 0.001. Data are representative of two independent experiments with 6–11 mice/group.
Figure 9.
Figure 9.
JAK inhibition prevents enhanced inflammation in STAT3 GOF caused by IMQ without affecting Th17 cytokine expression. WT and STAT3 GOF littermates received JAKinib (tofacitinib) delivered in chow. IMQ treatment started on the same day. (A) Percent change in ear thickness during IMQ treatment relative to baseline. Day 7 statistics are shown. (B) Representative images of H&E ear sections. (C) Histological measurements from H&E ear sections. (D) Representative images of Ki-67–stained ear sections with quantification. (E) Quantification of skin immune cells measured by flow cytometry. (F) Representative flow plot and quantification of IL-17A and IL-22 expression in skin CD4+ T cells. Cytokines assessed after PMA/ionomycin stimulation. Bars: mean ± SEM. Statistical significance determined by two-way repeated measures ANOVA with Šídák’s multiple comparisons test (A) or one-way ANOVA with Šídák’s multiple comparisons test (B–F). *P < 0.05, **P < 0.01, ***P < 0.001, ****P < 0.0001. Data are representative of two experiments with three to six mice/group.

References

    1. Al-Ismaeel, Q. , Neal C.P., Al-Mahmoodi H., Almutairi Z., Al-Shamarti I., Straatman K., Jaunbocus N., Irvine A., Issa E., Moreman C., et al. . 2019. ZEB1 and IL-6/11-STAT3 signalling cooperate to define invasive potential of pancreatic cancer cells via differential regulation of the expression of S100 proteins. Br. J. Cancer. 121:65–75. 10.1038/s41416-019-0483-9 - DOI - PMC - PubMed
    1. Bankhead, P. , Loughrey M.B., Fernández J.A., Dombrowski Y., McArt D.G., Dunne P.D., McQuaid S., Gray R.T., Murray L.J., Coleman H.G., et al. . 2017. QuPath: Open source software for digital pathology image analysis. Sci. Rep. 7:16878. 10.1038/s41598-017-17204-5 - DOI - PMC - PubMed
    1. Barnes, J.L. , Plank M.W., Asquith K., Maltby S., Sabino L.R., Kaiko G.E., Lochrin A., Horvat J.C., Mayall J.R., Kim R.Y., et al. . 2021. T-helper 22 cells develop as a distinct lineage from Th17 cells during bacterial infection and phenotypic stability is regulated by T-bet. Mucosal Immunol. 14:1077–1087. 10.1038/s41385-021-00414-6 - DOI - PubMed
    1. Borcherding, N. , Bormann N.L., and Kraus G.. 2020. scRepertoire: An R-based toolkit for single-cell immune receptor analysis. F1000 Res. 9:47. 10.12688/f1000research.22139.1 - DOI - PMC - PubMed
    1. Bovenschen, H.J. , van de Kerkhof P.C., van Erp P.E., Woestenenk R., Joosten I., and Koenen H.J.. 2011. Foxp3+ regulatory T cells of psoriasis patients easily differentiate into IL-17A-producing cells and are found in lesional skin. J. Invest. Dermatol. 131:1853–1860. 10.1038/jid.2011.139 - DOI - PubMed

MeSH terms