Prediction of clinical risk assessment and survival in chronic obstructive pulmonary disease with pulmonary hypertension
- PMID: 38861300
- PMCID: PMC11166097
- DOI: 10.1002/ctm2.1702
Prediction of clinical risk assessment and survival in chronic obstructive pulmonary disease with pulmonary hypertension
Abstract
Background: Patients with pulmonary hypertension (PH) and chronic obstructive pulmonary disease (COPD) have an increased risk of disease exacerbation and decreased survival. We aimed to develop and validate a non-invasive nomogram for predicting COPD associated with severe PH and a prognostic nomogram for patients with COPD and concurrent PH (COPD-PH).
Methods: This study included 535 patients with COPD-PH from six hospitals. A multivariate logistic regression analysis was used to analyse the risk factors for severe PH in patients with COPD and a multivariate Cox regression was used for the prognostic factors of COPD-PH. Performance was assessed using calibration, the area under the receiver operating characteristic curve and decision analysis curves. Kaplan-Meier curves were used for a survival analysis. The nomograms were developed as online network software.
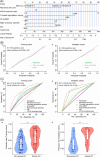
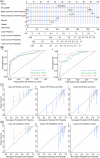
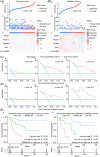
Results: Tricuspid regurgitation velocity, right ventricular diameter, N-terminal pro-brain natriuretic peptide (NT-proBNP), the red blood cell count, New York Heart Association functional class and sex were non-invasive independent variables of severe PH in patients with COPD. These variables were used to construct a risk assessment nomogram with good discrimination. NT-proBNP, mean pulmonary arterial pressure, partial pressure of arterial oxygen, the platelet count and albumin were independent prognostic factors for COPD-PH and were used to create a predictive nomogram of overall survival rates.
Conclusions: The proposed nomograms based on a large sample size of patients with COPD-PH could be used as non-invasive clinical tools to enhance the risk assessment of severe PH in patients with COPD and for the prognosis of COPD-PH. Additionally, the online network has the potential to provide artificial intelligence-assisted diagnosis and treatment.
Highlights: A multicentre study with a large sample of chronic obstructive pulmonary disease (COPD) patients diagnosed with PH through right heart catheterisation. A non-invasive online clinical tool for assessing severe pulmonary hypertension (PH) in COPD. The first risk assessment tool was established for Chinese patients with COPD-PH.
Keywords: COPD; nomogram; pulmonary hypertension; survival.
© 2024 The Author(s). Clinical and Translational Medicine published by John Wiley & Sons Australia, Ltd on behalf of Shanghai Institute of Clinical Bioinformatics.
Conflict of interest statement
The authors declare no conflicts of interest.
Figures


Similar articles
-
[Establishment and effect evaluation of nomogram model for diagnosis and prediction of pulmonary hypertension in patients with chronic obstructive pulmonary disease].Zhonghua Yi Xue Za Zhi. 2022 Oct 18;102(38):3019-3025. doi: 10.3760/cma.j.cn112137-20220512-01045. Zhonghua Yi Xue Za Zhi. 2022. PMID: 36229203 Chinese.
-
Construction and Validation of an Early Warning Model for Predicting the 28-Day Mortality in Sepsis Patients with Chronic Obstructive Pulmonary Disease.Int J Chron Obstruct Pulmon Dis. 2025 May 6;20:1373-1385. doi: 10.2147/COPD.S521816. eCollection 2025. Int J Chron Obstruct Pulmon Dis. 2025. PMID: 40352361 Free PMC article.
-
A nomogram for predicting short-term mortality in ICU patients with coexisting chronic obstructive pulmonary disease and congestive heart failure.Respir Med. 2024 Nov-Dec;234:107803. doi: 10.1016/j.rmed.2024.107803. Epub 2024 Sep 7. Respir Med. 2024. PMID: 39251097
-
Pulmonary hypertension in patients with chronic obstructive pulmonary disease: advances in pathophysiology and management.Drugs. 2009 Jun 18;69(9):1153-71. doi: 10.2165/00003495-200969090-00002. Drugs. 2009. PMID: 19537834 Review.
-
Pulmonary hypertension in chronic lung diseases.J Am Coll Cardiol. 2013 Dec 24;62(25 Suppl):D109-16. doi: 10.1016/j.jacc.2013.10.036. J Am Coll Cardiol. 2013. PMID: 24355635 Review.
Cited by
-
Ornithine decarboxylase antizyme 2 (OAZ2) in human colon adenocarcinoma: a potent prognostic factor associated with immunity.Sci Rep. 2025 Mar 3;15(1):7481. doi: 10.1038/s41598-025-90066-4. Sci Rep. 2025. PMID: 40032914 Free PMC article.
-
Relationship between advanced lung cancer inflammation index and all-cause and cause-specific mortality among chronic inflammatory airway diseases patients: a population-based study.Front Immunol. 2025 May 15;16:1585927. doi: 10.3389/fimmu.2025.1585927. eCollection 2025. Front Immunol. 2025. PMID: 40443682 Free PMC article.
-
Predictive and prognostic nomogram models for liver metastasis in colorectal neuroendocrine neoplasms: a large population study.Front Endocrinol (Lausanne). 2025 Jan 7;15:1488733. doi: 10.3389/fendo.2024.1488733. eCollection 2024. Front Endocrinol (Lausanne). 2025. PMID: 39839478 Free PMC article.
References
-
- Collaborators GBDCoD . Global, regional, and national age‐sex‐specific mortality for 282 causes of death in 195 countries and territories, 1980–2017: a systematic analysis for the Global Burden of Disease Study 2017. Lancet (Lond Engl). 2018;392(10159):1736‐1788. doi:10.1016/S0140-6736(18)32203-7 - DOI - PMC - PubMed
Publication types
MeSH terms
Grants and funding
- 82370063/National Natural Science Foundation of China
- 82170069/National Natural Science Foundation of China
- 82120108001/National Natural Science Foundation of China
- 82241012/National Natural Science Foundation of China
- 8224100322/National Natural Science Foundation of China
- 82000045/National Natural Science Foundation of China
- 2022YFE0131500/Ministry of Science and Technology of the People's Republic of China
- 2016YFC1304102/Ministry of Science and Technology of the People's Republic of China
- 2018YFC1311900/Ministry of Science and Technology of the People's Republic of China
- GZNL2023A02013/Guangzhou National Laboratory
- 2024A1515011208/Natural Science Foundation of Guangdong Province
- 2023A1515010443/Natural Science Foundation of Guangdong Province
- 2022A1515012052/Natural Science Foundation of Guangdong Province
- 2017BT01S155/Natural Science Foundation of Guangdong Province
- 202201010069/Guangzhou Municipal Science and Technology Bureau
- 202102020019/Guangzhou Municipal Science and Technology Bureau
- 2023B03J1387/Guangzhou Municipal Science and Technology Bureau
- 202201020401/Guangzhou Municipal Science and Technology Bureau
- SKLRD-Z-202101/State Key Laboratory of Respiratory Disease
- SKLRD-Z-202313/State Key Laboratory of Respiratory Disease
- YKD2021MS003/Inner Mongolia Medical University
- FKLY 20005/Shanghai Pulmonary Hospital
- 2022-03/Beijing Institute of Respiratory Medicine
- 202201-101/The Sixth Affiliated Hospital of Guangzhou Medical University
- 2017ZDKFKTO02/Department of Science and Technology of Yunnan Province
- 01-408-2201096/Guangzhou Medical University
LinkOut - more resources
Full Text Sources
Medical
Research Materials
