. 2024 Jun 11;134(15):e178945.
doi: 10.1172/JCI178945.

An attenuated lymphocytic choriomeningitis virus vector enhances tumor control in mice partly via IFN-I

Affiliations

An attenuated lymphocytic choriomeningitis virus vector enhances tumor control in mice partly via IFN-I

Young Rock Chung et al. J Clin Invest. .

Abstract

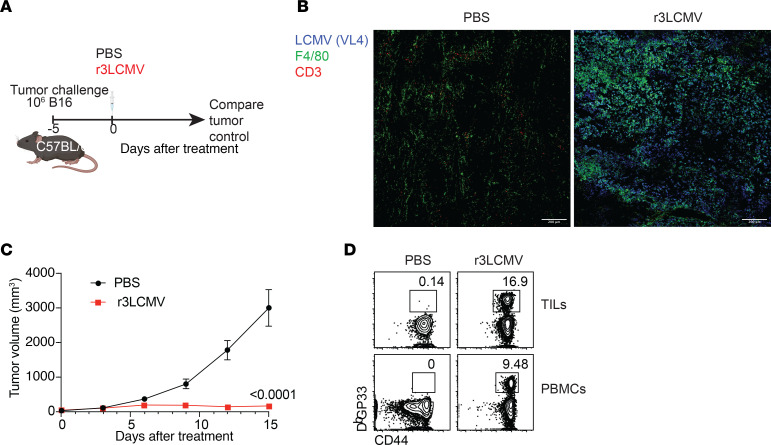
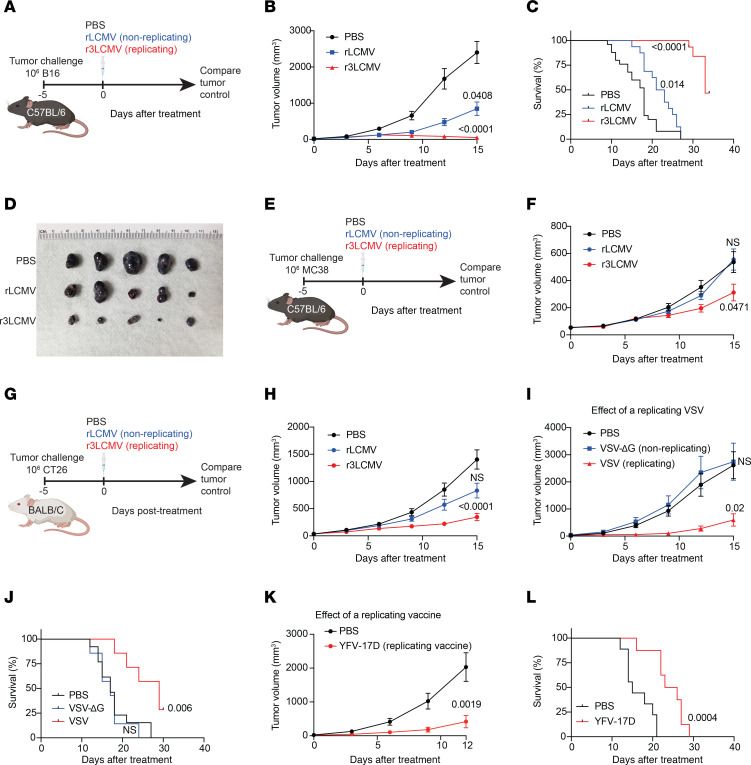
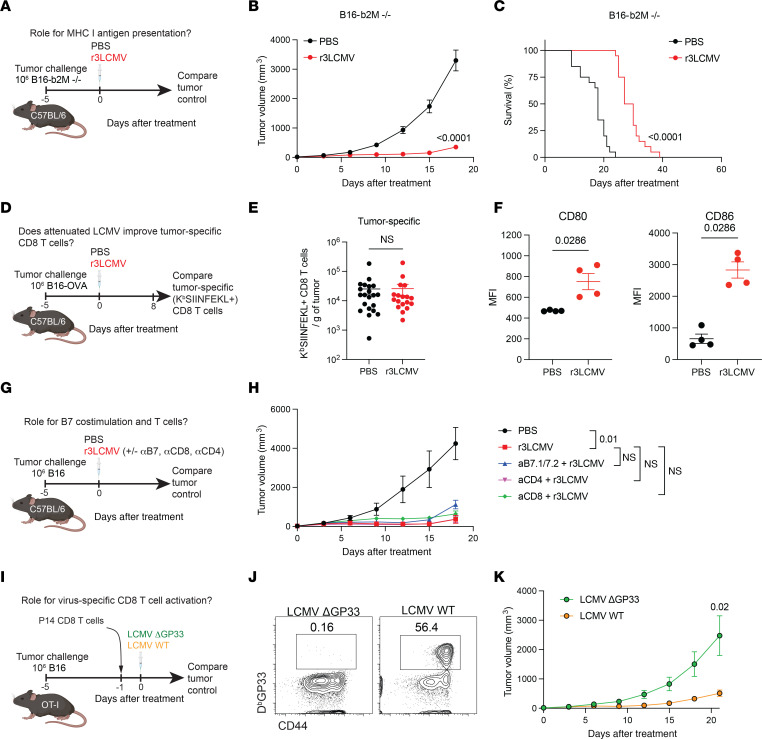
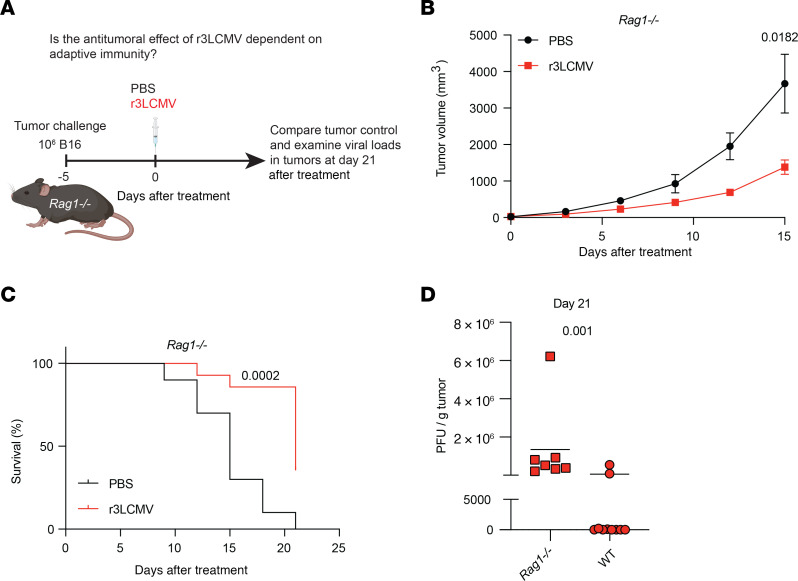
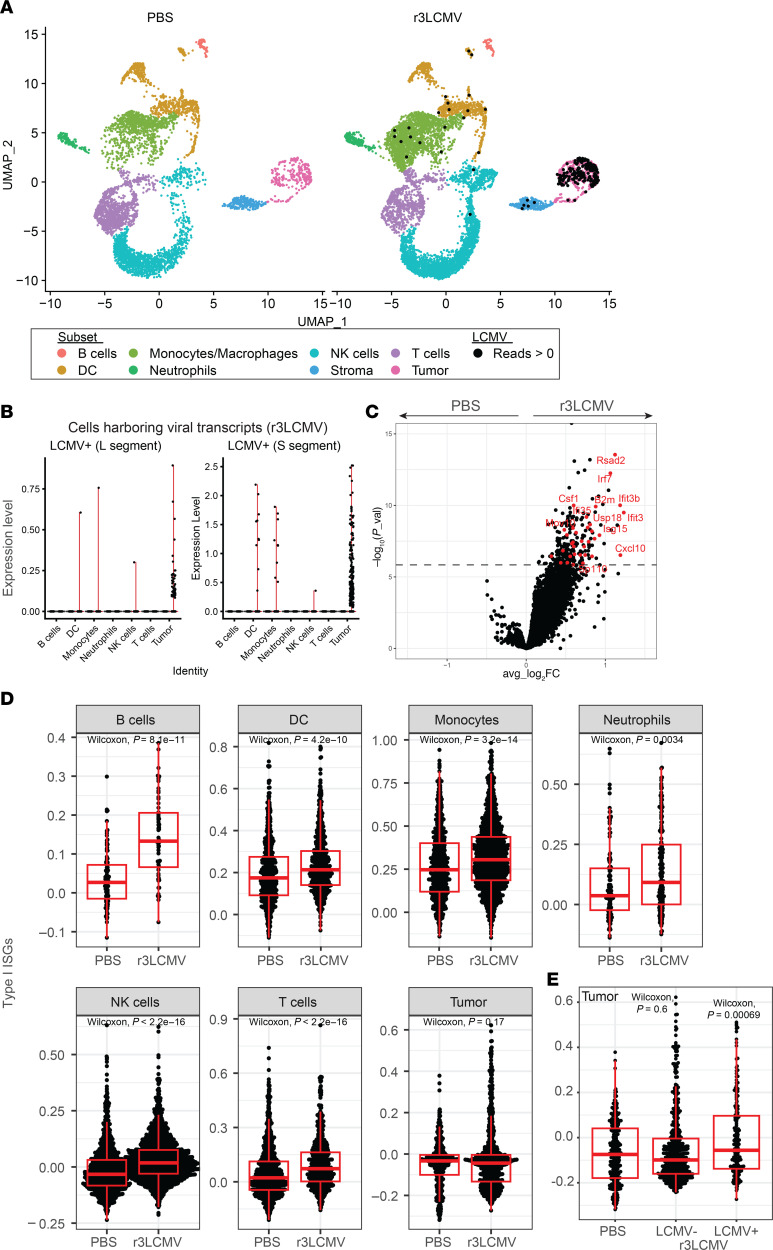
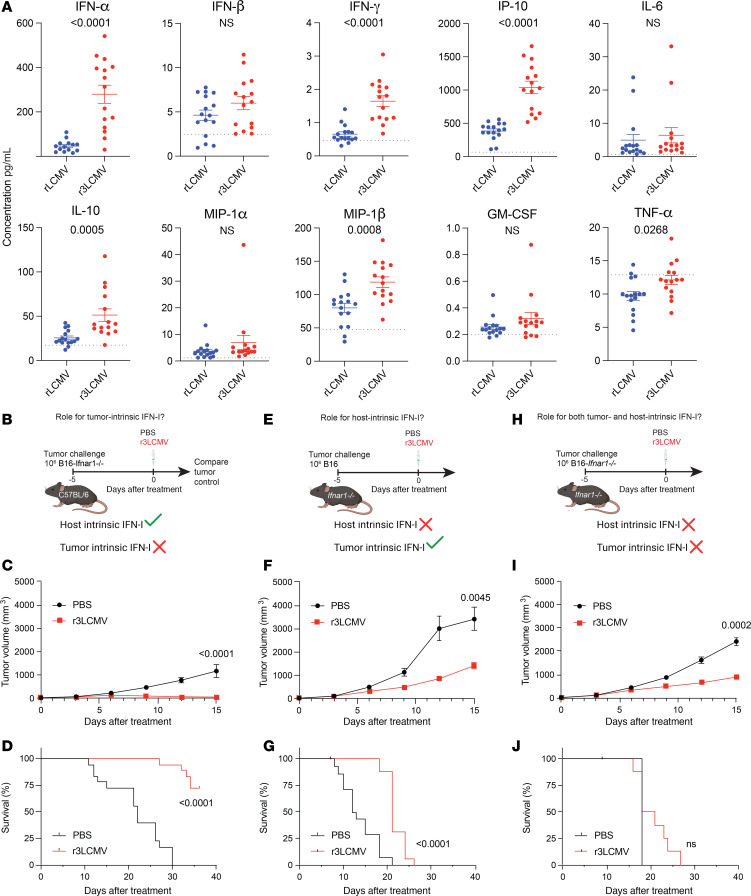
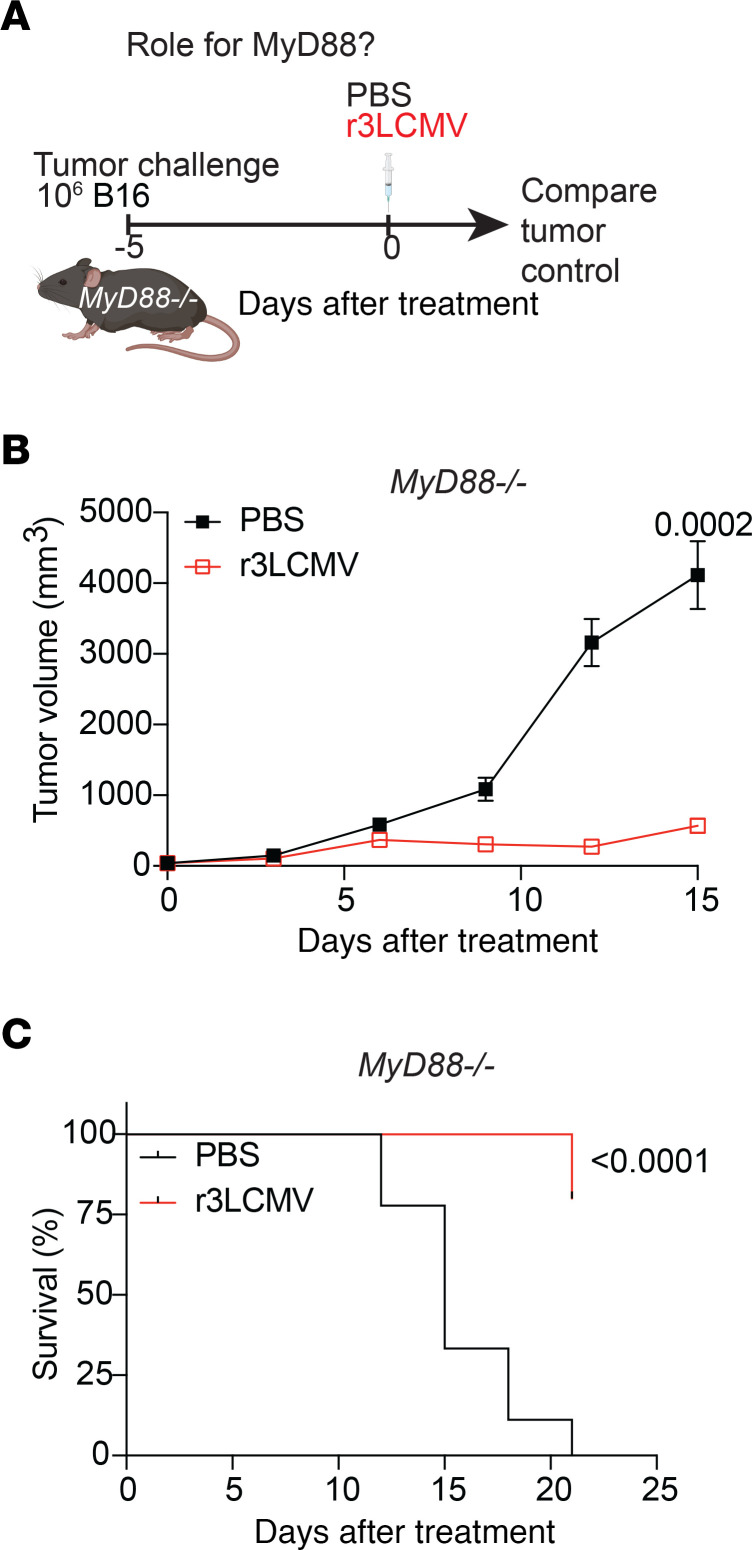
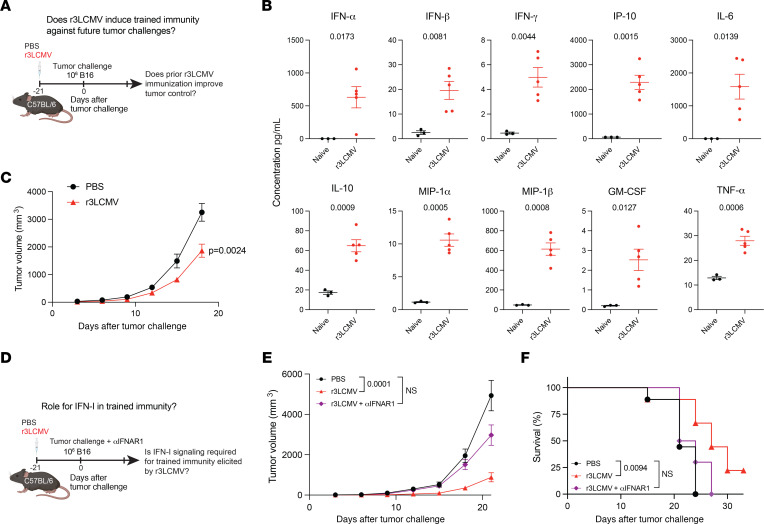
Viral vectors are being used for the treatment of cancer. Yet, their efficacy varies among tumors and their use poses challenges in immunosuppressed patients, underscoring the need for alternatives. We report striking antitumoral effects by a nonlytic viral vector based on attenuated lymphocytic choriomeningitis virus (r3LCMV). We show in multiple tumor models that injection of tumor-bearing mice with this vector results in improved tumor control and survival. Importantly, r3LCMV improved tumor control in immunodeficient Rag1-/- mice and MyD88-/- mice, suggesting that multiple pathways contributed to the antitumoral effects. The antitumoral effects of r3LCMV were also observed when this vector was administered several weeks before tumor challenges, suggesting the induction of trained immunity. Single-cell RNA sequencing analyses, antibody blockade experiments, and knockout models revealed a critical role for host-intrinsic IFN-I in the antitumoral efficacy of r3LCMV vectors. Collectively, these data demonstrate potent antitumoral effects by r3LCMV vectors and unveil multiple mechanisms underlying their antitumoral efficacy.

Keywords: Adaptive immunity; Cancer immunotherapy; Cellular immune response; Immunology; Vaccines.


Figures

Figure 1
Figure 1. r3LCMV replicates in B16 tumors and improves tumor control.
(A) Experiment outline for evaluating whether r3LCMV improves tumor control. (B) Representative immunofluorescence staining in tumor sections at day 4 after treatment. We used an LCMV nucleoprotein-specific antibody (clone VL4) to label virus-infected cells in tumor sections. Scale bars: 200 μm. (C) Tumor control. (D) Representative FACS plots showing LCMV-specific CD8+ T cell responses at day 7 after treatment (gated on live CD8+ T cells). TILs, tumor-infiltrating lymphocytes. Mice were treated intratumorally with 2 × 10⁵ focus-forming units (FFU) of r3LCMV, 5 days after subcutaneous tumor challenge. Before r3LCMV treatments, groups were distributed evenly according to tumor size. Data are pooled from 2 experiments (one experiment with n = 5 per group and another with n = 7 per group). Error bars represent SEM. Indicated P values were calculated by the Mann-Whitney test.
Figure 2
Figure 2. Comparing the antitumoral effects of replicating versus non-replicating viral vectors.
(AD) Effect of replicating (r3LCMV) versus non-replicating (rLCMV) vectors in the B16 melanoma model in C57BL/6 mice. (A) Experiment outline. The setup was similar to that in Figure 1 but comparing replicating versus non-replicating LCMV vectors. (B) Tumor control. (C) Survival. (D) Representative images of tumors at day 8 after treatment. (E and F) Effect of replicating versus non-replicating LCMV vectors in the colon adenocarcinoma model in C57BL/6 mice. (E) Experiment outline. (F) Tumor control. (G and H) Effect of replicating versus non-replicating LCMV vectors in the CT26 colon carcinoma model in BALB/c mice. (G) Experiment outline. (H) Tumor control. (I and J) Effect of replicating versus non-replicating VSV in the B16 melanoma model in C57BL/6 mice. (I) Tumor control. (J) Survival. (K and L) Effect of replicating YFV-17D vaccine in the B16 melanoma model in C57BL/6 mice. (K) Tumor control. (L) Survival. Mice were treated intratumorally with 2 × 10⁵ FFU of the indicated viruses, 5 days after tumor challenge. LCMV data are pooled from 2 experiments per tumor model (n = 5–13 per group). VSV data are pooled from 2 experiments per tumor model (n = 3–7 per group). YFV-17D data are pooled from 2 experiments per tumor model (n = 4–5 per group). Error bars represent SEM. Indicated P values in the tumor volume plots were calculated by the Mann-Whitney test, or by Kruskal-Wallis test with Dunn’s multiple-comparison test when comparing more than 2 groups. Indicated P values in the survival plots were calculated by the log rank test.
Figure 3
Figure 3. r3LCMV exerts antitumoral effects independent of CD8+ T cells and B7/CD28 costimulation.
(AC) Effect of r3LCMV vectors in the B16-B2m–/– melanoma model. (A) Experiment outline for evaluating the role of MHC I. (B) Tumor control. (C) Survival. (D and E) Effect of LCMV vectors on tumor-specific CD8+ T cell responses. (D) Experiment outline for measuring tumor-specific CD8+ T cells in the tumor. (E) Tumor-specific CD8+ T cells at day 8 after treatment. (F and G) Upregulation of B7 costimulatory molecules by r3LCMV. (F) CD80 and CD86 costimulatory molecules on dendritic cells from tumor-draining lymph nodes. Dendritic cells were gated on live, CD3, NK1.1, Ly-6G, CD19, CD11b+, CD11c+ at day 4 after treatment. (G and H) Effect of B7 costimulation blockade, CD8+ T cell depletion, and CD4+ T cell depletion. B7.1/B7.2-blocking antibodies, CD8+ T cell–depleting antibodies, or CD4+ T cell–depleting antibodies were administered i.p. every 3 days (see Methods for dosing information). (G) Experiment outline for evaluating the role of T cells and costimulation. (H) Tumor control. (IK) Effect of virus-specific CD8+ T cells. (I) Experiment outline for evaluating the role of virus-specific T cell activation. (J) Representative FACS plots showing P14 cell expansion in PBMCs at day 7 after treatment. (K) Tumor control. Data from AC are pooled from 2 experiments (one experiment with n = 10 per group and another with n = 10 per group). Data from D and E are pooled from 2 experiments (one experiment with n = 9 per group and another with n = 9–12 per group). Data from F are from 1 representative experiment (n = 4 per group). Data from G and H are from 1 representative experiment (n = 6–7 per group). Data from IK are from 1 representative experiment (n = 6–7 per group). Error bars represent SEM. Indicated P values in the tumor volume plots were calculated by the Mann-Whitney test, or by Kruskal-Wallis test with Dunn’s multiple-comparison test when comparing more than 2 groups. Indicated P values in the survival plot were calculated by the log rank test.
Figure 4
Figure 4. r3LCMV therapy improves tumor control in Rag1–/– mice.
(A) Experiment outline. (B) Tumor control. (C) Survival. (D) Viral loads in tumors at day 21 after treatment. Viral loads were quantified by plaque assays on Vero cell monolayers. Data from B and C are pooled from 2 experiments (one experiment with n = 5 per group and another with n = 5–9 per group). Data from D are from the tumors of 7 Rag1–/– mice that were treated with r3LCMV and survived until day 21 (tumors of 10 wild-type mice that were treated with r3LCMV and survived until day 21 are included for comparison). Error bars represent SEM. Indicated P values were calculated by the Mann-Whitney test, or log rank test when comparing survival.
Figure 5
Figure 5. scRNA-Seq reveals enrichment of IFN-I responses by r3LCMV therapy.
We performed gene expression analyses to understand the effects of r3LCMV on different cell subsets within the tumor microenvironment at day 4 after treatment. (A) Uniform manifold approximation and projection (UMAP) plots showing cell distribution based on RNA expression. Each cell is colored by its inferred subset (based on the Immunological Genome Project [ImmGen] database). Cells harboring LCMV reads are indicated by a black dot. (B) Level of expression of LCMV L and S transcripts on different cell subsets from r3LCMV-treated mice. (C) Volcano plot showing the differential expression of genes in tumor cells harboring LCMV reads versus those without LCMV reads. The dashed line indicates P value adjusted for multiple testing of 0.05. ISGs are indicated in red. (D) Enrichment for ISGs in different cell subsets. (E) ISGs on tumor cells harboring LCMV or not harboring LCMV. This panel shows that tumor cells with LCMV reads express higher levels of ISGs relative to tumor cells without LCMV reads. For each box plot, the vertical line indicates the median, the box indicates the interquartile range, and the whiskers indicate 1.5 times the interquartile range. Approximately 80% of cells were CD45+ (after MACS purification). Each group represents pooled tumors from 5 different mice. Indicated P values were calculated by Wilcoxon’s test.
Figure 6
Figure 6. Confirmatory mechanistic studies corroborate a role for IFN-I.
(A) Cytokine responses at day 1 after treatment. Dotted lines represent naive levels. (BD) Effect of r3LCMV vectors on B16-Ifnar1–/– melanoma. (B) Experiment outline for evaluating the role of tumor-intrinsic IFN-I. (C) Tumor control. (D) Survival. (EG) Effect of r3LCMV vectors on Ifnar1–/– mice. (E) Experiment outline for evaluating the role of host-intrinsic IFN-I. (F) Tumor control. (G) Survival. (HJ) Effect of r3LCMV vectors on B16-Ifnar1–/– melanoma in Ifnar1–/– mice. (H) Experiment outline for evaluating the combined role of tumor-intrinsic and host-intrinsic IFN-I. (I) Tumor control. (J) Survival. Data from A are pooled from 3 experiments (one experiment with n = 5 per group, another with n = 5 per group, and another with n = 5–6 per group). Data from BG are pooled from 2 experiments (one experiment with n = 8–9 per group, and another with n = 8–10 per group). Data from HJ are pooled from 2 experiments (n = 4–5 per group). Error bars represent SEM. Indicated P values were calculated by the Mann-Whitney test, or log rank test when comparing survival.
Figure 7
Figure 7. r3LCMV therapy improves tumor control in MyD88–/– mice.
(A) Experiment outline. The setup was similar to that in Figure 1, but using MyD88–/– mice instead of wild-type mice. (B) Tumor control. (C) Survival. Data are pooled from 2 experiments (n = 4–5 per group/experiment). Error bars represent SEM. Indicated P values were calculated by the Mann-Whitney test, or log rank test when comparing survival.
Figure 8
Figure 8. Prior treatment with r3LCMV renders mice more resistant to tumor challenges.
We tested whether mice that had previously been injected with r3LCMV were protected upon subsequent tumor challenges. (A) Experiment outline to evaluate the effect of prior r3LCMV treatment on subsequent tumor challenges (trained immunity). (B) Cytokine responses at day 1 after r3LCMV treatment. (C) Tumor control. (D) The experiment in A was repeated, but mice were treated with IFNAR1-blocking antibodies at the time of tumor challenge (see Methods) to examine the role of IFN-I signaling. (E) Tumor control in the context of IFNAR1 blockade. (F) Survival in the context of IFNAR1 blockade. Cytokine data from B are from 1 experiment with n = 5 mice (naive mice are shown as controls); the experiment was repeated with similar results. Data from C are from 2 experiments, n = 13 per group. Data from DF are from 2 experiments (n = 4–5 per group). Error bars represent SEM. Indicated P values in cytokine plots were calculated by Welch’s t test. Indicated P values in the tumor volume plots were calculated by the Mann-Whitney test, or by Kruskal-Wallis test with Dunn’s multiple-comparison test when comparing more than 2 groups. Indicated P values in the survival plot were calculated by the log rank test.

Similar articles

Cited by

References

    1. Bommareddy PK, et al. Integrating oncolytic viruses in combination cancer immunotherapy. Nat Rev Immunol. 2018;18(8):498–513. doi: 10.1038/s41577-018-0014-6. - DOI - PubMed
    1. Andtbacka RH, et al. Talimogene laherparepvec improves durable response rate in patients with advanced melanoma. J Clin Oncol. 2015;33(25):2780–2788. doi: 10.1200/JCO.2014.58.3377. - DOI - PubMed
    1. Popkin DL, et al. Expanded potential for recombinant trisegmented lymphocytic choriomeningitis viruses: protein production, antibody production, and in vivo assessment of biological function of genes of interest. J Virol. 2011;85(15):7928–7932. doi: 10.1128/JVI.00486-11. - DOI - PMC - PubMed
    1. Emonet SF, et al. Generation of recombinant lymphocytic choriomeningitis viruses with trisegmented genomes stably expressing two additional genes of interest. Proc Natl Acad Sci USA. 2009;106(9):3473–3478. doi: 10.1073/pnas.0900088106. - DOI - PMC - PubMed
    1. Bonilla WV, et al. Heterologous arenavirus vector prime-boost overrules self-tolerance for efficient tumor-specific CD8 T cell attack. Cell Rep Med. 2021;2(3):100209. doi: 10.1016/j.xcrm.2021.100209. - DOI - PMC - PubMed

MeSH terms