. 2024 Jun 11;134(15):e172908.
doi: 10.1172/JCI172908.

Kisspeptin signaling in astrocytes modulates the reproductive axis

Affiliations

Kisspeptin signaling in astrocytes modulates the reproductive axis

Encarnacion Torres et al. J Clin Invest. .

Abstract

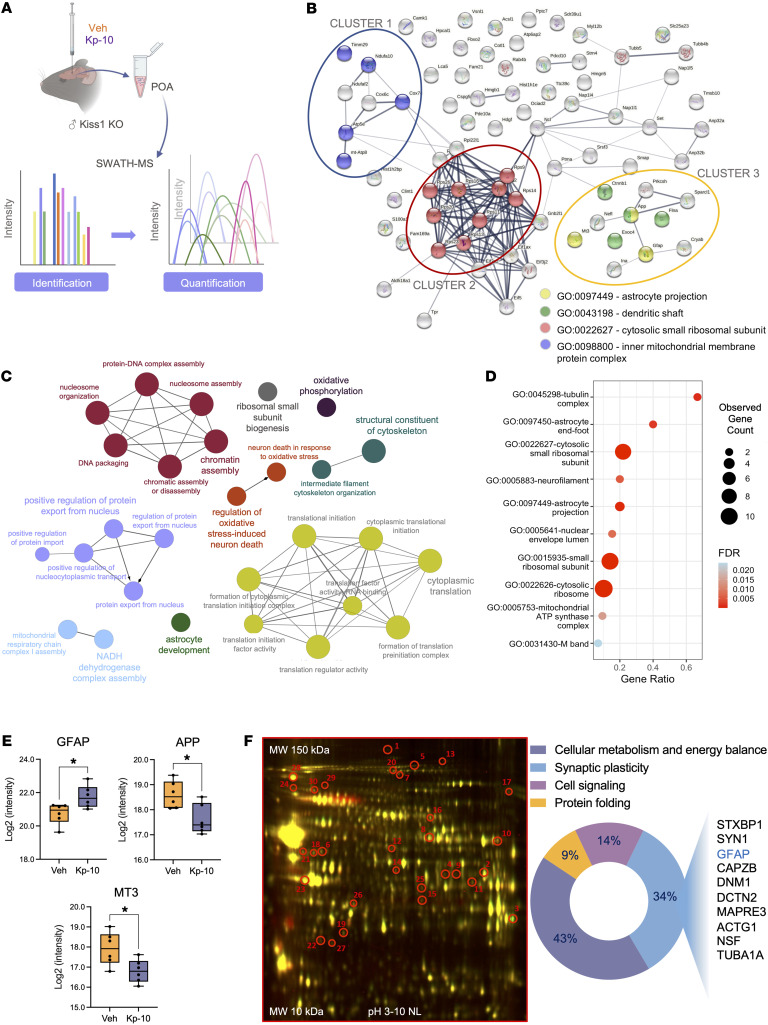
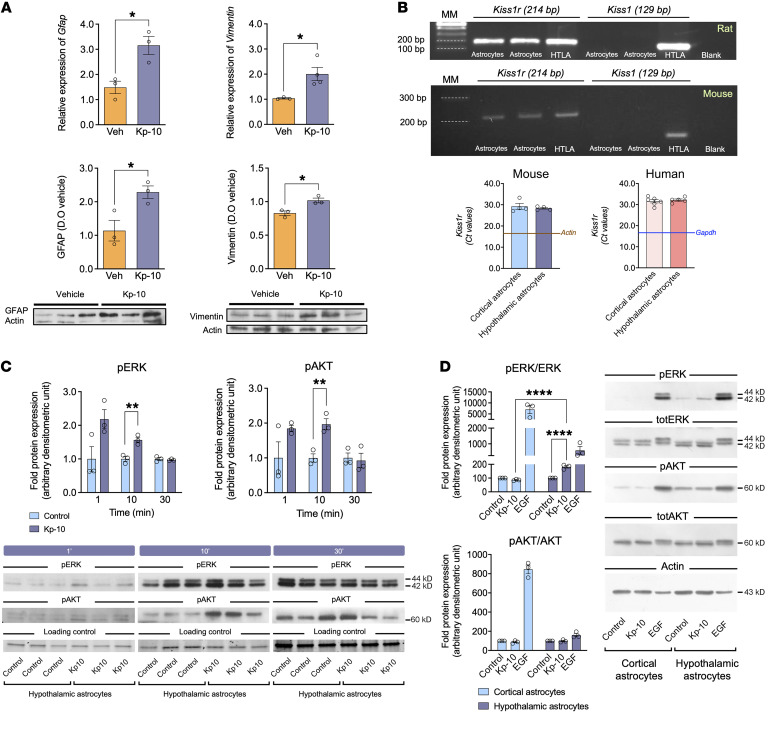
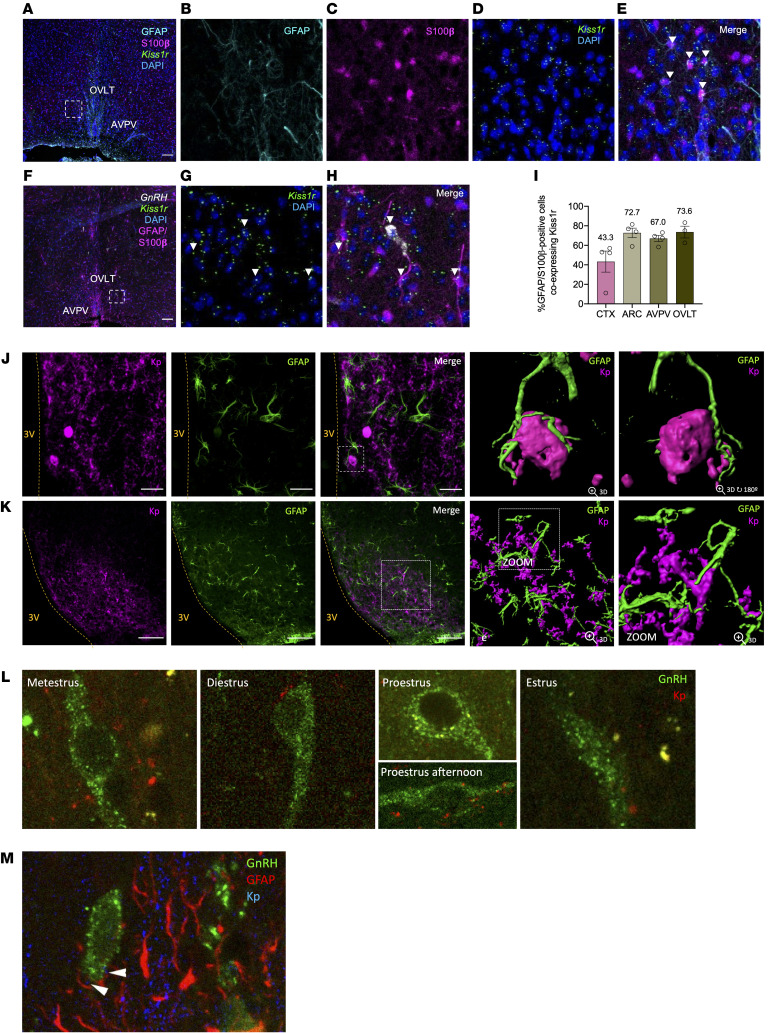
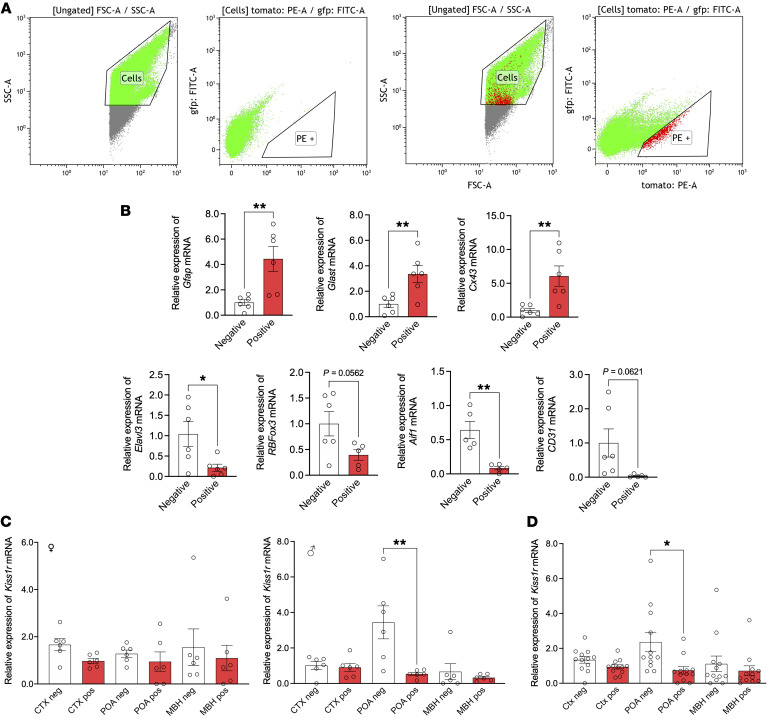
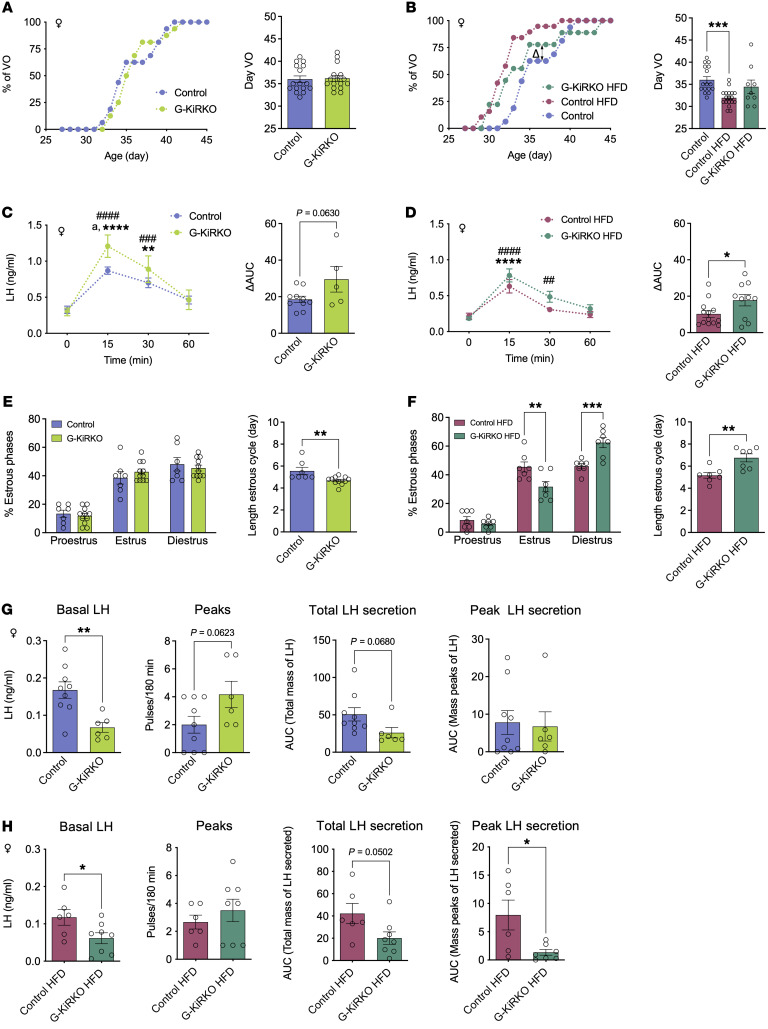
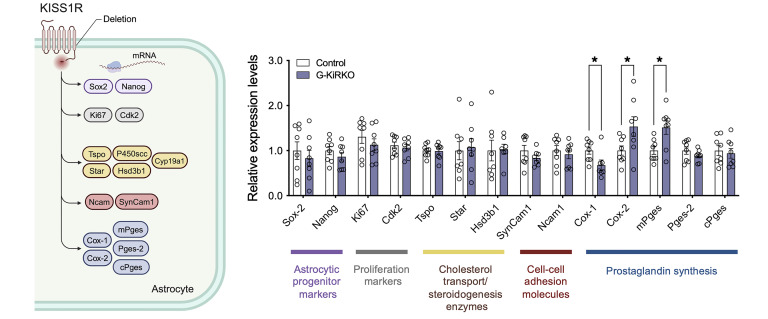
Reproduction is safeguarded by multiple, often cooperative, regulatory networks. Kisspeptin signaling, via KISS1R, plays a fundamental role in reproductive control, primarily by regulation of hypothalamic GnRH neurons. We disclose herein a pathway for direct kisspeptin actions in astrocytes that contributes to central reproductive modulation. Protein-protein interaction and ontology analyses of hypothalamic proteomic profiles after kisspeptin stimulation revealed that glial/astrocyte markers are regulated by kisspeptin in mice. This glial-kisspeptin pathway was validated by the demonstrated expression of Kiss1r in mouse astrocytes in vivo and astrocyte cultures from humans, rats, and mice, where kisspeptin activated canonical intracellular signaling-pathways. Cellular coexpression of Kiss1r with the astrocyte markers GFAP and S100-β occurred in different brain regions, with higher percentage in Kiss1- and GnRH-enriched areas. Conditional ablation of Kiss1r in GFAP-positive cells in the G-KiR-KO mouse altered gene expression of key factors in PGE2 synthesis in astrocytes and perturbed astrocyte-GnRH neuronal appositions, as well as LH responses to kisspeptin and LH pulsatility, as surrogate marker of GnRH secretion. G-KiR-KO mice also displayed changes in reproductive responses to metabolic stress induced by high-fat diet, affecting female pubertal onset, estrous cyclicity, and LH-secretory profiles. Our data unveil a nonneuronal pathway for kisspeptin actions in astrocytes, which cooperates in fine-tuning the reproductive axis and its responses to metabolic stress.

Keywords: Endocrinology; Fertility; Neuroendocrine regulation; Reproductive biochemistry; Reproductive biology.


Figures

Figure 1
Figure 1. Identification of kisspeptin targets in POA by proteomic analysis.
(A) Scheme of experimental design to identify new targets of kisspeptin actions in adult Kiss1-KO male mice (n = 6 per group), using SWATH-MS method. (B) High throughput data (77 differentially expressed proteins found) were analyzed via STRING to build functional protein association networks (the 3 main clusters circled correspond to GO terms). Analyses were also implemented by (C) enrichment analyses in GO categories such as biological process visualized by Cytoscape platform and (D) cellular components using ggplot2 R package (cut-off r > 0.800). (E) box-plots represent the intensity of GFAP, APP and MT3 proteins from SWATH-MS raw data. Data are the mean ± SEM. Statistical significance was determined by Student’s t test: *P < 0.05 versus corresponding values in adult Kiss1-KO mice treated with vehicle (Veh). (F) 2D-DIGE map (left panel) and pie chart (right panel) presenting the GO of enriched proteins from an independent validation of Kp-10 effects on Kiss1 KO mice. Red circles highlight differential protein expression in POA from Kiss1-KO mice after Kp-10 injection (n = 3) versus vehicle-treated mice (n = 3). Spots were identified by MALDI-MS/MS.
Figure 2
Figure 2. Evidence for kisspeptin signaling in astrocytes.
(A) Expression analysis of glial markers Gfap/GFAP and Vimentin/Vimentin at mRNA and protein levels in POA of adult Kiss1-KO male mice after i.c.v. Kp-10 stimulation (n = 3–4) versus vehicle (n = 3). Data are the mean ± SEM. Statistical significance was determined by Student’s t test: *P < 0.05 versus KO mice treated with vehicle. (B) Representative gels illustrating the expression of Kiss1r, but not Kiss1 mRNA in 2 pools of primary astrocyte cultures from neonatal rat (upper gel) and mouse (lower gel) hypothalamus are presented. Hypothalamic (HTLA) tissue was used as positive control. MM, molecular markers. Real-time PCR of Kiss1r mRNA in primary mouse and human astrocyte cultures (n = 4 for mouse; n = 6 cortical and 5 hypothalamic human cultures) is also shown; values correspond to Ct data. The blue line represents the mean Ct value of the housekeeping gene. In (C), Western blots of phosphorylated ERK (pERK) and AKT (pAKT) in primary rat hypothalamic astrocytes are shown. Bar graphs show the effect of Kp-10 treatment (10–8 M; n = 3) at 1, 10, and 30 minutes (upper panel); representative blots are shown in the lower panel. Astrocyte cultures treated with vehicle (n = 3) were used as a negative control. Data are the mean ± SEM. Statistical significance was determined by Student’s t test: **P < 0.01 versus astrocytes treated with vehicle. (D) Western blots of pERK, total ERK (totERK), pAKT, total AKT (totAKT), and actin, in primary mouse cerebrocortical and hypothalamic astrocytes treated with Kp-10 (n = 3) or Epidermal Growth Factor (EGF, 50 ng/mL; n = 3), used as a positive control. Vehicle-treated astrocytes (n = 3) were used as a negative controls. Data are the mean ± SEM. Statistical significance was determined by 2-way ANOVA followed by Bonferroni’s post hoc test: ****P < 0.0001, astrocytes treated with Kp-10 versus vehicle; or cortical versus hypothalamic astrocytes.
Figure 3
Figure 3. Coexpression of Kiss1r in astrocytes and evidence for direct astrocyte-Kiss1 neuron interplay.
(AH) Dual RNAscope ISH combined with IHC in brain sections from diestrous female mice (n = 4). (A) Representative image showing Kiss1r (green) mRNA and GFAP (cyan) and S100-β (magenta) in the preoptic region. The magnified area (from dotted square in A) shows individual signals (BD), while merge image documents coexpression of Kiss1r in GFAP/S100-β–positive cells (arrowheads; E). (F) Representative image of Kiss1r (green) and GnRH (white) mRNA expression and combined detection of astrocyte markers GFAP and S100-β proteins (magenta) in POA, including OVLT and AVPV. The magnified area (from dotted square in F) shows Kiss1r expression and neuronal nuclear labelling with DAPI (blue; G), while coexpression (arrowheads) of Kiss1r with GnRH and Kiss1r with astrocyte markers is shown in H. (I) Percentage of GFAP/S100-β–positive cells coexpressing Kiss1r mRNA in key hypothalamic areas, including ARC and AVPV, OVLT, and cortex (CTX). Scale bars (AF): 100 μm. Data are the mean ± SEM. (J and K) Anatomical relationships between Kp-immunoreactive neurons and GFAP-positive astrocytes from diestrous female mice. Individual and merged images of Kp (magenta) and GFAP (green) are presented from AVPV (J) and ARC (K); 3D reconstructions of GFAP-immunoreactive astrocytes enwrapping cell bodies of Kp cells in AVPV are also shown (J); close appositions between GFAP-immunoreactive astrocytes and Kp fibers are detected in ARC at high magnification (K). Scale bars: 50 μm (J); 100 μm (K). (L) Representative images of GnRH neurons in close apposition with Kp fibers are shown at the stages of the ovarian cycle (10:00 a.m.); an additional image at proestrus afternoon is shown. Merge images of GnRH neurons (green) and Kp fibers (red) in the medial septal nucleus are presented. Images were taken with total 80× magnification. (M) Higher magnification (×2) of a representative image, with triple labeling of GnRH-neurons (green), Kp-fibers (blue) and GFAP-positive cells (red), in the hypothalamic medial septal nucleus.
Figure 4
Figure 4. Kiss1r expression in astrocytes from adult mice isolated by FACS.
(A) Gating strategy for astrocyte isolation by FACS. The 2 plots in the left represent cells incubated with the control isotype; the 2 plots in the right represent cells incubated with the anti-ACSA-2-PE antibody. (B) Real-time PCR of astroglial [Gfap, Glast, Connexin-43 (Cx43)], neuronal (Elavl3, RBFox3), microglial (Aif1), and endothelial (CD31) genes in FACS-sorted positive and negative fractions of the MBH of female mice, used for validation purposes. (C) Real-time PCR analysis of Kiss1r in FACS-sorted positive and negative fractions obtained from 3 brain areas (POA, MBH, and cortex [CTX]) of adult male and female (diestrus) mice. Expression data segregated by sex (females, left panel; males, right panel) are presented. Sex-aggregated data, divided per brain region, are displayed in D. n = 6 animals per sex. Values in the positive fraction are expressed relative to negative fraction values, set at 1. Data are the mean ± SEM. Statistical significance was determined by Student’s t test in B: *P < 0.05; **P < 0.01, versus corresponding negative fraction; and by 2-way ANOVA followed by Bonferroni’s post hoc test for regional and sex analyses in C and D: *P < 0.05; **P < 0.01 versus negative fraction. Note that of the 36 positive fractions (3 regions × 2 sexes × 6 animals per group) tested, Kiss1r expression was readily detectable in 33, with a mean Ct value of 21.9.
Figure 5
Figure 5. Characterization of reproductive phenotype of G-KiR-KO female mice.
In upper panels, accumulated percentage of female mice displaying vaginal opening (VO; as pubertal marker) postweaning, under normal diet (A) or HFD (B); mean ages of VO are presented as histograms. Group sizes: control (n = 16); G-KiR-KO (n = 16); control-HFD (n = 18); and G-KiR-KO-HFD (n = 9). Statistical significance for mean VO was assessed by Student’s t test (A) or 1-way ANOVA followed by Bonferroni’s test (B) ***P < 0.001 versus control mice. LH secretory responses, as 60 minute profile after Kp-10 injection (50 pmol), are shown for adult control and G-KiR-KO female mice fed normal diet (C) or HFD (D); net increment of integral (AUC) LH secretion over 60 minute period after Kp-10 is also presented. Group sizes: control (n = 10); G-KiR-KO (n = 5); control-HFD (n = 13); and GKiR-KO-HFD (n = 10). Statistical significance was determined by Student’s t test: *P < 0.05 versus control mice (AUC); and 2-way ANOVA followed by Bonferroni’s test for time-course analyses: **/##P < 0.01; ###P < 0.001 and ****/####P < 0.0001 versus corresponding basal (time-0) values; and a P < 0.05 G-KiR-KO versus control mice. (E and F) Graphs showing the percentage distribution of estrous cycle phases in control and G-KiR-KO mice for normal diet (E) and HFD (F); control (n = 7); G-KiR-KO (n = 12); control-HFD (n = 7) and G-KiR-KO-HFD (n = 7). Mean duration of estrous cycle is displayed also. Statistical significance was determined by Student’s t test (E) **P < 0.01 versus control mice with normal diet; and by 2-way ANOVA followed by Bonferroni’s test (F) **P < 0.01; ***P < 0.001 versus control mice fed with HFD. (G) LH pulsatility parameters in G-KiR-KO mice fed control diet are shown; control (n = 9), G-KiR-KO (n = 6). Bar graphs showing basal LH, numbers of LH pulses (peaks), net increment (AUC) LH secretion, and peak LH secretion over 3 hour sampling are presented. (H) Similar parameters are shown for G-KiR-KO mice under a HFD; control (n = 6), G-KiR-KO (n = 8). Student’s t test: *P < 0.05; **P < 0.01 versus. control mice.
Figure 6
Figure 6. Gene expression profiling in G-KiR-KO astrocyte primary cultures.
A comprehensive overview of the set of genes whose expression was analyzed by qPCR in astrocyte cultures of G-KiR-KO mice is shown in the left panel. Gene categories correspond to astrocyte progenitors (purple), astrocyte proliferation (grey), cholesterol transport, and steroidogenesis (yellow-brown), cell-cell adhesion interaction (red), and prostaglandin synthesis (blue). In the right panel, quantitative data from qPCR expression analyses conducted in duplicate in individual astrocyte cultures from control (n = 4) and G-KiR-KO (n = 4) mice. The expression levels of Sox-2, Nanog, Ki67, Cdk2, Tspo, Star, Hsd3b1, SynCam1, Ncam1, Cox-1, Cox-2, mPges, Pges-2, and cPges mRNA are shown after normalization using S11 expression levels. Note that P450scc and P450arom displayed virtually undetectable expression levels in our cultures, and hence are not presented in the histograms. Data are shown as mean ± SEM. Statistical significance was determined by Student’s t test, *P < 0.05 versus corresponding values in control astrocytes.

Comment in

  • Astrocytes: a star emerges in the control of reproductive hormones

Similar articles

Cited by

References

    1. Herbison AE. Control of puberty onset and fertility by gonadotropin-releasing hormone neurons. Nat Rev Endocrinol. 2016;12(8):452–466. doi: 10.1038/nrendo.2016.70. - DOI - PubMed
    1. Maeda K, et al. Neurobiological mechanisms underlying GnRH pulse generation by the hypothalamus. Brain Res. 2010;1364:103–115. doi: 10.1016/j.brainres.2010.10.026. - DOI - PubMed
    1. Sobrino V, et al. Kisspeptins and the neuroendocrine control of reproduction: Recent progress and new frontiers in kisspeptin research. Front Neuroendocrinol. 2022;65:100977. doi: 10.1016/j.yfrne.2021.100977. - DOI - PubMed
    1. Kirilov M, et al. Dependence of fertility on kisspeptin-Gpr54 signaling at the GnRH neuron. Nat Commun. 2013;4:2492. doi: 10.1038/ncomms3492. - DOI - PubMed
    1. Novaira HJ, et al. Disrupted kisspeptin signaling in GnRH neurons leads to hypogonadotrophic hypogonadism. Mol Endocrinol. 2014;28(2):225–238. doi: 10.1210/me.2013-1319. - DOI - PMC - PubMed

MeSH terms