

doi: 10.1182/bloodadvances.2023012016.
Platelet proteomic profiling reveals potential mediators of immunothrombosis and proteostasis in myeloproliferative neoplasms
Affiliations
- PMID: 38861353
- PMCID: PMC11372589
- DOI: 10.1182/bloodadvances.2023012016
Item in Clipboard
Platelet proteomic profiling reveals potential mediators of immunothrombosis and proteostasis in myeloproliferative neoplasms
Blood Adv.
.
No abstract available
Conflict of interest statement
Figures
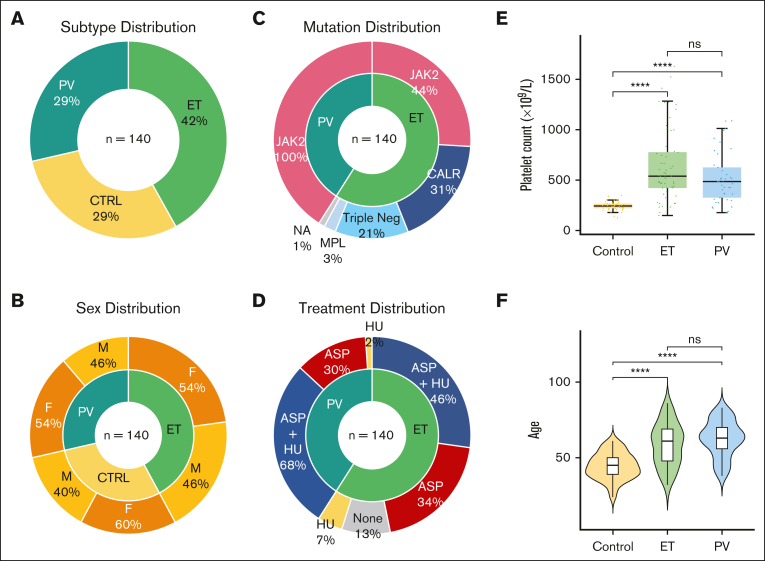
Clinical demographics of patients with MPN and healthy controls. (A) Similarity in distribution of MPN subtypes and controls, with slightly higher proportion ET (PV n = 41, ET n = 59, control n = 40). (B) Comparable and balanced distribution of sex across MPN subtypes and controls. Larger percentage of female healthy controls. (C) All patients with PV harbored the JAK2 V617F mutation, and in keeping with the general ET population JAK2 V617F was the most common driver mutation followed by CALR and MPL, with 12 patients with triple-negative ET included in this study. (D) MPN patient therapies reflecting current clinical practice. Most patients with PV and ET were prescribed aspirin (ASA), with hydroxyurea (HU) as a commonly used cytoreductive therapy. To control for any interpatient variability, all treatment, in addition to patient, sex and experimental batch are adjusted as confounding factors in downstream differential expression analyses. (E) Comparable distribution of age across MPN subtypes and controls. Violin plots of patient age from each MPN subtype reflect clinical expectation, with slightly higher median age noted for patients with ET and PV than that for controls. (F) Platelet counts, as box plots, measured at the same date and time as experimental platelet sampling. As expected, Mann-Whitney U tests marked by asterisks indicate a statistically significant difference between control and MPN groups (∗∗∗∗P ≤ 0.0001; ns, not significant).
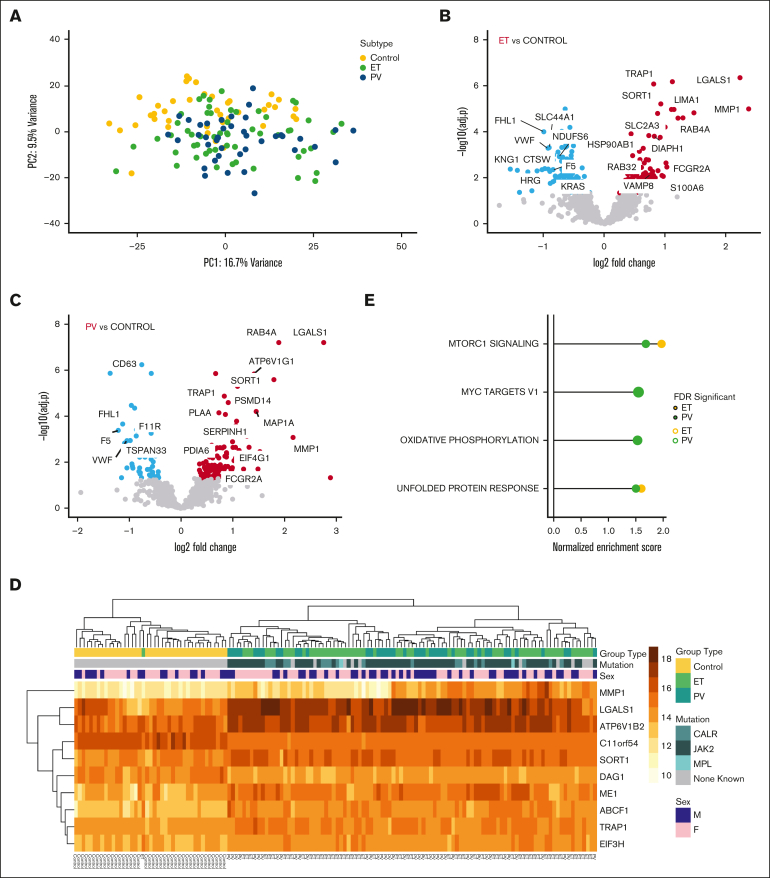
MPN platelet proteome distinguishes disease phenotype. (A) Unsupervised principal component analysis of normalized platelet protein expression adjusted for age, sex, treatment (antiplatelet and cytoreduction), and experimental batch. PC1 and PC2 colored by MPN subtype; and each contrasted with controls (n = 40, yellow): ET (n = 59, light green), PV (n = 41, blue). The first 2 principal components account for 26% of total variance in the data. (B-C) Volcano plots (2 panels of ET, PV) of differential protein expression showing log2 fold change vs statistical significance (negative log10 of P values) of each gene. Significant upregulated and downregulated genes are those with P values (false discovery rate [FDR]) ≤.05 and absolute value of fold changes ≥1.5. (D) Hierarchically clustered heat map of the top 10 differentially expressed proteins (FDR <0.01) from control vs MPN patient samples. Colored annotation is provided to indicate MPN subtype, mutation status, and sex. Rows indicate gradation in expression on a yellow (low) to orange (high) scale. Columns indicate sample type from controls, ET, and PV. (E) Pathway-enrichment analysis of proteins with MPN subtype–specific expression (color indicated; yellow ET, and light green PV). Each point represents a pathway; the x-axis gives the normalized enrichment score, which reflects the degree to which each pathway is overrepresented at the top of the ranked list of differentially expressed proteins, normalized to account for differences in gene set size and in correlations between gene sets and the expression data set. The y-axis lists the detail-level node of the most enriched pathways; solid lines mark gene set enrichment analysis–recommended Bonferroni-corrected statistical significance criterion of FDR <0.25 for exploratory analyses.
References
-
- Shi D, Shi H, Liu X, et al. Variables associated with patient-reported outcomes in patients with myeloproliferative neoplasms. Leuk Lymphoma. 2021;62(11):2703–2715. - PubMed
-
- Falanga A, Marchetti M. Thrombotic disease in the myeloproliferative neoplasms. Hematology Am Soc Hematol Educ Program. 2012;2012:571–581. - PubMed
Publication types
MeSH terms
Substances
Grants and funding
LinkOut - more resources
Full Text Sources
