

HTS384 NCI60: The Next Phase of the NCI60 Screen
- PMID: 38861359
- PMCID: PMC11292194
- DOI: 10.1158/0008-5472.CAN-23-3031
HTS384 NCI60: The Next Phase of the NCI60 Screen
Abstract
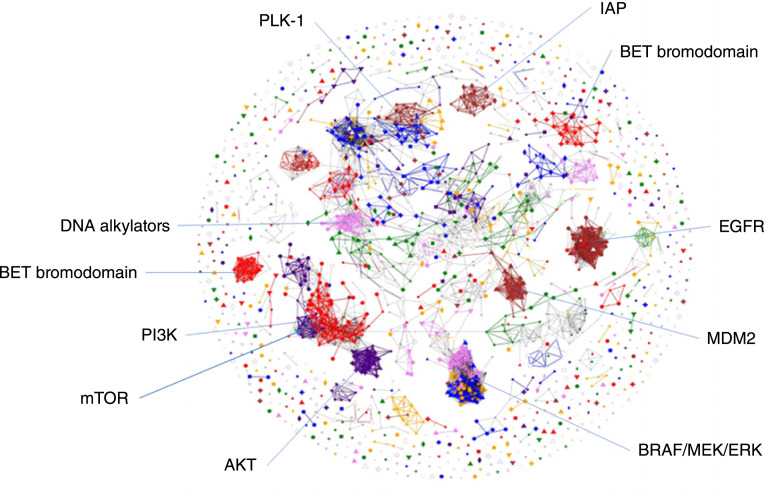
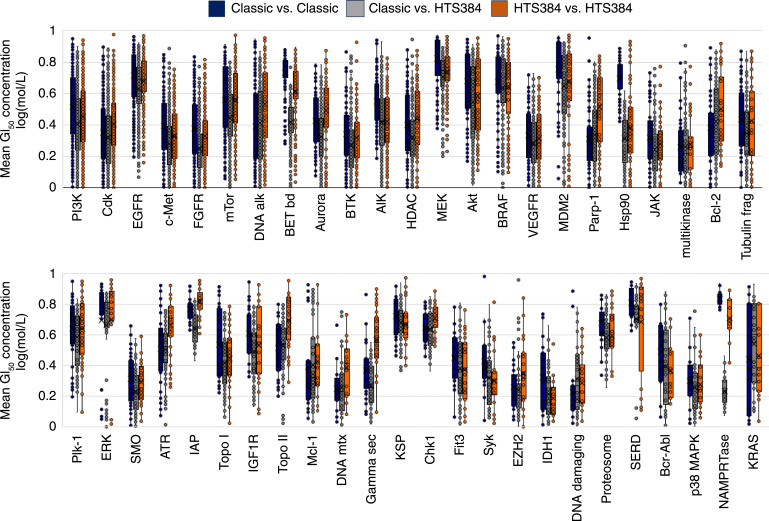
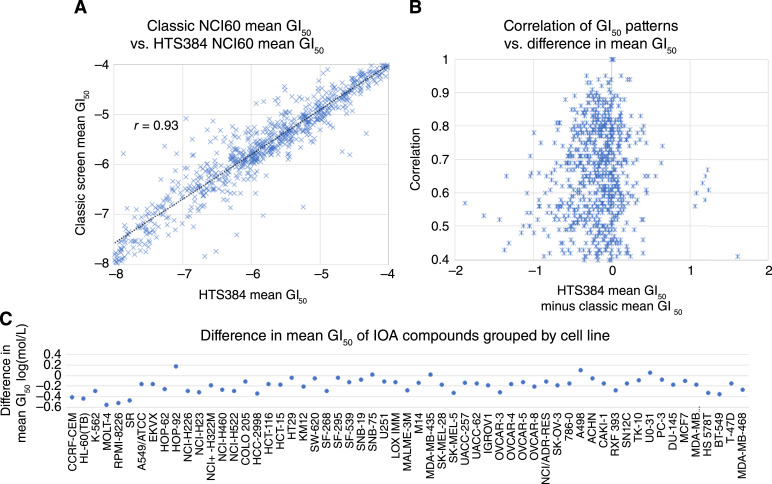
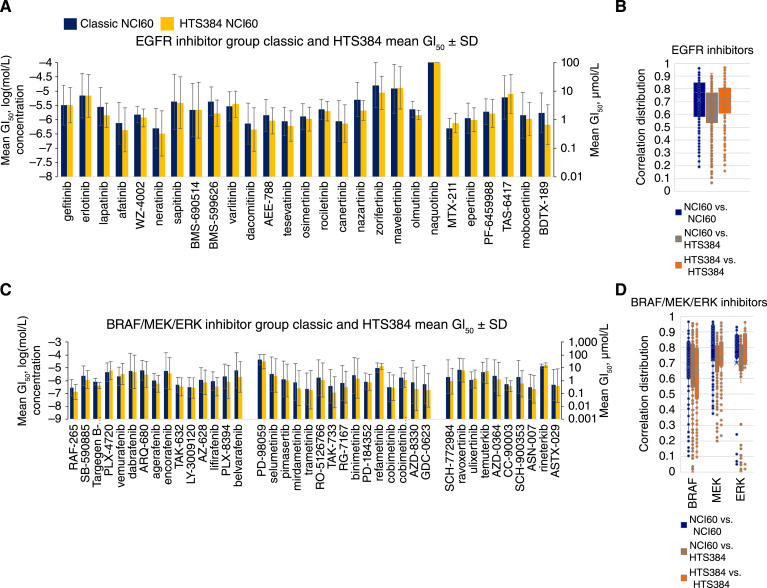
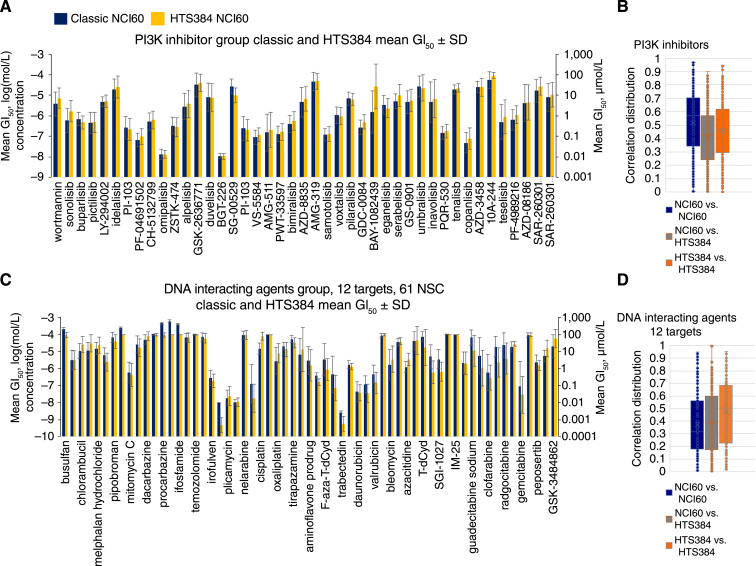
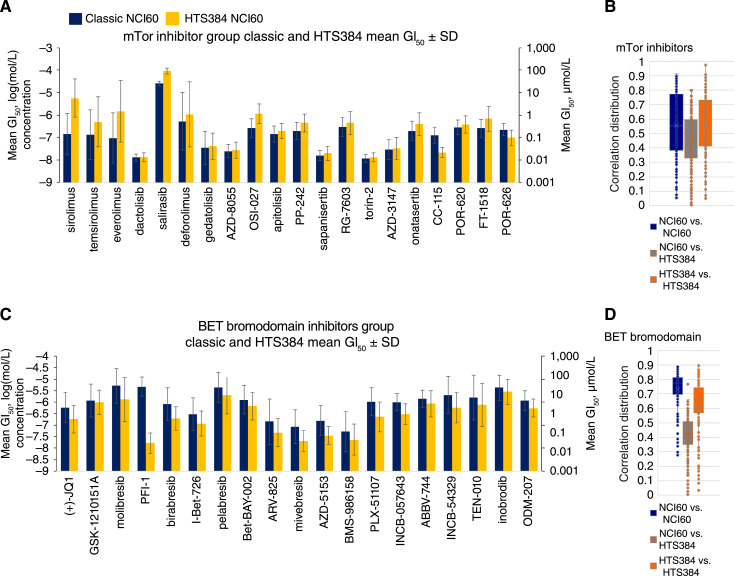
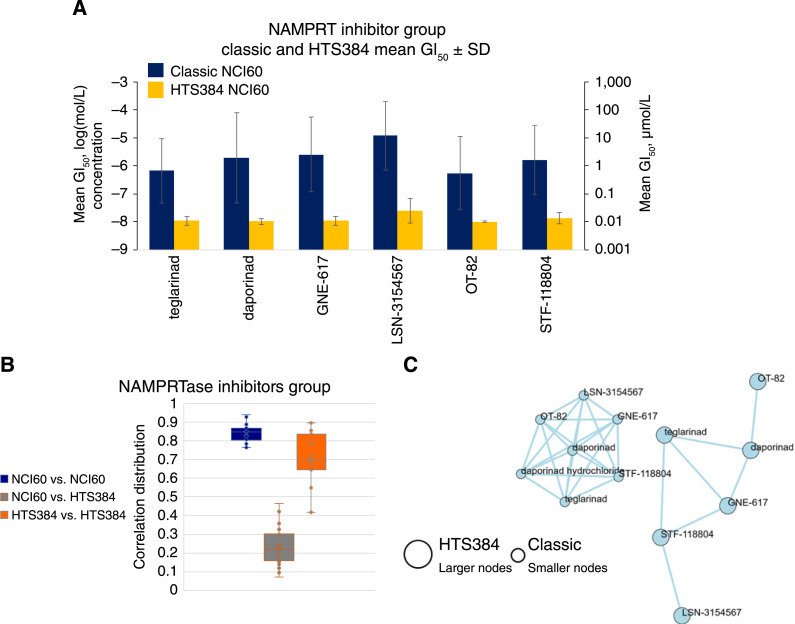
The NCI60 human tumor cell line screen has been in operation as a service to the cancer research community for more than 30 years. The screen operated with 96-well plates, a 2-day exposure period to test agents, and following cell fixation, a visible absorbance endpoint by the protein-staining dye sulforhodamine B. In this study, we describe the next phase of this important cancer research tool, the HTS384 NCI60 screen. Although the cell lines remain the same, the updated screen is performed with 384-well plates, a 3-day exposure period to test agents, and a luminescent endpoint to measure cell viability based upon cellular ATP content. In this study, a library of 1,003 FDA-approved and investigational small-molecule anticancer agents was screened by the two NCI60 assays. The datasets were compared with a focus on targeted agents with at least six representatives in the library. For many agents, including inhibitors of EGFR, BRAF, MEK, ERK, and PI3K, the patterns of GI50 values were very similar between the screens with strong correlations between those patterns within the dataset from each screen. However, for some groups of targeted agents, including mTOR, BET bromodomain, and NAMPRTase inhibitors, there were limited or no correlations between the two datasets, although the patterns of GI50 values and correlations between those patterns within each dataset were apparent. Beginning in January 2024, the HTS384 NCI60 screen became the free screening service of the NCI to facilitate drug discovery by the cancer research community. Significance: The new NCI60 cell line screen HTS384 shows robust patterns of response to oncology agents and substantial overlap with the classic screen, providing an updated tool for studying therapeutic agents. See related commentary by Colombo and Corsello, p. 2397.
©2024 The Authors; Published by the American Association for Cancer Research.
Conflict of interest statement
No disclosures were reported.
Figures
Similar articles
-
Modernizing the NCI60 Cell Line Screen for Phenotypic Drug Discovery in the 21st Century.Cancer Res. 2024 Aug 1;84(15):2397-2399. doi: 10.1158/0008-5472.CAN-24-1506. Cancer Res. 2024. PMID: 39086314
-
Analysis of Food and Drug Administration-approved anticancer agents in the NCI60 panel of human tumor cell lines.Mol Cancer Ther. 2010 May;9(5):1451-60. doi: 10.1158/1535-7163.MCT-10-0106. Epub 2010 May 4. Mol Cancer Ther. 2010. PMID: 20442306 Free PMC article.
-
3D Models of the NCI60 Cell Lines for Screening Oncology Compounds.SLAS Discov. 2017 Jun;22(5):473-483. doi: 10.1177/2472555217697434. Epub 2017 Mar 13. SLAS Discov. 2017. PMID: 28288283
-
The NCI60 human tumour cell line anticancer drug screen.Nat Rev Cancer. 2006 Oct;6(10):813-23. doi: 10.1038/nrc1951. Nat Rev Cancer. 2006. PMID: 16990858 Review.
-
JFCR39, a panel of 39 human cancer cell lines, and its application in the discovery and development of anticancer drugs.Bioorg Med Chem. 2012 Mar 15;20(6):1947-51. doi: 10.1016/j.bmc.2012.01.017. Epub 2012 Jan 21. Bioorg Med Chem. 2012. PMID: 22336246 Review.
Cited by
-
CDK2 inhibitors: rationally directed discovery of a novel potent lead derived from cyclohepta[e]thieno[2,3-b]pyridine.RSC Med Chem. 2025 Jul 24. doi: 10.1039/d5md00346f. Online ahead of print. RSC Med Chem. 2025. PMID: 40823493 Free PMC article.
-
Antimicrobial bianthrones from the crinoid Heterometra sp.RSC Adv. 2024 Dec 2;14(51):38200-38207. doi: 10.1039/d4ra05594b. eCollection 2024 Nov 25. RSC Adv. 2024. PMID: 39624437 Free PMC article.
-
The Olive Oil Monophenolic Secoiridoid Ligstroside Aglycone Suppresses Melanoma Progression by Targeting the BRAF Signaling Pathway.Molecules. 2025 Jan 1;30(1):139. doi: 10.3390/molecules30010139. Molecules. 2025. PMID: 39795195 Free PMC article.
-
Standardized sulforhodamine b colorimetric cell proliferation assay for anticancer activity screening in educational and research laboratories.MethodsX. 2025 Jun 30;15:103469. doi: 10.1016/j.mex.2025.103469. eCollection 2025 Dec. MethodsX. 2025. PMID: 40687356 Free PMC article.
-
Antiproliferative cassaine diterpenoid amines from the leaves and twigs of the traditional Thai medicinal plant Erythrophleum teysmannii (Kurz) Craib.J Ethnopharmacol. 2025 Aug 29;352:120167. doi: 10.1016/j.jep.2025.120167. Epub 2025 Jun 25. J Ethnopharmacol. 2025. PMID: 40578407
References
-
- Shoemaker RH. The NCI60 human tumour cell line anticancer drug screen. Nat Rev Cancer 2006;6:813–23. - PubMed
-
- Monks A, Scudiero D, Skehan P, Shoemaker R, Paull K, Vistica D, et al. . Feasibility of a high-flux anticancer drug screen using a diverse panel of cultured human tumor cell lines. J Natl Cancer Inst 1991;83:757–66. - PubMed
-
- Paull KD, Shoemaker RH, Hodes L, Monks A, Scudiero DA, Rubinstein L, et al. . Display and analysis of patterns of differential activity of drugs against human tumor cell lines: development of mean graph and COMPARE algorithm. J Natl Cancer Inst 1989;81:1088–92. - PubMed
MeSH terms
Substances
Grants and funding
LinkOut - more resources
Full Text Sources
Research Materials
Miscellaneous
