. 2024 Aug 1;47(8):1424-1431.
doi: 10.2337/dc24-0198.

Data-Driven Phenotyping of Presymptomatic Type 1 Diabetes Using Longitudinal Autoantibody Profiles

Collaborators, Affiliations

Data-Driven Phenotyping of Presymptomatic Type 1 Diabetes Using Longitudinal Autoantibody Profiles

Mohamed Ghalwash et al. Diabetes Care. .

Abstract

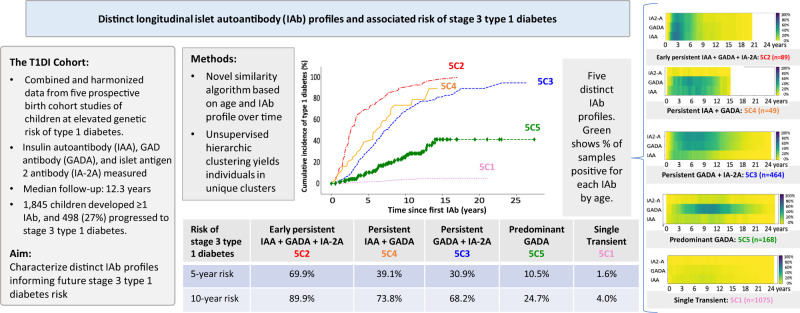
Objective: To characterize distinct islet autoantibody profiles preceding stage 3 type 1 diabetes.

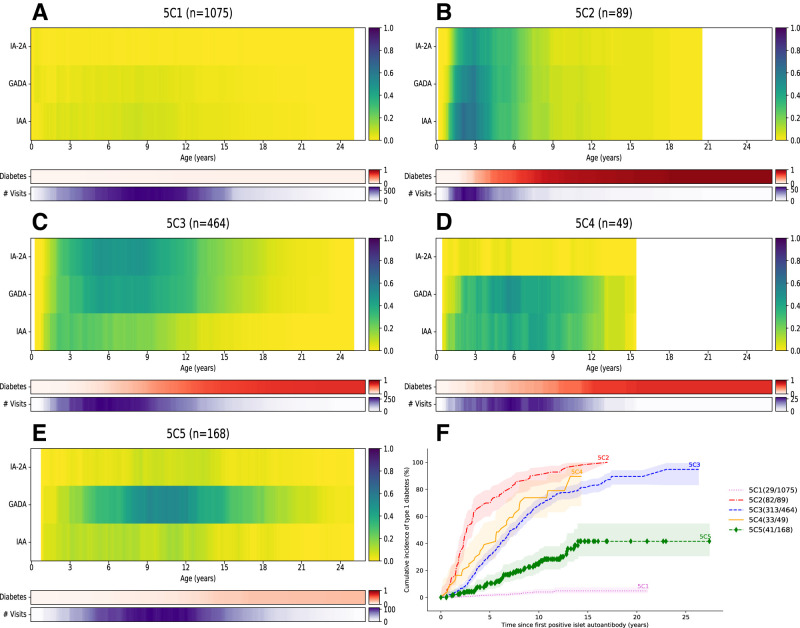
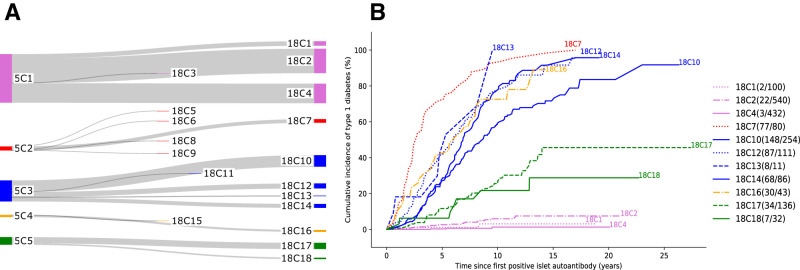
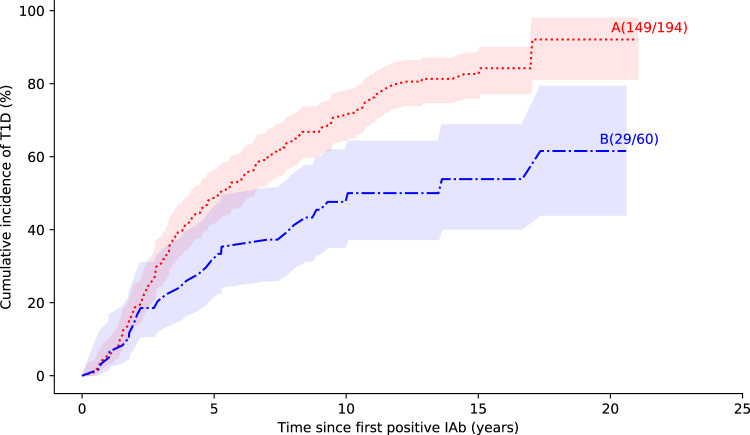
Research design and methods: The T1DI (Type 1 Diabetes Intelligence) study combined data from 1,845 genetically susceptible prospectively observed children who were positive for at least one islet autoantibody: insulin autoantibody (IAA), GAD antibody (GADA), or islet antigen 2 antibody (IA-2A). Using a novel similarity algorithm that considers an individual's temporal autoantibody profile, age at autoantibody appearance, and variation in the positivity of autoantibody types, we performed an unsupervised hierarchical clustering analysis. Progression rates to diabetes were analyzed via survival analysis.

Results: We identified five main clusters of individuals with distinct autoantibody profiles characterized by seroconversion age and sequence of appearance of the three autoantibodies. The highest 5-year risk from first positive autoantibody to type 1 diabetes (69.9%; 95% CI 60.0-79.2) was observed in children who first developed IAA in early life (median age 1.6 years) followed by GADA (1.9 years) and then IA-2A (2.1 years). Their 10-year risk was 89.9% (95% CI 81.9-95.4). A high 5-year risk was also found in children with persistent IAA and GADA (39.1%) and children with persistent GADA and IA-2A (30.9%). A lower 5-year risk (10.5%) was observed in children with a late appearance of persistent GADA (6.1 years). The lowest 5-year diabetes risk (1.6%) was associated with positivity for a single, often reverting, autoantibody.

Conclusions: The novel clustering algorithm identified children with distinct islet autoantibody profiles and progression rates to diabetes. These results are useful for prediction, selection of individuals for prevention trials, and studies investigating various pathways to type 1 diabetes.


Conflict of interest statement

Duality of Interest. M.G., V.A., and K.N. are employees of IBM. J.L.D. performed this work as an employee of JDRF and is now an employee of Sanofi. O.L. is an employee of JDRF. No other potential conflicts of interest relevant to this article were reported.

Figures

None
Graphical abstract
Figure 1
Figure 1
Distinct longitudinal IAb profiles and associated risk of stage 3 type 1 diabetes. AE: Longitudinal patterns of the three islet autoantibodies (IAA, GADA, and IA-2A, shown on x-axis of each panel) in the five clusters of children with distinct dynamics of IA. Age (years) is shown on x-axis. Green indicates fraction of positivity for each antibody across all measurements at each age (dark green indicates mostly positive samples, light green indicates that only a small proportion of samples were positive, and yellow shows that samples measured at corresponding age were negative). Middle section in each panel (Diabetes) shows in red the cumulative proportion of children progressing to stage 3 type 1 diabetes. For example, light red color in B (cluster 5C2) indicates that children start to progress to diabetes from age ∼2 years, and dark red shows that most of them progress to diabetes during follow-up. Similarly, bottom section in each panel (#Visits) shows in purple the number of measurements collected at each age. F: Cumulative incidence of stage 3 type 1 diabetes (% with 95% CI) for the five clusters of children with distinct IAb patterns discovered by the novel clustering algorithm. Number of individuals progressing to type 1 diabetes and total number of participants in each cluster are reported for each curve.
Figure 2
Figure 2
Evolution of 18 subclusters from the five main clusters of children with distinct patterns of IA. A: Evolution from the five main clusters with distinct color codes to 18 subclusters. B: Cumulative incidence of stage 3 type 1 diabetes (%) for 11 subclusters with distinct IAb patterns discovered by the novel clustering algorithm. Red indicates subcluster 18C7, which represents a majority of individuals from cluster 5C2 and has the highest risk of progression to type 1 diabetes. Blue represents subclusters 18C10, 18C12, 18C13, and 18C14, which are associated with high risk of progression. Similarly, yellow represents subcluster 18C16 and is also linked to high risk of progression. Green depicts subclusters 18C17 and 18C18, with intermediate risk of progression. Purple indicates three subclusters with positivity for single autoantibody and associated low risk of progression. Data for seven subclusters that included <10 children are not included. Number of individuals progressing to type 1 diabetes and total number of individuals in each subcluster are reported for each curve.
Figure 3
Figure 3
Cumulative incidence of type 1 diabetes (T1D; % with 95% CI) for children who seroconverted before age 2 years and developed positivity for two or more islet autoantibodies. Red (group A; n = 194) represents children with IAA positivity in first positive sample. Blue (group B; n = 60) represents children who were negative for IAA in first positive sample. Progression rates were significantly different between groups A and B (log-rank test P = 0.0002). For group A, 5-year diabetes risk was 48.5% (95% CI 41.6–55.8), and 10-year risk was 71.3% (95% CI 64.5–77.8). For group B, 5-year diabetes risk was 31.5% (95% CI 21.1–45.3), and 10-year risk was 47.6% (95% CI 35.2–61.8).

References

    1. Ziegler AG, Rewers M, Simell O, et al. . Seroconversion to multiple islet autoantibodies and risk of progression to diabetes in children. JAMA 2013;309:2473–2479 - PMC - PubMed
    1. Gorus FK, Balti EV, Messaaoui A, et al. .; Belgian Diabetes Registry . Twenty-year progression rate to clinical onset according to autoantibody profile, age, and HLA-DQ genotype in a registry-based group of children and adults with a first-degree relative with type 1 diabetes. Diabetes Care 2017;40:1065–1072 - PubMed
    1. Insel RA, Dunne JL, Atkinson MA, et al. . Staging presymptomatic type 1 diabetes: a scientific statement of JDRF, the Endocrine Society, and the American Diabetes Association. Diabetes Care 2015;38:1964–1974 - PMC - PubMed
    1. Bauer W, Veijola R, Lempainen J, et al. . Age at seroconversion, HLA genotype, and specificity of autoantibodies in progression of islet autoimmunity in childhood. J Clin Endocrinol Metab 2019;104:4521–4530 - PubMed
    1. Bingley PJ, Wherrett DK, Shultz A, Rafkin LE, Atkinson MA, Greenbaum CJ. Type 1 Diabetes TrialNet: a multifaceted approach to bringing disease-modifying therapy to clinical use in type 1 diabetes. Diabetes Care 2018;41:653–661 - PMC - PubMed