

Systems genetics uncover new loci containing functional gene candidates in Mycobacterium tuberculosis-infected Diversity Outbred mice
- PMID: 38861581
- PMCID: PMC11195971
- DOI: 10.1371/journal.ppat.1011915
Systems genetics uncover new loci containing functional gene candidates in Mycobacterium tuberculosis-infected Diversity Outbred mice
Abstract
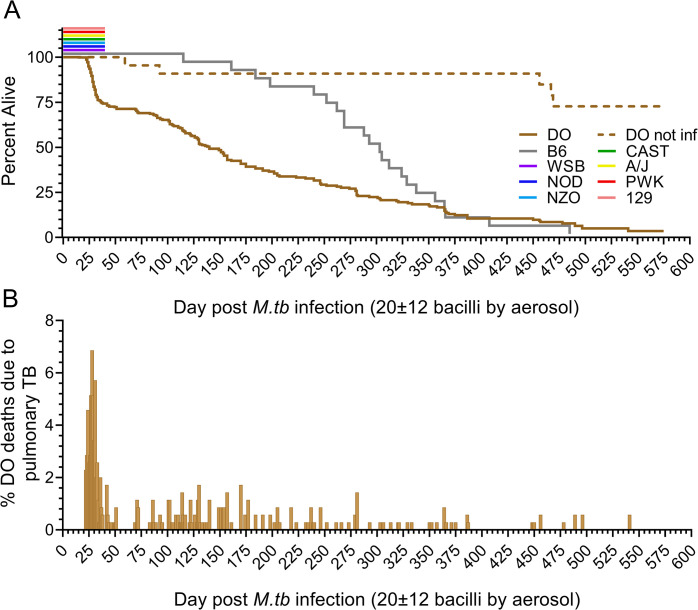
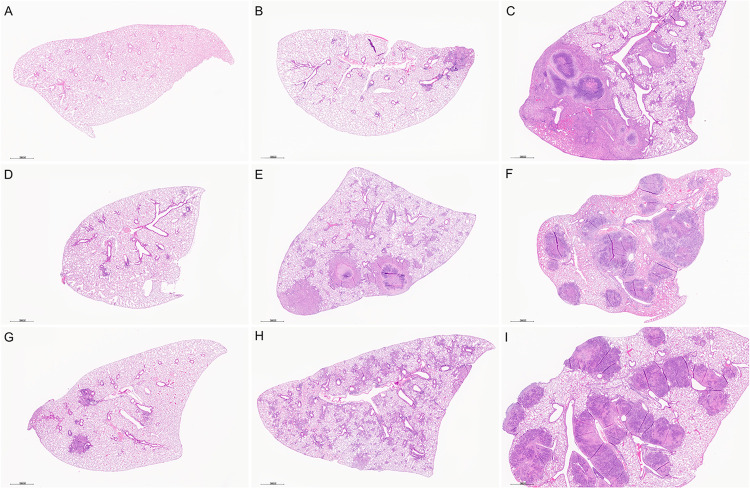
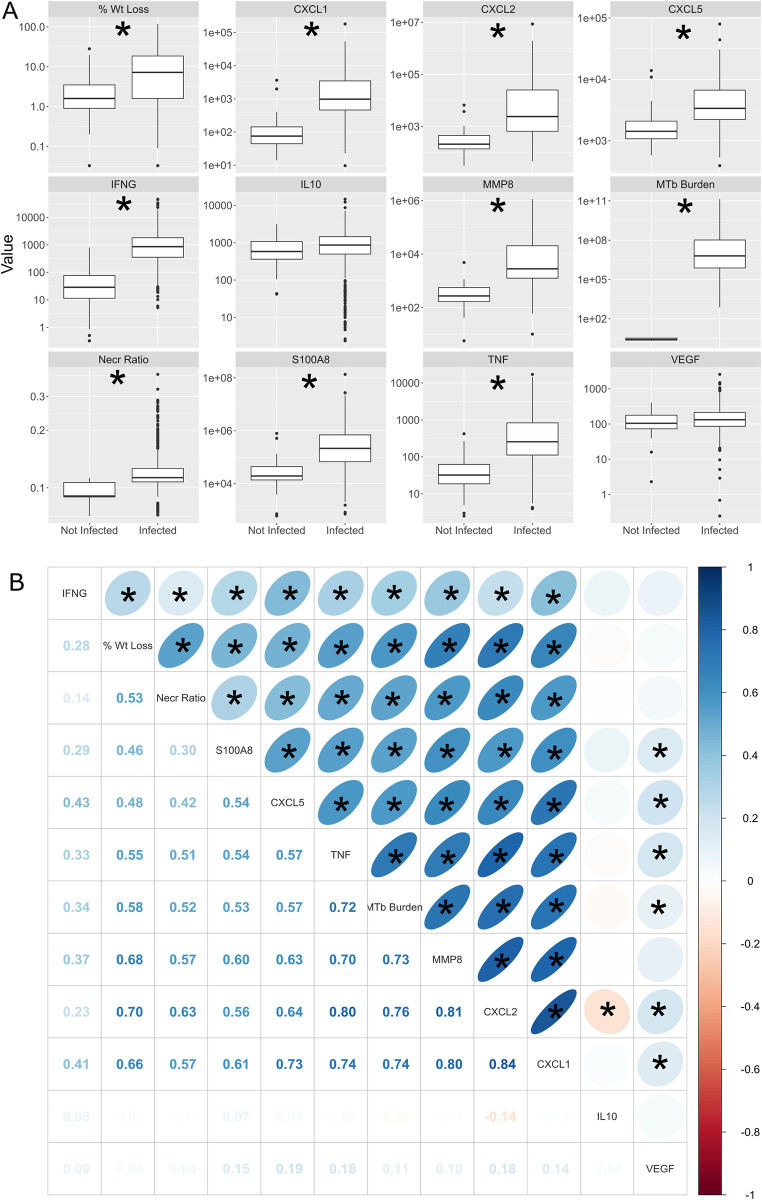
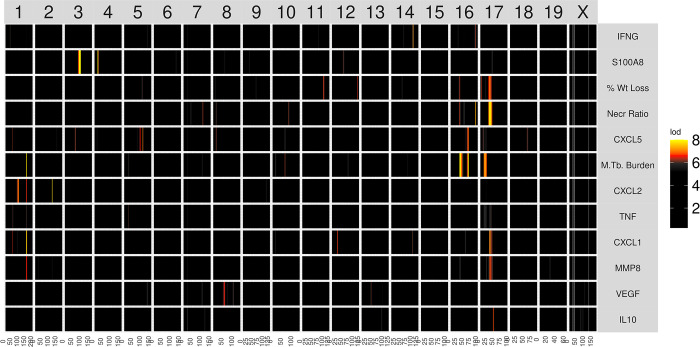
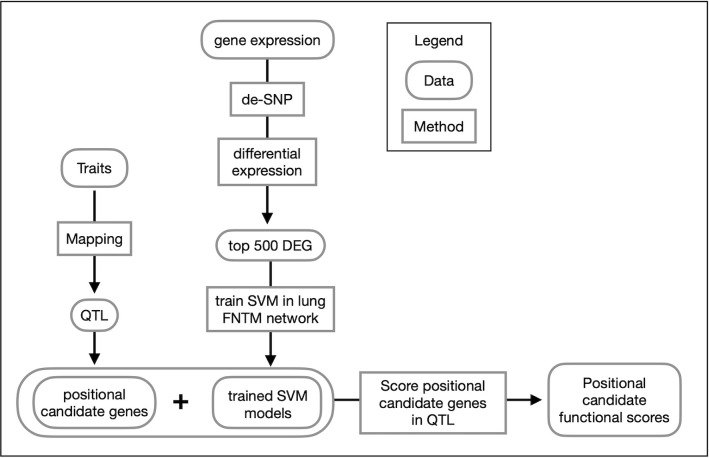
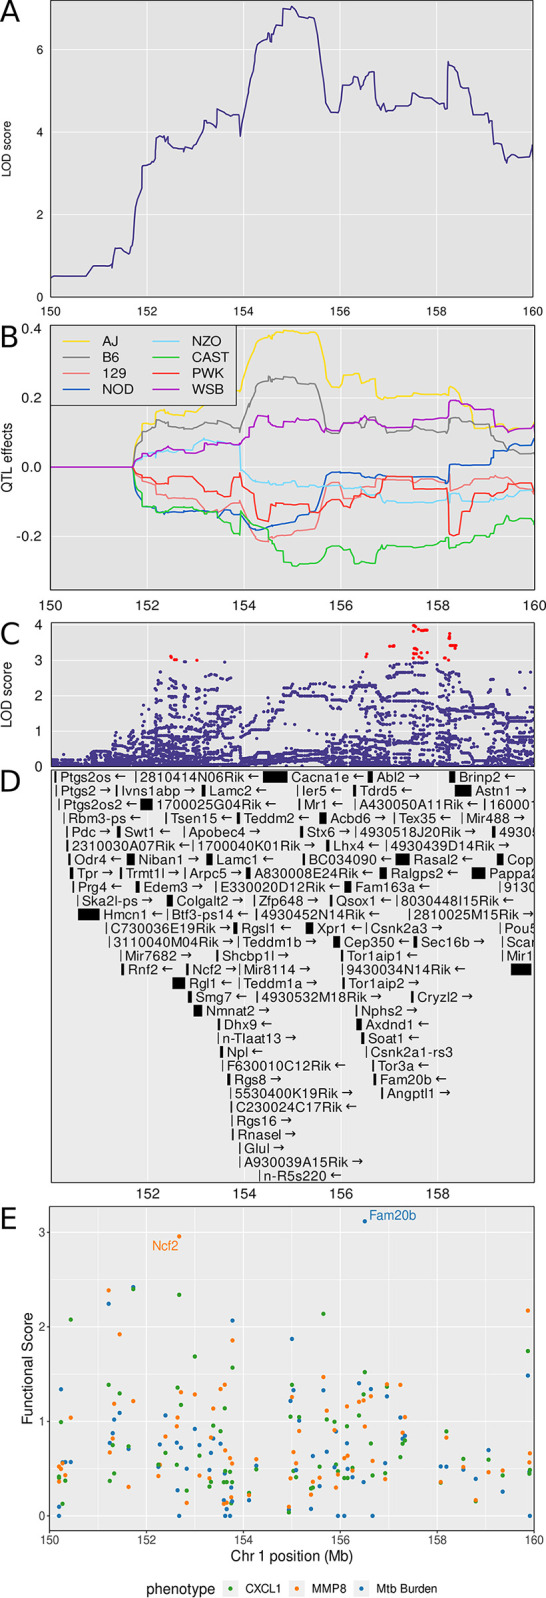
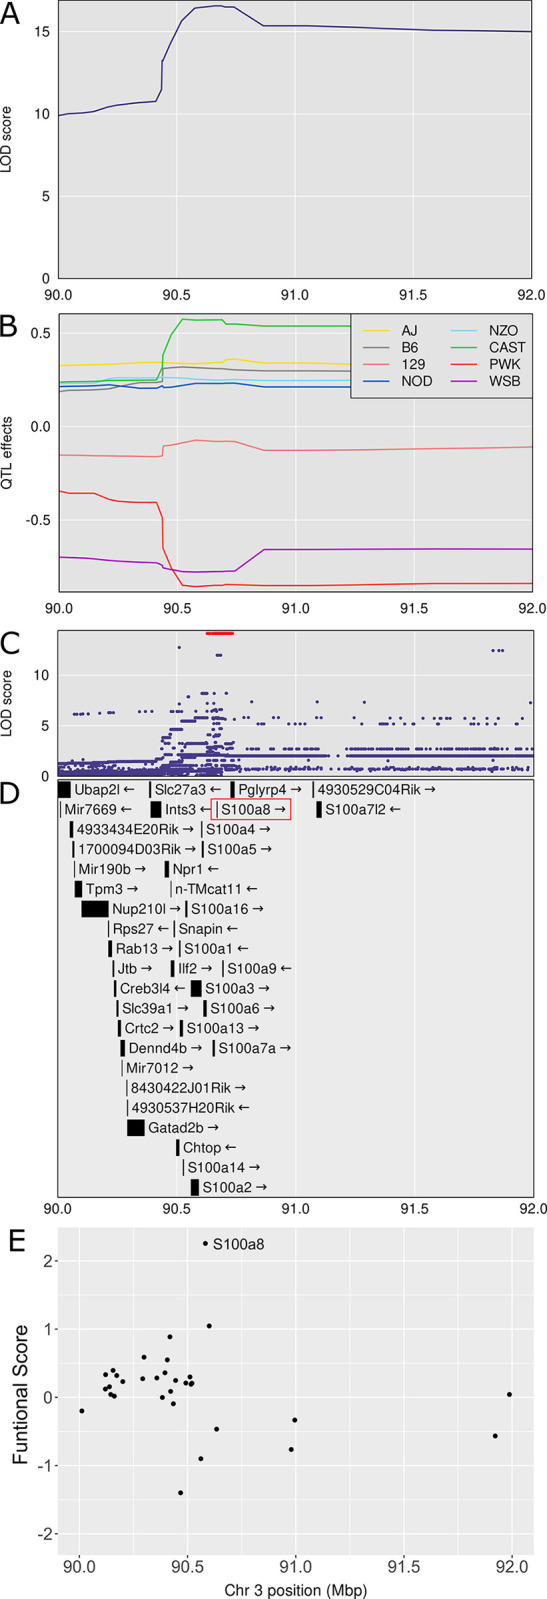
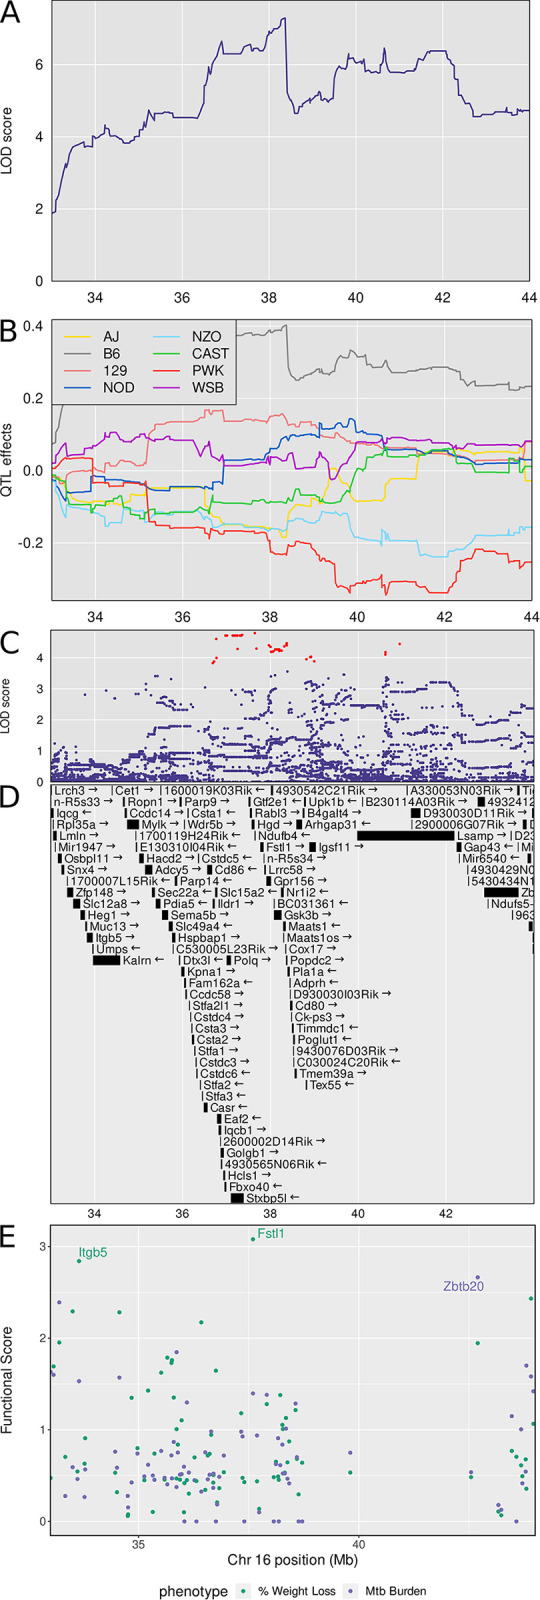
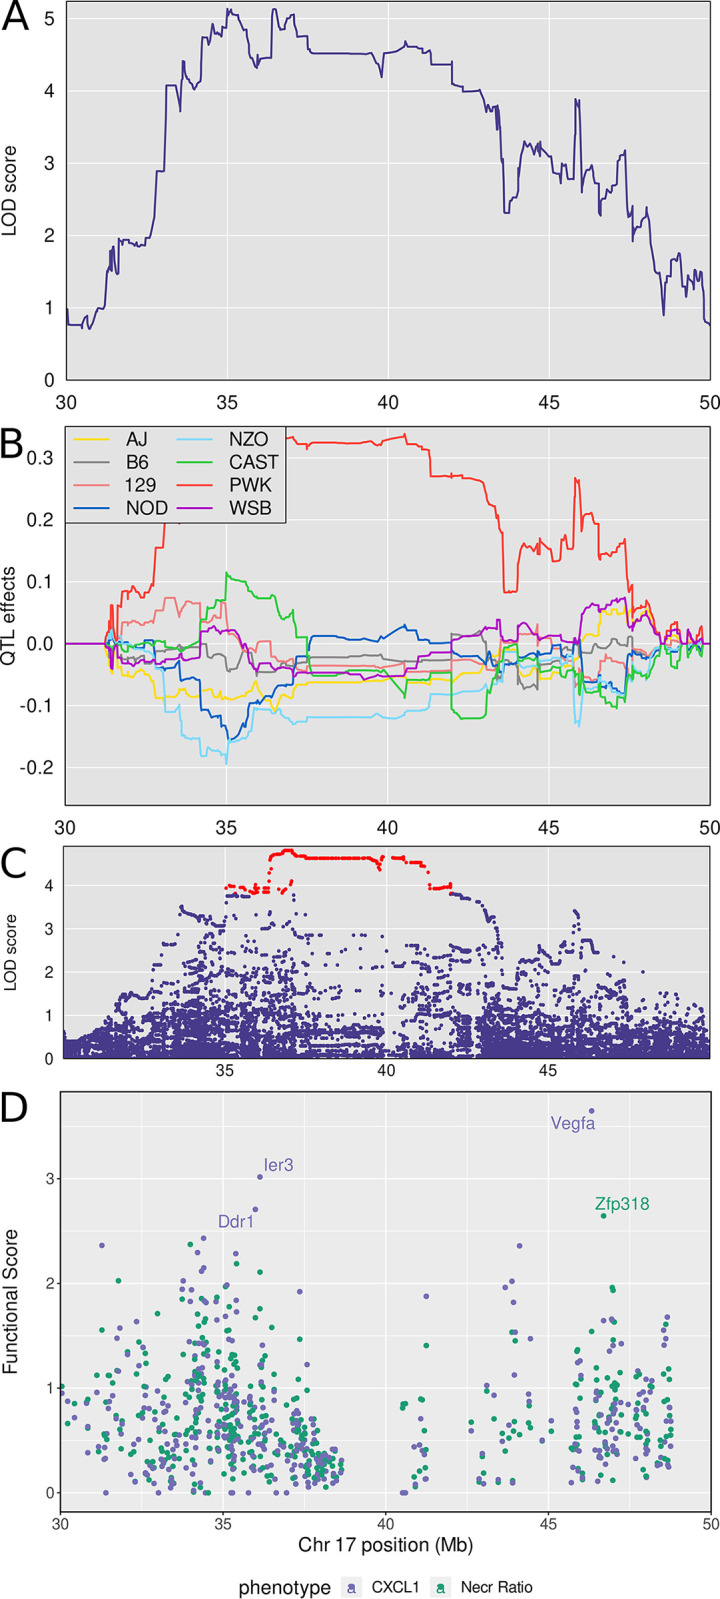
Mycobacterium tuberculosis infects two billion people across the globe, and results in 8-9 million new tuberculosis (TB) cases and 1-1.5 million deaths each year. Most patients have no known genetic basis that predisposes them to disease. Here, we investigate the complex genetic basis of pulmonary TB by modelling human genetic diversity with the Diversity Outbred mouse population. When infected with M. tuberculosis, one-third develop early onset, rapidly progressive, necrotizing granulomas and succumb within 60 days. The remaining develop non-necrotizing granulomas and survive longer than 60 days. Genetic mapping using immune and inflammatory mediators; and clinical, microbiological, and granuloma correlates of disease identified five new loci on mouse chromosomes 1, 2, 4, 16; and three known loci on chromosomes 3 and 17. Further, multiple positively correlated traits shared loci on chromosomes 1, 16, and 17 and had similar patterns of allele effects, suggesting these loci contain critical genetic regulators of inflammatory responses to M. tuberculosis. To narrow the list of candidate genes, we used a machine learning strategy that integrated gene expression signatures from lungs of M. tuberculosis-infected Diversity Outbred mice with gene interaction networks to generate scores representing functional relationships. The scores were used to rank candidates for each mapped trait, resulting in 11 candidate genes: Ncf2, Fam20b, S100a8, S100a9, Itgb5, Fstl1, Zbtb20, Ddr1, Ier3, Vegfa, and Zfp318. Although all candidates have roles in infection, inflammation, cell migration, extracellular matrix remodeling, or intracellular signaling, and all contain single nucleotide polymorphisms (SNPs), SNPs in only four genes (S100a8, Itgb5, Fstl1, Zfp318) are predicted to have deleterious effects on protein functions. We performed methodological and candidate validations to (i) assess biological relevance of predicted allele effects by showing that Diversity Outbred mice carrying PWK/PhJ alleles at the H-2 locus on chromosome 17 QTL have shorter survival; (ii) confirm accuracy of predicted allele effects by quantifying S100A8 protein in inbred founder strains; and (iii) infection of C57BL/6 mice deficient for the S100a8 gene. Overall, this body of work demonstrates that systems genetics using Diversity Outbred mice can identify new (and known) QTLs and functionally relevant gene candidates that may be major regulators of complex host-pathogens interactions contributing to granuloma necrosis and acute inflammation in pulmonary TB.
Copyright: © 2024 Gatti et al. This is an open access article distributed under the terms of the Creative Commons Attribution License, which permits unrestricted use, distribution, and reproduction in any medium, provided the original author and source are credited.
Conflict of interest statement
The authors have declared that no competing interests exist.
Figures
Update of
-
Systems genetics uncover new loci containing functional gene candidates in Mycobacterium tuberculosis-infected Diversity Outbred mice.bioRxiv [Preprint]. 2023 Dec 22:2023.12.21.572738. doi: 10.1101/2023.12.21.572738. bioRxiv. 2023. Update in: PLoS Pathog. 2024 Jun 11;20(6):e1011915. doi: 10.1371/journal.ppat.1011915. PMID: 38187647 Free PMC article. Updated. Preprint.
Similar articles
-
Systems genetics uncover new loci containing functional gene candidates in Mycobacterium tuberculosis-infected Diversity Outbred mice.bioRxiv [Preprint]. 2023 Dec 22:2023.12.21.572738. doi: 10.1101/2023.12.21.572738. bioRxiv. 2023. Update in: PLoS Pathog. 2024 Jun 11;20(6):e1011915. doi: 10.1371/journal.ppat.1011915. PMID: 38187647 Free PMC article. Updated. Preprint.
-
Multiple genetic loci influence vaccine-induced protection against Mycobacterium tuberculosis in genetically diverse mice.PLoS Pathog. 2024 Mar 7;20(3):e1012069. doi: 10.1371/journal.ppat.1012069. eCollection 2024 Mar. PLoS Pathog. 2024. PMID: 38452145 Free PMC article.
-
B cells in perivascular and peribronchiolar granuloma-associated lymphoid tissue and B-cell signatures identify asymptomatic Mycobacterium tuberculosis lung infection in Diversity Outbred mice.Infect Immun. 2024 Jul 11;92(7):e0026323. doi: 10.1128/iai.00263-23. Epub 2024 Jun 20. Infect Immun. 2024. PMID: 38899881 Free PMC article.
-
QTL mapping in outbred populations: successes and challenges.Physiol Genomics. 2014 Feb 1;46(3):81-90. doi: 10.1152/physiolgenomics.00127.2013. Epub 2013 Dec 10. Physiol Genomics. 2014. PMID: 24326347 Free PMC article. Review.
-
Immunological roads diverged: mapping tuberculosis outcomes in mice.Trends Microbiol. 2025 Jan;33(1):15-33. doi: 10.1016/j.tim.2024.06.007. Epub 2024 Jul 20. Trends Microbiol. 2025. PMID: 39034171 Review.
Cited by
-
The chosen few: Mycobacterium tuberculosis isolates for IMPAc-TB.Front Immunol. 2024 Oct 28;15:1427510. doi: 10.3389/fimmu.2024.1427510. eCollection 2024. Front Immunol. 2024. PMID: 39530100 Free PMC article. Review.
-
Using host and bacterial genetic approaches to define virulence strategies and protective immunity during Mycobacterium tuberculosis infection.mSphere. 2025 May 27;10(5):e0051724. doi: 10.1128/msphere.00517-24. Epub 2025 Apr 22. mSphere. 2025. PMID: 40261010 Free PMC article. Review.
-
The Impact of Animal Models and Strain Standardization on the Evaluation of Tuberculosis Vaccine Efficacy.Vaccines (Basel). 2025 Jun 21;13(7):669. doi: 10.3390/vaccines13070669. Vaccines (Basel). 2025. PMID: 40733646 Free PMC article. Review.
References
-
- WHO. 14.9 million excess deaths associated with the COVID-19 pandemic in 2020 and 2021 2022. [updated 5/5/2022. Available from: https://www.who.int/news/item/05-05-2022-14.9-million-excess-deaths-were....
-
- Organization WH. Global tuberculosis report 2021. Geneva, Switzerland: World Health Organization; 2021.
-
- WHO. Global Tuberculosis Report: Multidrug-/ rifampicin-resistant TB (MDR/RR-TB):Update 2017. 2017.
-
- WHO. Global Tuberculosis Report. 2013.
MeSH terms
Grants and funding
LinkOut - more resources
Full Text Sources
Molecular Biology Databases
Miscellaneous
