. 2024 Jun 18;121(25):e2310793121.
doi: 10.1073/pnas.2310793121. Epub 2024 Jun 11.

Unconventional mechanism of action and resistance to rapalogs in renal cancer

Affiliations

Unconventional mechanism of action and resistance to rapalogs in renal cancer

Juan Yang et al. Proc Natl Acad Sci U S A. .

Abstract

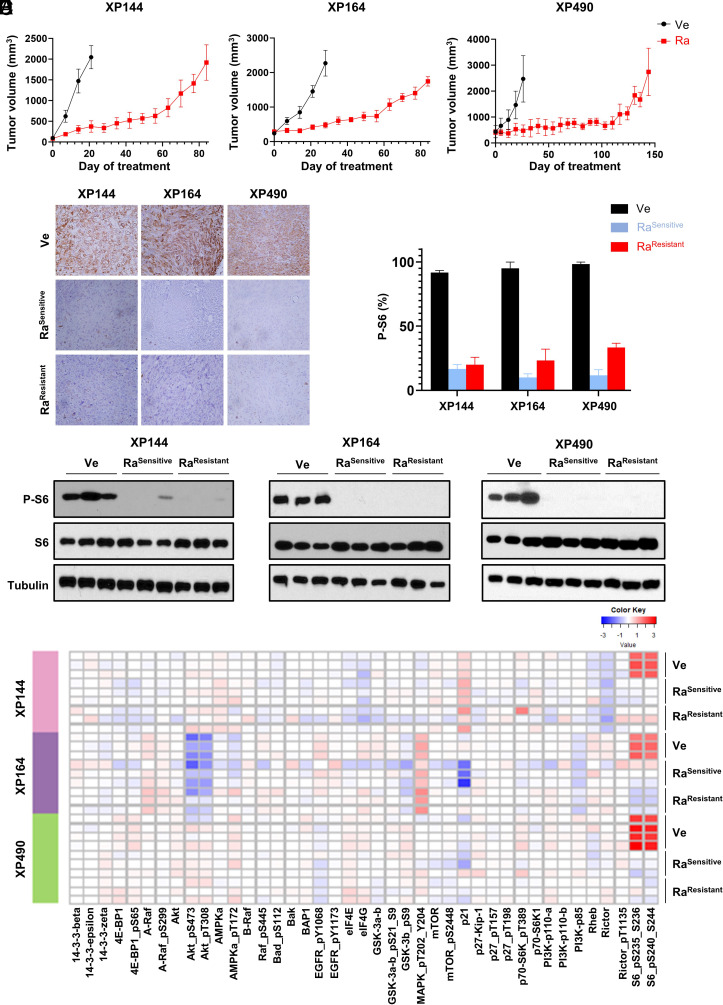
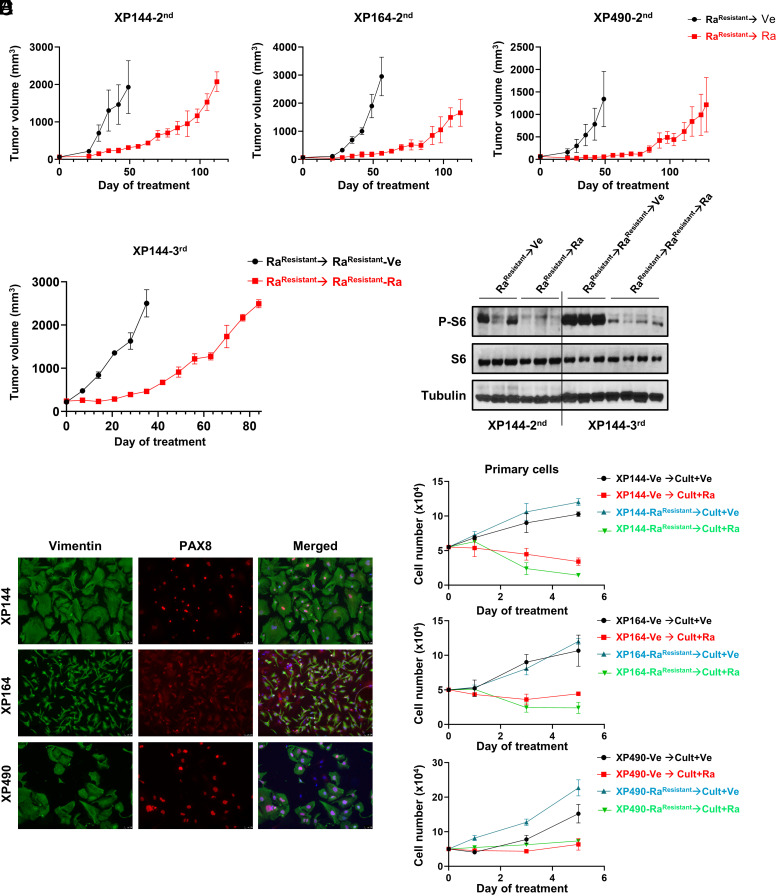
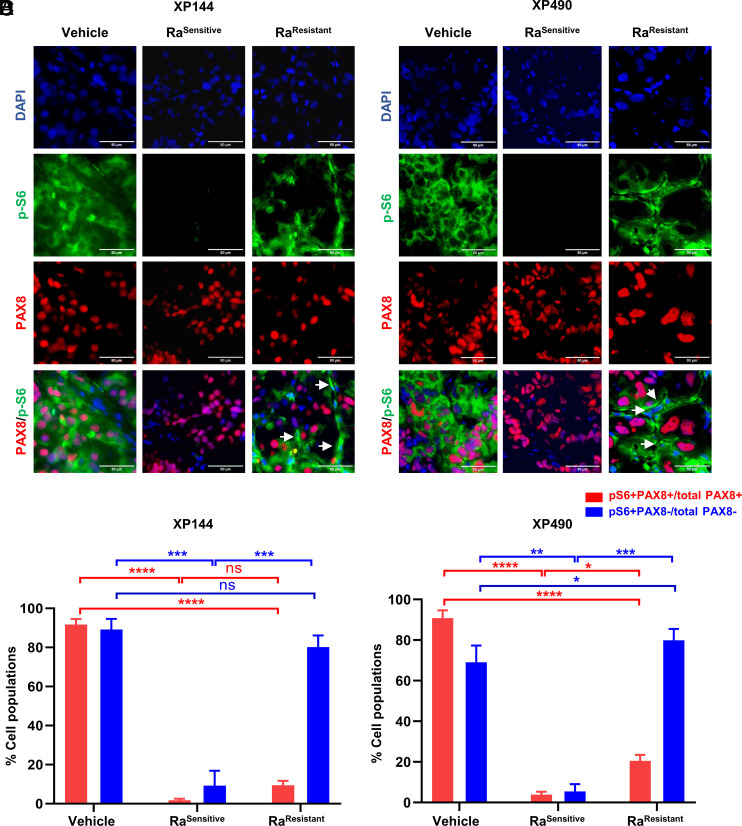
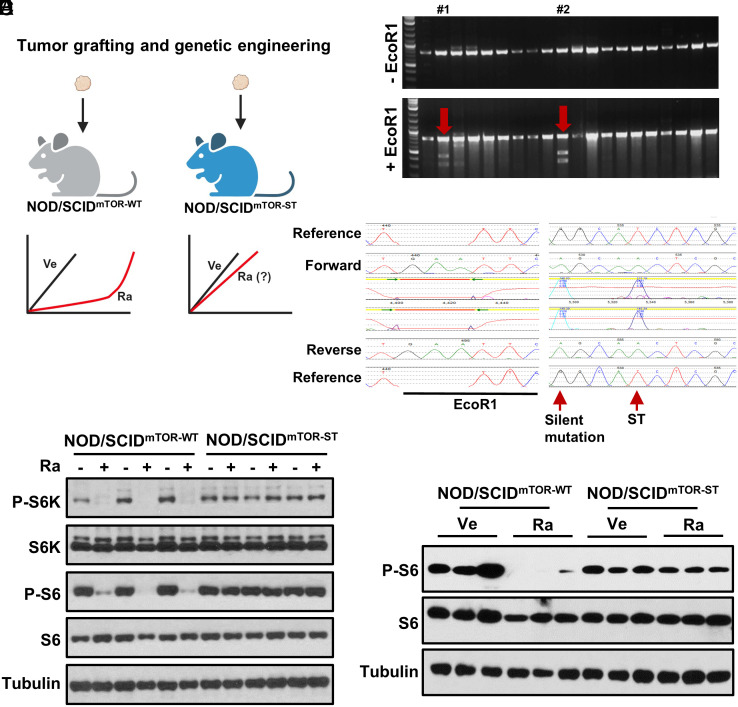
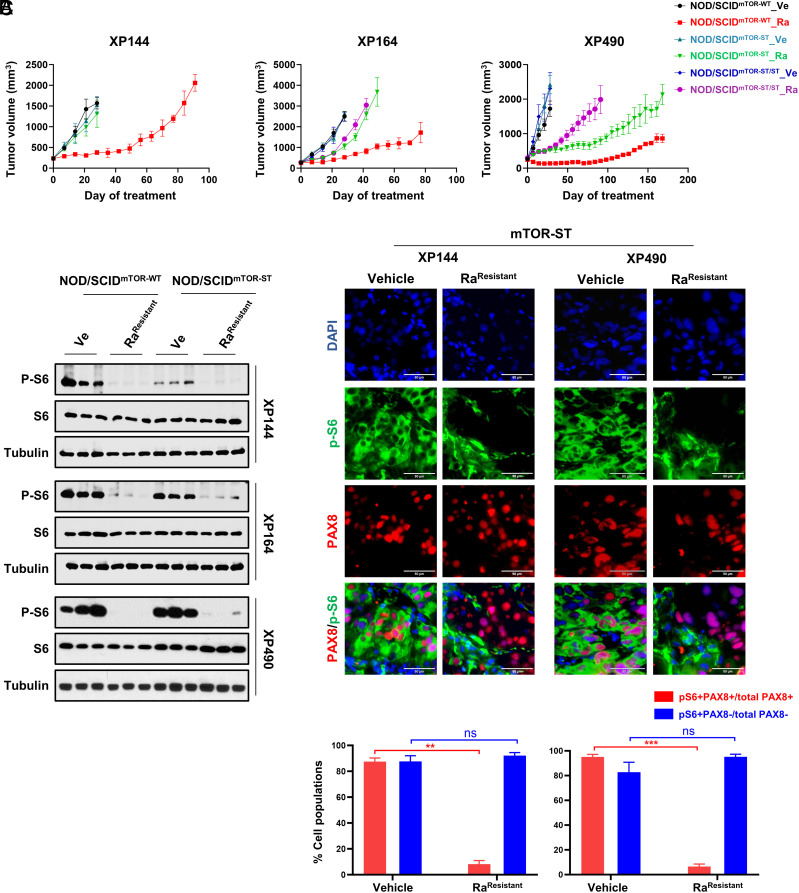
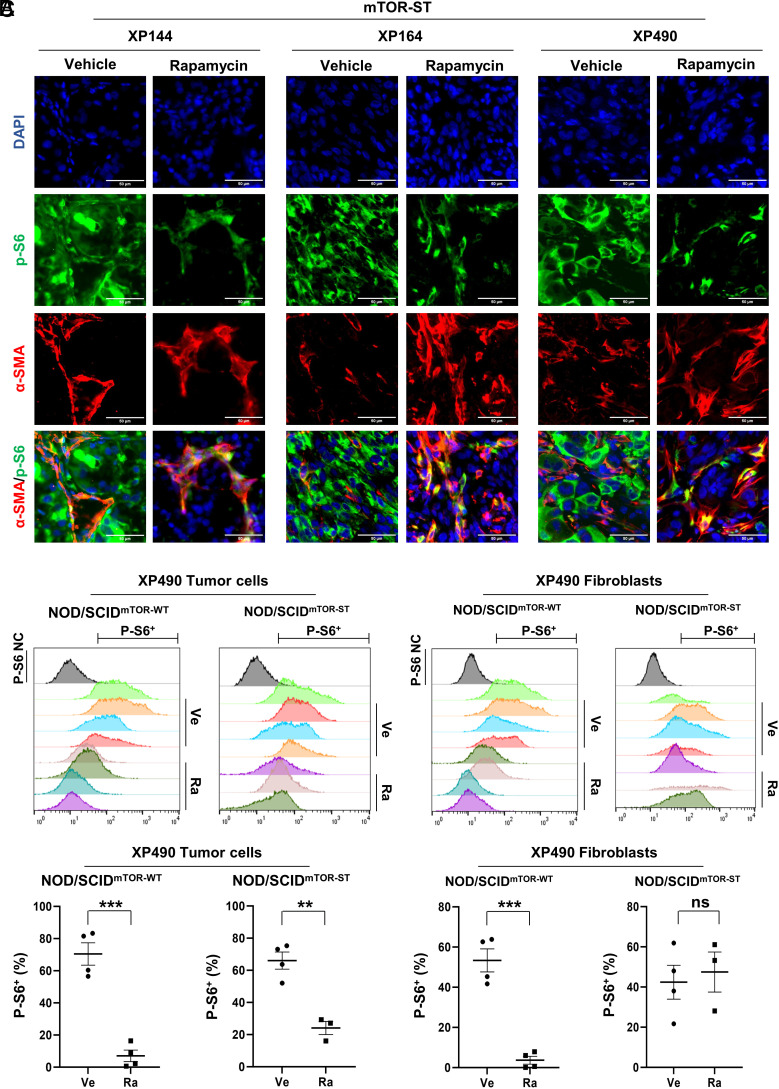
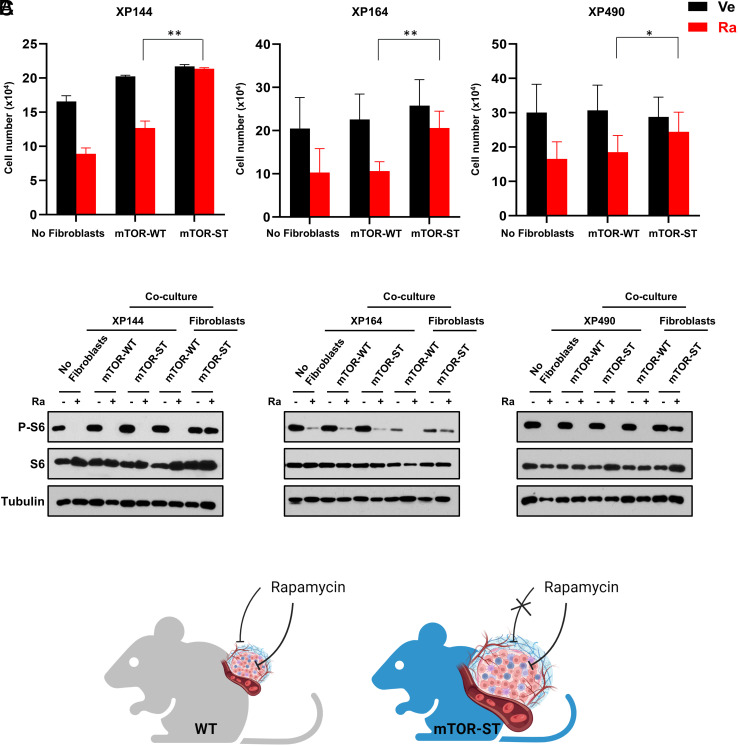
mTORC1 is aberrantly activated in renal cell carcinoma (RCC) and is targeted by rapalogs. As for other targeted therapies, rapalogs clinical utility is limited by the development of resistance. Resistance often results from target mutation, but mTOR mutations are rarely found in RCC. As in humans, prolonged rapalog treatment of RCC tumorgrafts (TGs) led to resistance. Unexpectedly, explants from resistant tumors became sensitive both in culture and in subsequent transplants in mice. Notably, resistance developed despite persistent mTORC1 inhibition in tumor cells. In contrast, mTORC1 became reactivated in the tumor microenvironment (TME). To test the role of the TME, we engineered immunocompromised recipient mice with a resistance mTOR mutation (S2035T). Interestingly, TGs became resistant to rapalogs in mTORS2035T mice. Resistance occurred despite mTORC1 inhibition in tumor cells and could be induced by coculturing tumor cells with mutant fibroblasts. Thus, enforced mTORC1 activation in the TME is sufficient to confer resistance to rapalogs. These studies highlight the importance of mTORC1 inhibition in nontumor cells for rapalog antitumor activity and provide an explanation for the lack of mTOR resistance mutations in RCC patients.

Keywords: Cancer-associated fibroblasts (CAFs); everolimus; kinase inhibitors; patient-derived xenograft (PDX); temsirolimus.


Conflict of interest statement

Competing interests statement:A patent application has been filed pertaining to aspects of this work.

Figures

Fig. 1.
Fig. 1.
Prolonged rapamycin treatment results in acquired resistance despite persistent mTORC1 inhibition in tumor cells. (A) Growth curves of subcutaneously implanted TGs (XP144, XP164, and XP490) in NOD/SCID mice treated with vehicle (Ve) or rapamycin (Ra). The error bars indicate SEM (n ≥ 3 per condition). (B) Representative phospho-S6 immunohistochemistry images of TGs from vehicle-treated (Ve) mice or mice treated with rapamycin collected while TGs were sensitive (~day 28) (RaSensitive) and after development of resistance (RaResistant). (C) Quantitation of the results shown in (B). The error bars indicate SEM (n = 3 per condition). (D) Western blot analyses of mTORC1 pathway status of TGs from vehicle-treated mice or mice treated with rapamycin collected while TGs were sensitive (RaSensitive) and after development of resistance (RaResistant). For each condition, three different TGs are shown per TG line. p-S6 and S6 were from gels run in parallel with the same extracts. P-S6, phospho-S6 Ser240/244. (E) RPPAs of (phospho)protein levels of rapamycin-sensitive and rapamycin-resistant TGs compared with vehicle-treated tumors for each TG line. ANOVA with post hoc t tests was used to test for differential (phospho)protein levels between the three arms for each TG line, with FDR-adjusted P-values. Heatmap of selected (phospho) protein levels of TGs from vehicle-treated mice or mice treated with rapamycin collected while TGs were sensitive (RaSensitive) and after development of resistance (RaResistant).
Fig. 2.
Fig. 2.
Rapamycin resistance is reversible and lost with both subsequent transplantation and in cell culture. (A) TG growth curves following transplantation of rapamycin-resistant tumors to a new cohort of mice, which were treated with rapamycin (or vehicle) starting on the day of transplantation. The error bars indicate SEM (n ≥ 3 per condition). (B) Representative TG growth curve of rapamycin-resistant tumor transplanted into a third mouse cohort and treated with rapamycin (or vehicle) after tumors reached ~100 to ~300 mm3. The error bars indicate SEM (n ≥ 3 per condition). (C) Representative western blot of sequentially transplanted tumors in second and third cohorts (n ≥ 3 per condition). p-S6 and S6 were from gels run in parallel with the same extracts. P-S6, phospho-S6 Ser240/244. (D) Immunofluorescence staining of TG-harvested primary cells with RCC markers, vimentin (green) and PAX8 (red). (E) Primary cell growth curves from vehicle-treated or RaResistant TGs in mice cultured with vehicle (Ve) or 50 nM rapamycin (Ra). The error bars indicate SEM (n ≥ 3 per condition).
Fig. 3.
Fig. 3.
Rapamycin resistance is accompanied by mTORC1 reactivation in the tumor microenvironment. (A, B) Immunofluorescence analyses of vehicle, RaSensitive and RaResistant TGs for p-S6 and PAX8. White arrows show examples of pS6-stained stromal cells (PAX8-) in RaResistant TGs. (C, D) Quantitation of p-S6 positive cells according to PAX8 status. Five high power fields (hpf) per mouse TG (n = 3/condition) were evaluated (approximately ~800 to ~1,000 cells/condition). The bar graph represents percentage of cells (PAX8+, tumor; PAX8-, stroma) with p-S6 staining. The error bars indicate SEM; *P < 0.05; **P < 0.01; ***P < 0.001; ****P < 0.0001; ns, not significant.
Fig. 4.
Fig. 4.
Generation of an mTOR-S2035T NOD/SCID mouse strain resistant to rapamycin. (A) Cartoon illustrating innovative mouse model combining tumorgraft (TG/PDX) and genetic engineering approaches introducing a mutation in MTOR conferring rapamycin resistance into NOD/SCID host mice to test the impact of mTORC1 activation in the host on tumor suppression by rapamycin (Ra). (B) Genotypic analyses of DNA from pups generated from the injection of sgRNA (sgRNA4), ssODN (encoding the S2035T mutation), and recombinant SpCas9 into fertilized nuclei of NOD/SCID mouse zygotes by restriction fragment length polymorphism following PCR amplification and EcoR1 digestion for the introduced restriction site. Two positive founders were obtained (#1 and #2). Arrows indicate EcoR1 digestion fragments showing incorporation of the template DNA. (C) Bidirectional Sanger sequencing from founder mouse DNA confirming introduction of resistance mutation, silent mutations, and the EcoR1 site. (D) Western blot analyses of MEFs derived from wild-type (n = 3) or NOD/SCIDmTOR-ST mutant mice (n = 3) treated (or not) with rapamycin (Ra) (50 nM, 45 min). (E) Western blot analyses of 5-wk-old mouse kidneys from either wild-type (n = 3) or NOD/SCIDmTOR-ST mutant (n = 3) mice treated with rapamycin (Ra; 0.5 mg/kg every 48 h × 5 treatments) or vehicle (Ve) and collected 2 h after the last dose. Phospho and total proteins were from gels run in parallel with the same extracts.
Fig. 5.
Fig. 5.
mTORC1 inhibition of nontumor cells is required for rapamycin antitumor activity. (A) TG growth curves in wild-type (NOD/SCIDmTOR-WT) and mTOR S2035T heterozygous NOD/SCIDmTOR-ST (as well as homozygous NOD/SCIDmTOR-ST/ST) mice treated with rapamycin (Ra) or vehicle (Ve). The error bars indicate SEM (n ≥ 3 per condition). (B) Western blot analyses of XP144, XP164, and XP490 TGs in wild-type and NOD/SCIDmTOR-ST mice treated with vehicle or after acquisition of resistance to rapamycin (n = 3 per condition). p-S6 and S6 were from gels run in parallel with the same extracts. P-S6, phospho-S6 Ser240/244. (C) Immunofluorescence analyses (PAX8 and p-S6) of XP144 (NOD/SCIDmTOR-ST) and XP490 (NOD/SCIDmTOR-ST/ST) treated with rapamycin (Ra) or vehicle (Ve) with corresponding bar graph quantification of percentages of positive p-S6 staining PAX8+ (tumor) and PAX8- (stromal) cells. The error bars indicate SEM; **P < 0.01; ***P < 0.001; ns, not significant.
Fig. 6.
Fig. 6.
mTORC1 activation in mTOR-ST myofibroblasts despite rapamycin. (A) Immunofluorescence analyses [α-SMA (myofibroblasts) and p-S6] of XP144 (NOD/SCIDmTOR-ST) as well as XP164 and XP490 (NOD/SCIDmTOR-ST/ST) in mice treated with rapamycin (Ra) or vehicle (Ve). (B) Distribution of p-S6 signal by FACS in tumor cells (CAIX positive) and myofibroblasts (α-SMA positive) from TGs implanted into wild-type and mTOR-ST mice and treated with vehicle or rapamycin compared to a negative control (NC, no phospho-S6 antibody). P-S6, phospho-S6 Ser240/244. (C) Quantitation of the results shown in (B). The error bars indicate SEM; **P < 0.01; ***P < 0.001; ns, not significant.
Fig. 7.
Fig. 7.
Rapalog-resistant fibroblasts dampen rapalog antitumor activity in coculture experiments. (A) Quantification experiments of primary cells from XP144, XP164, and XP490 TGs cocultured with wild-type or mTOR-ST fibroblasts using transwells and treated with vehicle or 50 nM rapamycin for 3 d. The error bars indicate SEM (n = 3 per condition; *P < 0.05; **P < 0.01 using a paired t test with cocultures from the same experiment). (B) Western blot analyses of the cocultured primary tumor cells or fibroblasts treated with vehicle or rapamycin. p-S6 and S6 were from gels run in parallel with the same extracts. P-S6, phospho-S6 Ser240/244. (C) Cartoon illustrating how failure to inhibit mTORC1 in the TME of mTOR-ST mice induces resistance enabling tumor growth despite persistent mTORC1 inhibition in tumor cells.

Similar articles

Cited by

References

    1. Lopez-Beltran A., Scarpelli M., Montironi R., Kirkali Z., 2004 WHO classification of the renal tumors of the adults. Eur. Urol. 49, 798–805 (2006). - PubMed
    1. Latif F., et al. , Identification of the von Hippel-Lindau disease tumor suppressor gene. Science 260, 1317–1320 (1993). - PubMed
    1. Mitchell T. J., et al. , Timing the landmark events in the evolution of clear cell renal cell cancer: TRACERx renal. Cell 173, 611–623.e617 (2018). - PMC - PubMed
    1. Maxwell P. H., et al. , The tumour suppressor protein VHL targets hypoxia-inducible factors for oxygen-dependent proteolysis. Nature 399, 271–275 (1999). - PubMed
    1. Ivan M., et al. , HIFalpha targeted for VHL-mediated destruction by proline hydroxylation: Implications for O2 sensing. Science 292, 464–468 (2001). - PubMed

MeSH terms