

Historical redlining is associated with disparities in wildlife biodiversity in four California cities
- PMID: 38861597
- PMCID: PMC11194601
- DOI: 10.1073/pnas.2321441121
Historical redlining is associated with disparities in wildlife biodiversity in four California cities
Abstract
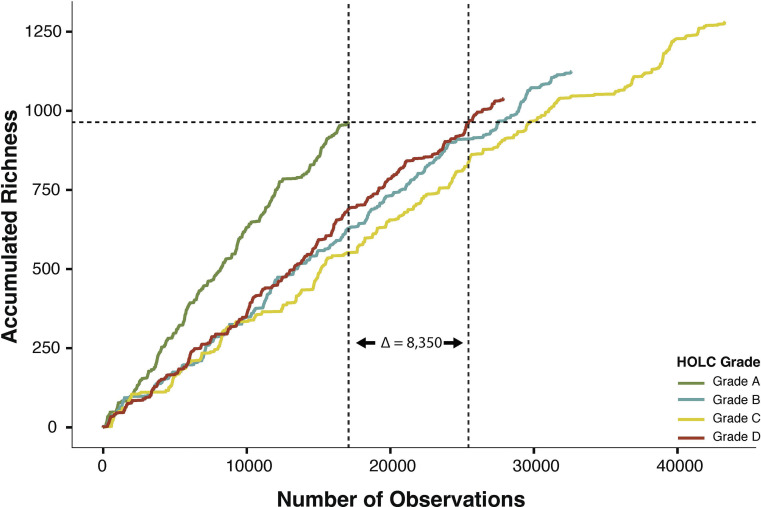
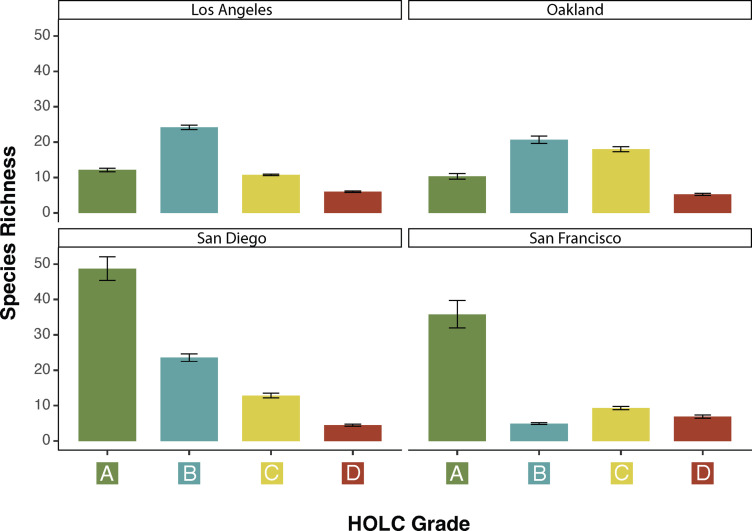
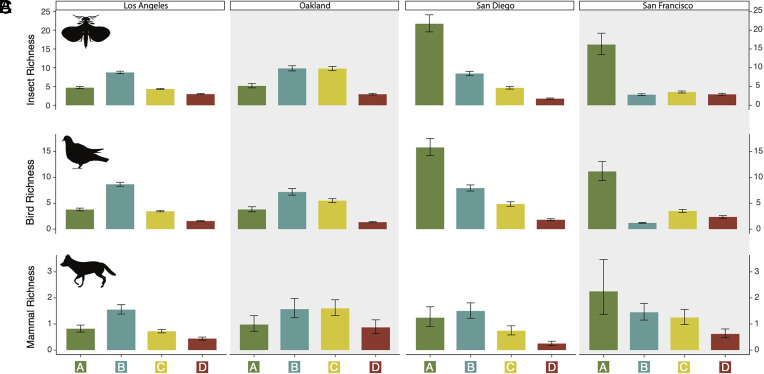
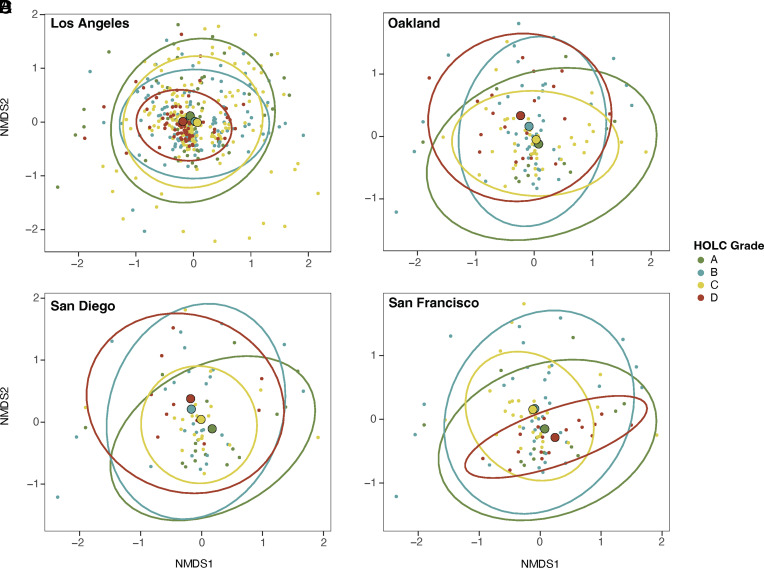
Legacy effects describe the persistent, long-term impacts on an ecosystem following the removal of an abiotic or biotic feature. Redlining, a policy that codified racial segregation and disinvestment in minoritized neighborhoods, has produced legacy effects with profound impacts on urban ecosystem structure and health. These legacies have detrimentally impacted public health outcomes, socioeconomic stability, and environmental health. However, the collateral impacts of redlining on wildlife communities are uncertain. Here, we investigated whether faunal biodiversity was associated with redlining. We used home-owner loan corporation (HOLC) maps [grades A (i.e., "best" and "greenlined"), B, C, and D (i.e., "hazardous" and "redlined")] across four cities in California and contributory science data (iNaturalist) to estimate alpha and beta diversity across six clades (mammals, birds, insects, arachnids, reptiles, and amphibians) as a function of HOLC grade. We found that in greenlined neighborhoods, unique species were detected with less sampling effort, with redlined neighborhoods needing over 8,000 observations to detect the same number of unique species. Historically redlined neighborhoods had lower native and nonnative species richness compared to greenlined neighborhoods across each city, with disparities remaining at the clade level. Further, community composition (i.e., beta diversity) consistently differed among HOLC grades for all cities, including large differences in species assemblage observed between green and redlined neighborhoods. Our work spotlights the lasting effects of social injustices on the community ecology of cities, emphasizing that urban conservation and management efforts must incorporate an antiracist, justice-informed lens to improve biodiversity in urban environments.
Keywords: environmental justice; iNaturalist; legacy effects; redlining; species richness.
Conflict of interest statement
Competing interests statement:The authors declare no competing interest.
Figures
Similar articles
-
Historical Redlining Is Associated with Disparities in Environmental Quality across California.Environ Sci Technol Lett. 2024 Jan 19;11(2):54-59. doi: 10.1021/acs.estlett.3c00870. eCollection 2024 Feb 13. Environ Sci Technol Lett. 2024. PMID: 38371654 Free PMC article.
-
Race, historical redlining, and contemporary transportation noise disparities in the United States.J Expo Sci Environ Epidemiol. 2025 Jan;35(1):50-61. doi: 10.1038/s41370-024-00682-x. Epub 2024 May 17. J Expo Sci Environ Epidemiol. 2025. PMID: 38760532
-
Linking environmental injustices in Detroit, MI to institutional racial segregation through historical federal redlining.J Expo Sci Environ Epidemiol. 2024 May;34(3):389-398. doi: 10.1038/s41370-022-00512-y. Epub 2022 Dec 21. J Expo Sci Environ Epidemiol. 2024. PMID: 36544051 Free PMC article.
-
Connecting past to present: Examining different approaches to linking historical redlining to present day health inequities.PLoS One. 2022 May 19;17(5):e0267606. doi: 10.1371/journal.pone.0267606. eCollection 2022. PLoS One. 2022. PMID: 35587478 Free PMC article. Review.
-
The Relationship of Historical Redlining with Present-Day Neighborhood Environmental and Health Outcomes: A Scoping Review and Conceptual Model.J Urban Health. 2022 Dec;99(6):959-983. doi: 10.1007/s11524-022-00665-z. Epub 2022 Aug 1. J Urban Health. 2022. PMID: 35915192 Free PMC article.
Cited by
-
Historical Redlining Is Associated with Disparities in Environmental Quality across California.Environ Sci Technol Lett. 2024 Jan 19;11(2):54-59. doi: 10.1021/acs.estlett.3c00870. eCollection 2024 Feb 13. Environ Sci Technol Lett. 2024. PMID: 38371654 Free PMC article.
-
Towards a 'people and nature' paradigm for biodiversity and infectious disease.Philos Trans R Soc Lond B Biol Sci. 2025 Jan 9;380(1917):20230259. doi: 10.1098/rstb.2023.0259. Epub 2025 Jan 9. Philos Trans R Soc Lond B Biol Sci. 2025. PMID: 39780600 Free PMC article. Review.
-
Beyond black and white: an ecologist applies racial-justice principles to predators and their ecosystems.Nature. 2025 Jan 21. doi: 10.1038/d41586-024-04179-3. Online ahead of print. Nature. 2025. PMID: 39838200 No abstract available.
-
Restoring landscapes and communities: Insights from critical, urban, and plant ecology.Environ Sci Ecotechnol. 2025 Jul 12;27:100601. doi: 10.1016/j.ese.2025.100601. eCollection 2025 Sep. Environ Sci Ecotechnol. 2025. PMID: 40799361 Free PMC article. Review.
References
-
- Diaz S., Wardle D., Hector A., “Incorporating biodiversity in climate change mitigation initiatives” in Biodiversity, Ecosystem Functioning, and Human Wellbeing: An Ecological and Economic Perspective, Naeem S., Bunker D. E., Hector A., Eds. (OUP Oxford, 2009), pp. 149–166.
-
- Mittelbach G. G., McGill B. J., Community Ecology (Oxford University Press, 2019).
-
- Truchy A., Angeler D. G., Sponseller R. A., Johnson R. K., McKie B. G., “Chapter two—linking biodiversity, ecosystem functioning and services, and ecological resilience: towards an integrative framework for improved management” in Advances in Ecological Research, Ecosystem Services, Woodward G., Bohan D. A., Eds. (Academic Press, 2015), pp. 55–96.
-
- Schwarz N., et al. , Understanding biodiversity-ecosystem service relationships in urban areas: A comprehensive literature review. Ecosyst. Services 27, 161–171 (2017).
