. 2024 Jun 11;17(840):eadn8376.
doi: 10.1126/scisignal.adn8376. Epub 2024 Jun 11.

Slow proliferation of BAP1-deficient uveal melanoma cells is associated with reduced S6 signaling and resistance to nutrient stress

Affiliations

Slow proliferation of BAP1-deficient uveal melanoma cells is associated with reduced S6 signaling and resistance to nutrient stress

Vivian Chua et al. Sci Signal. .

Abstract

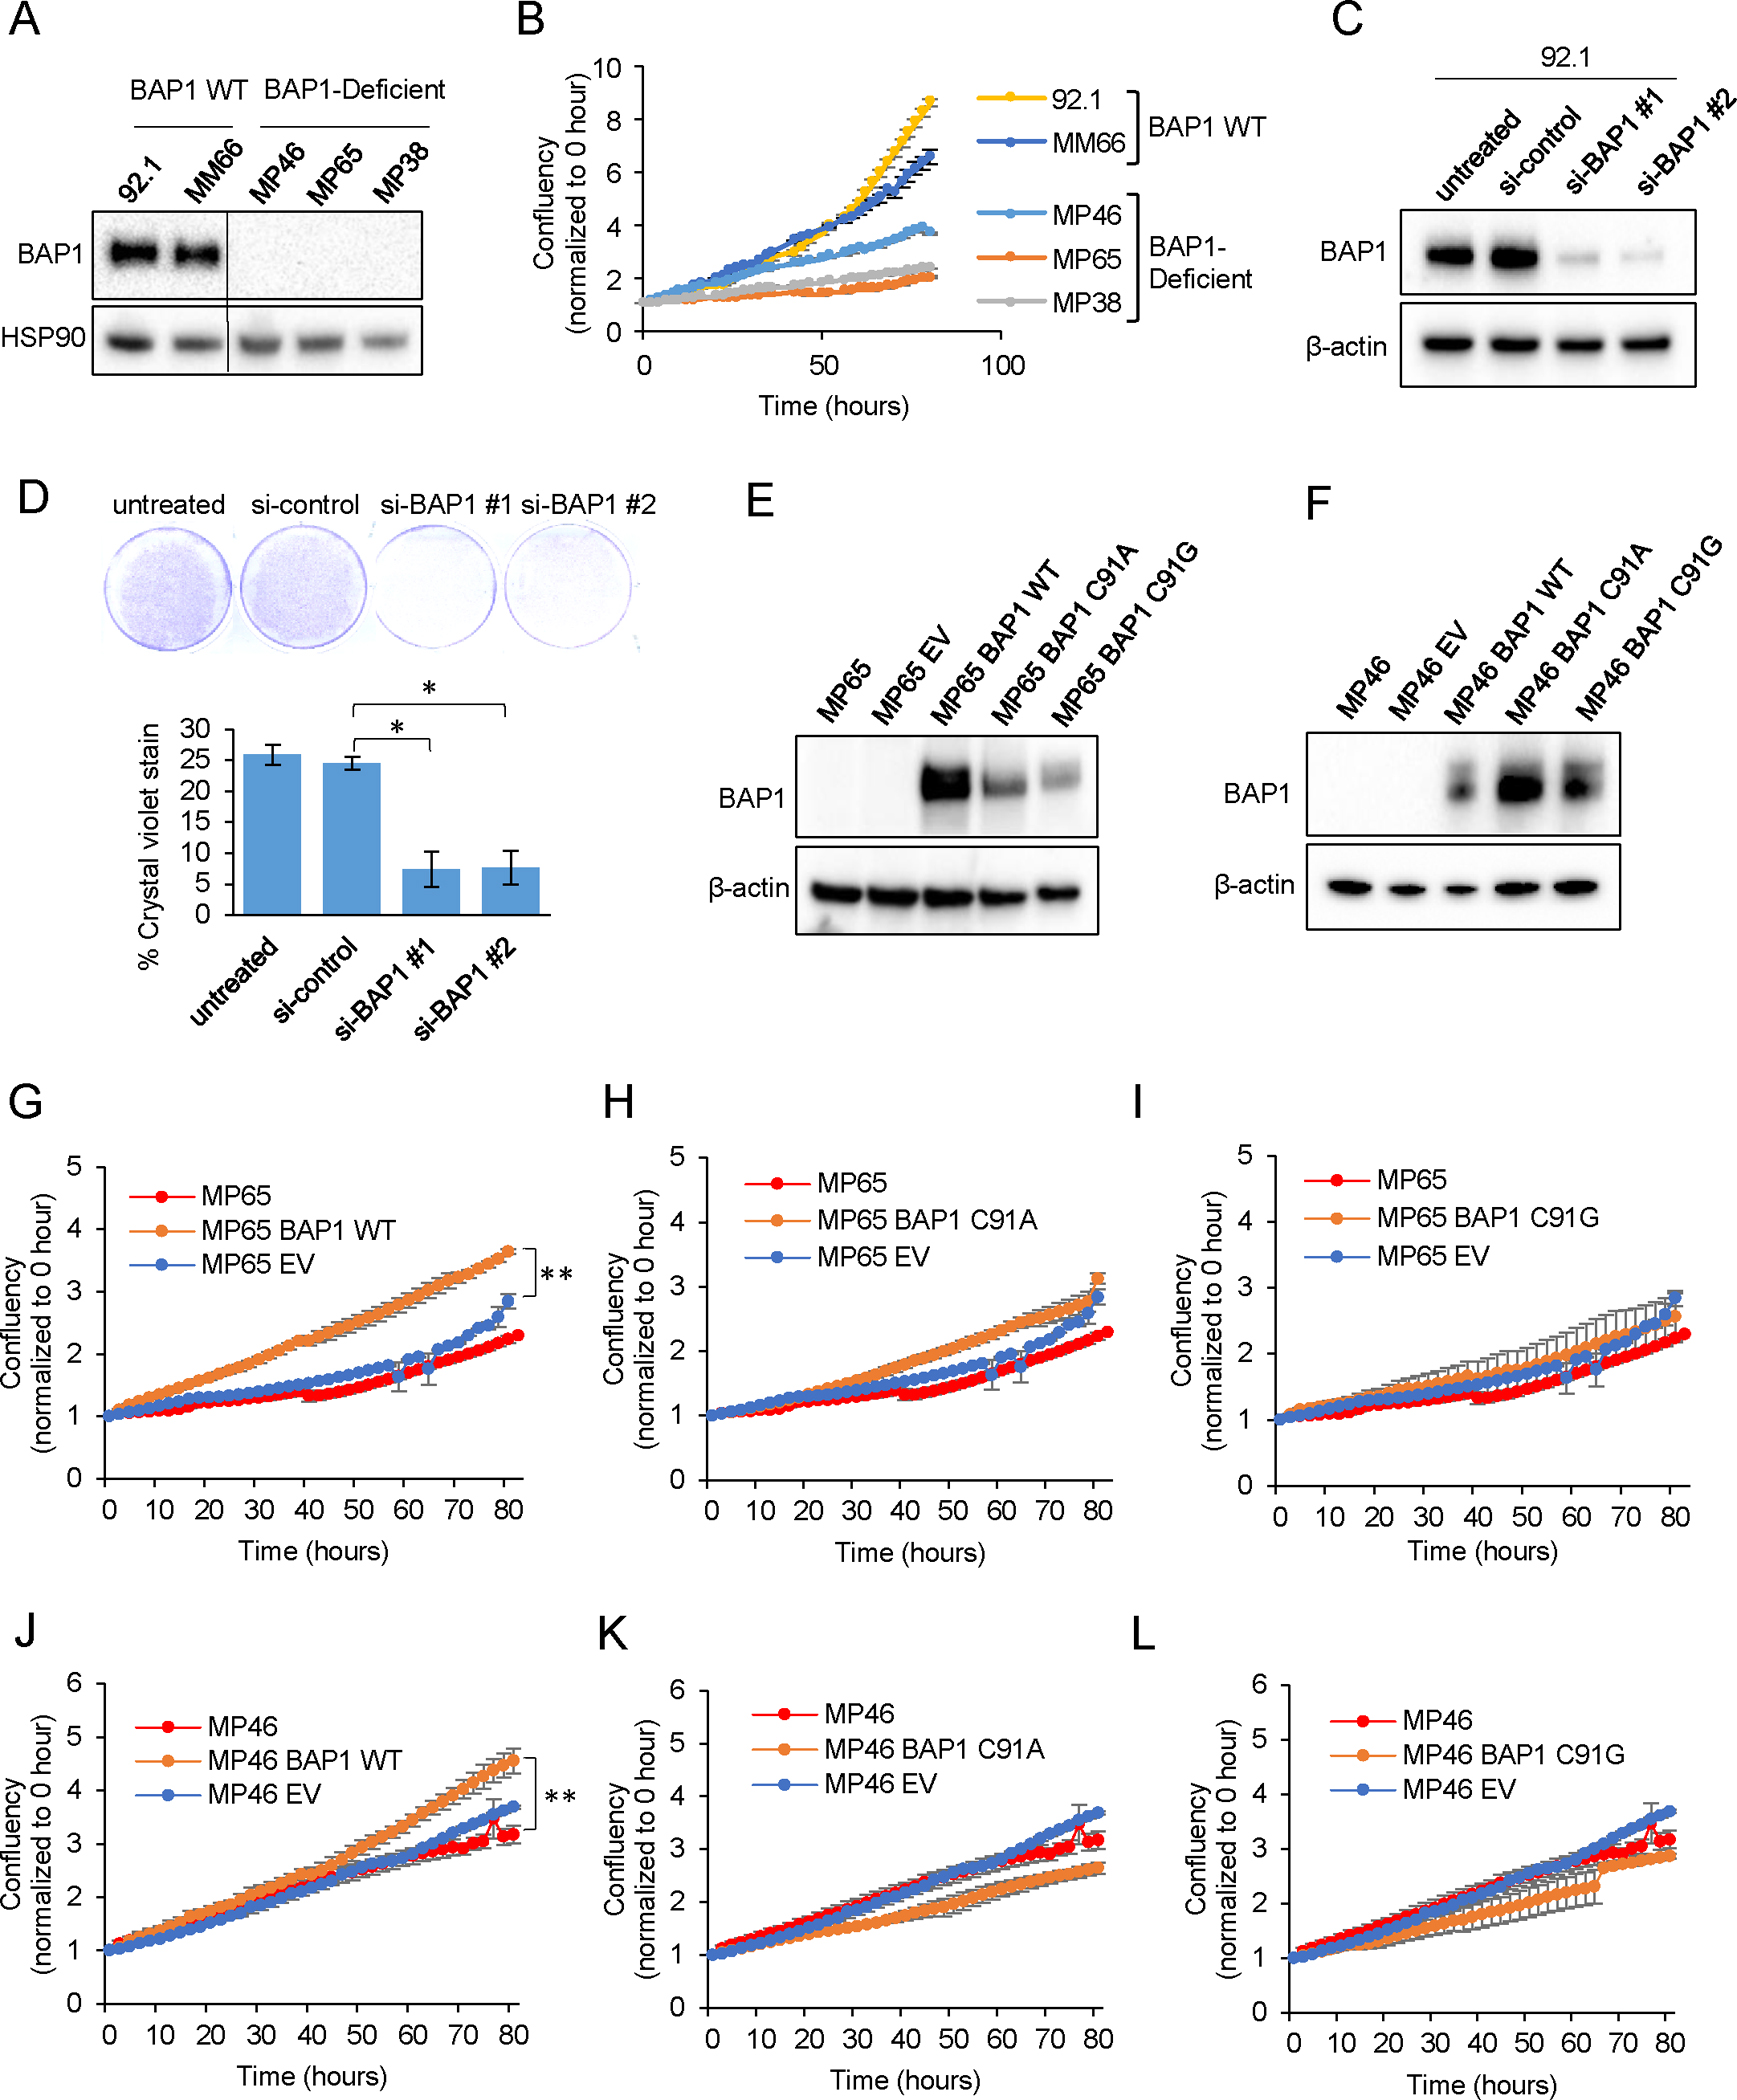
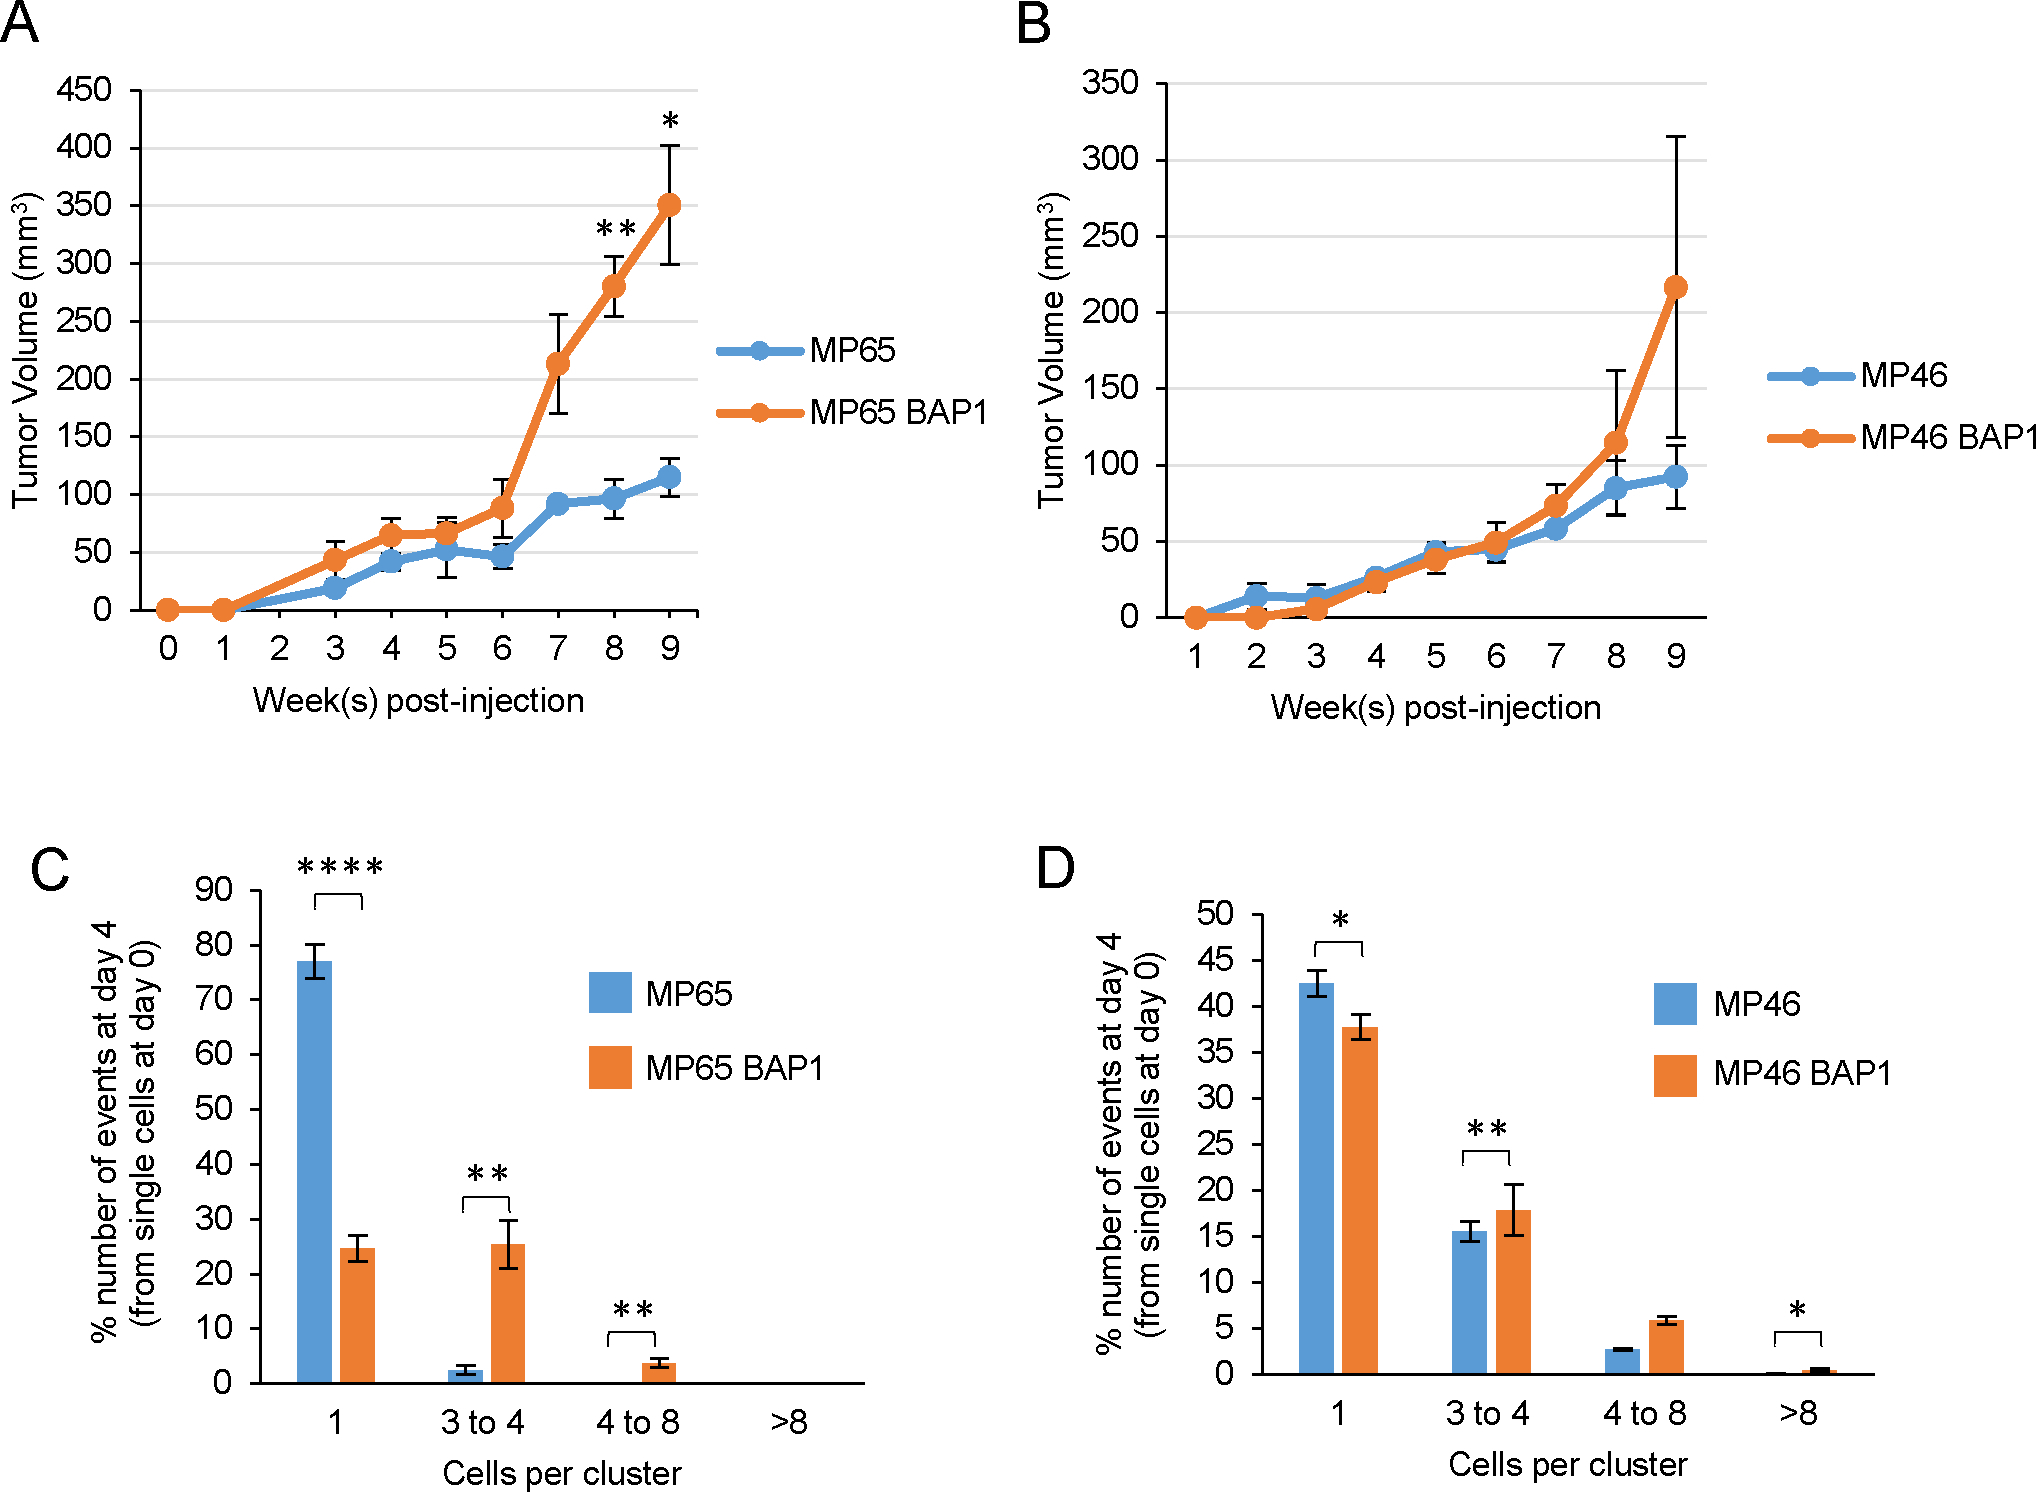
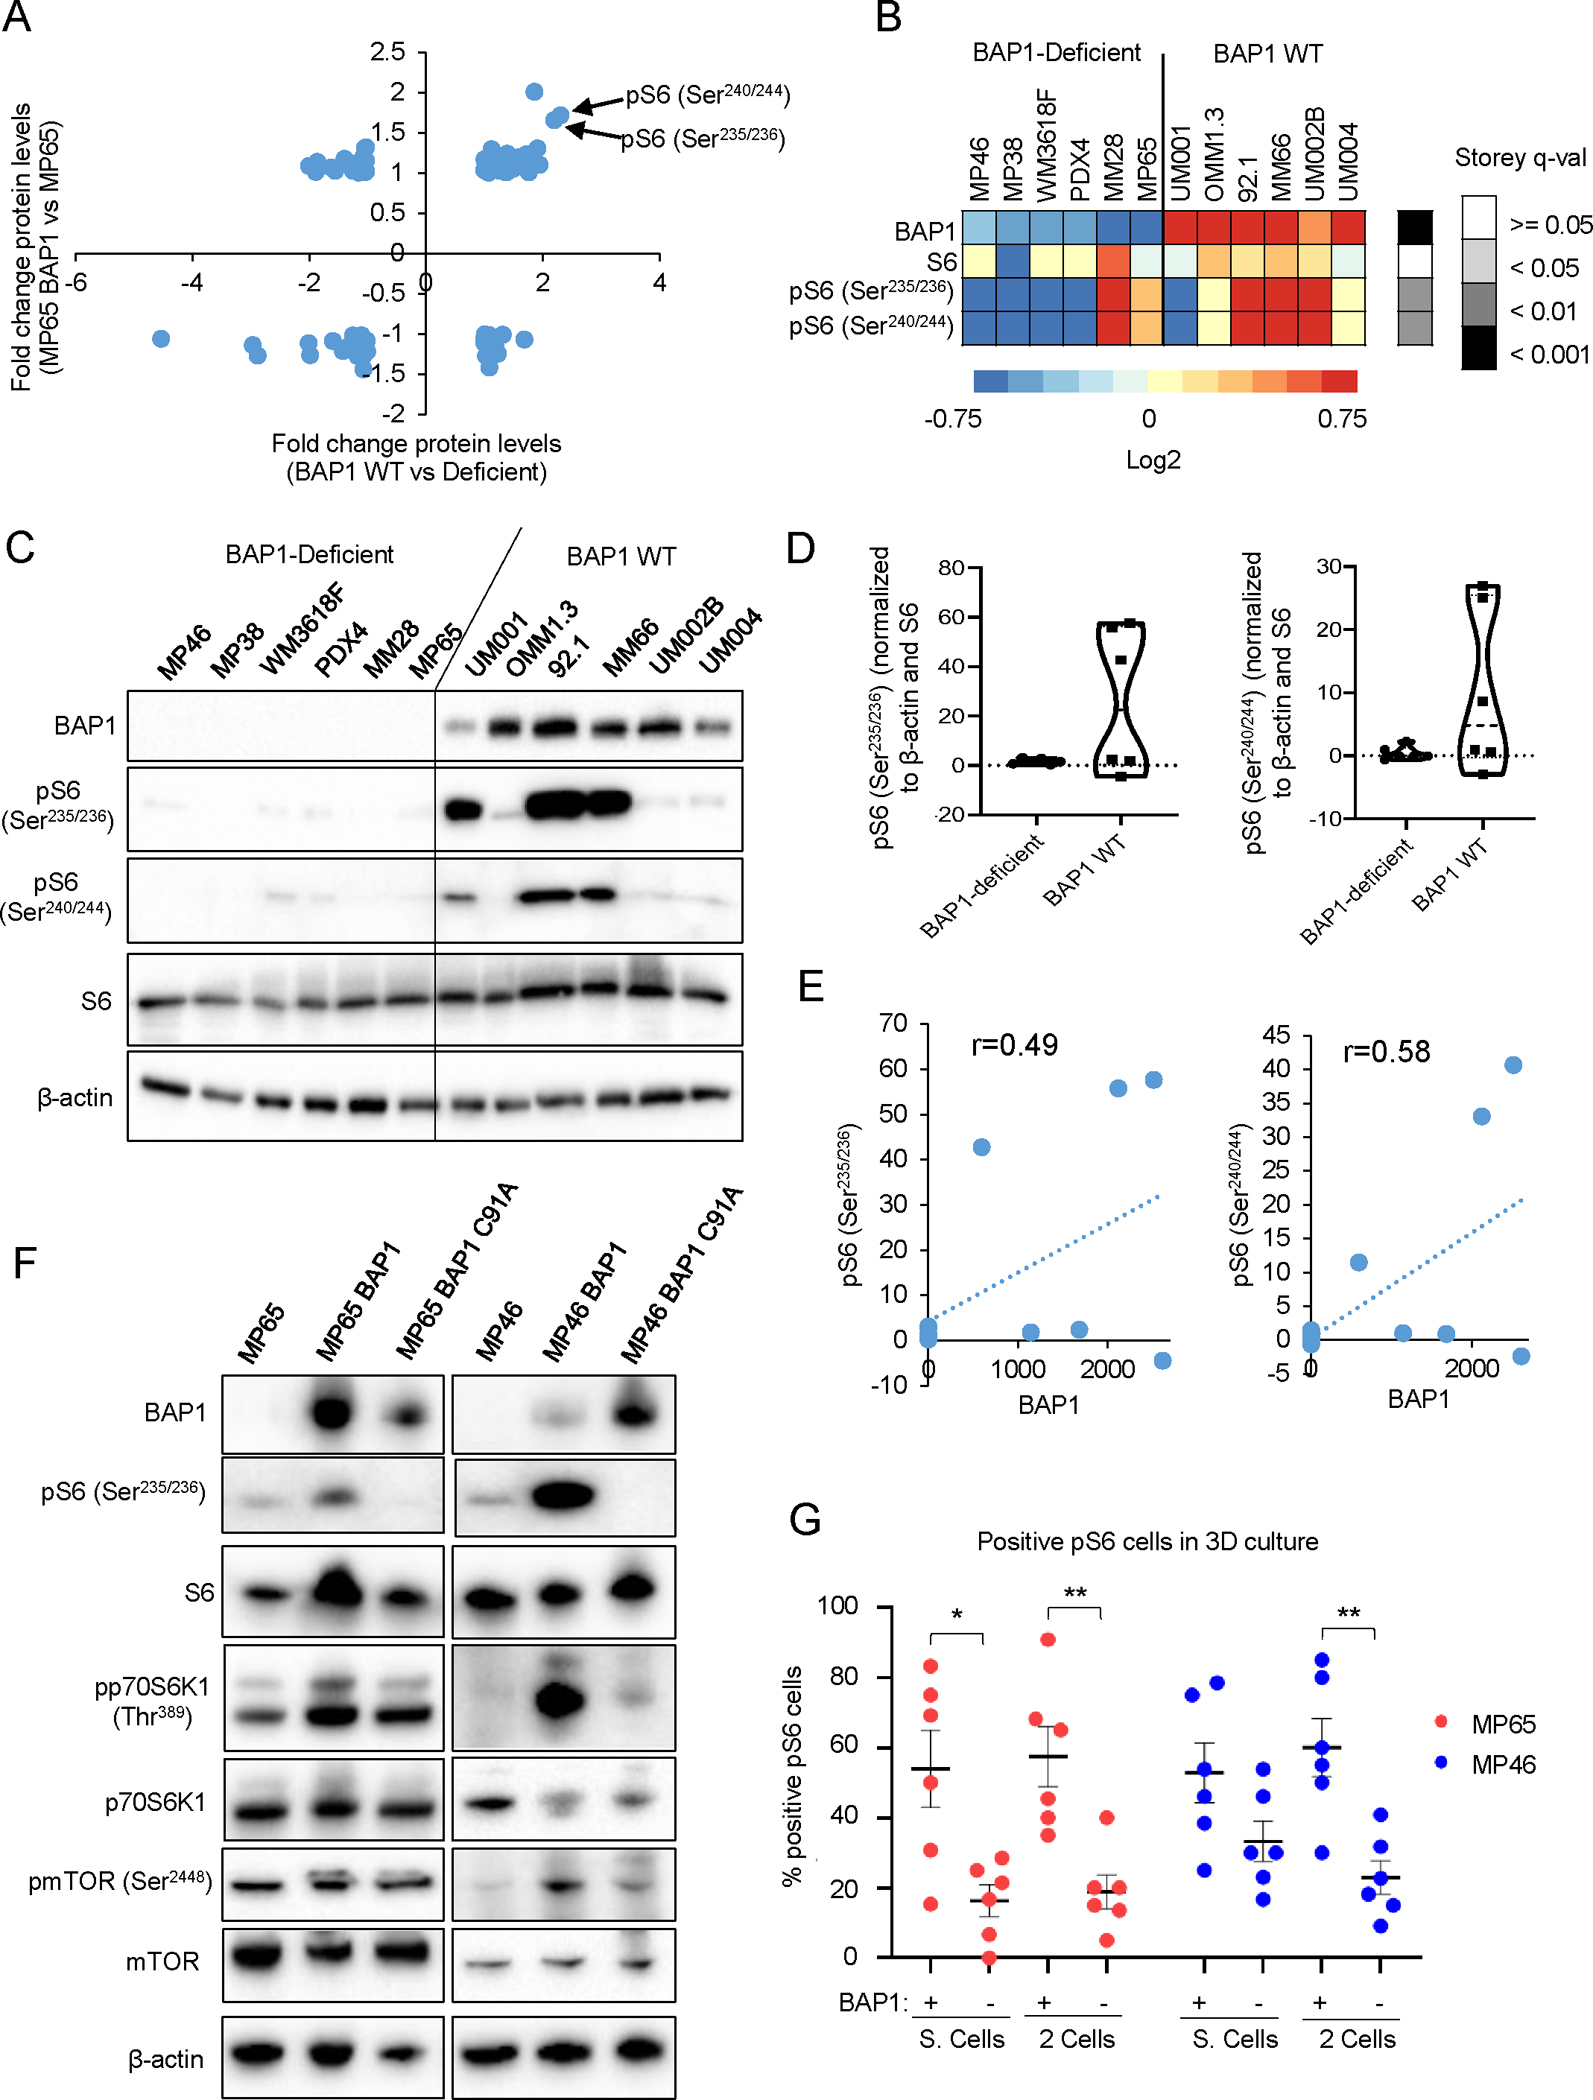
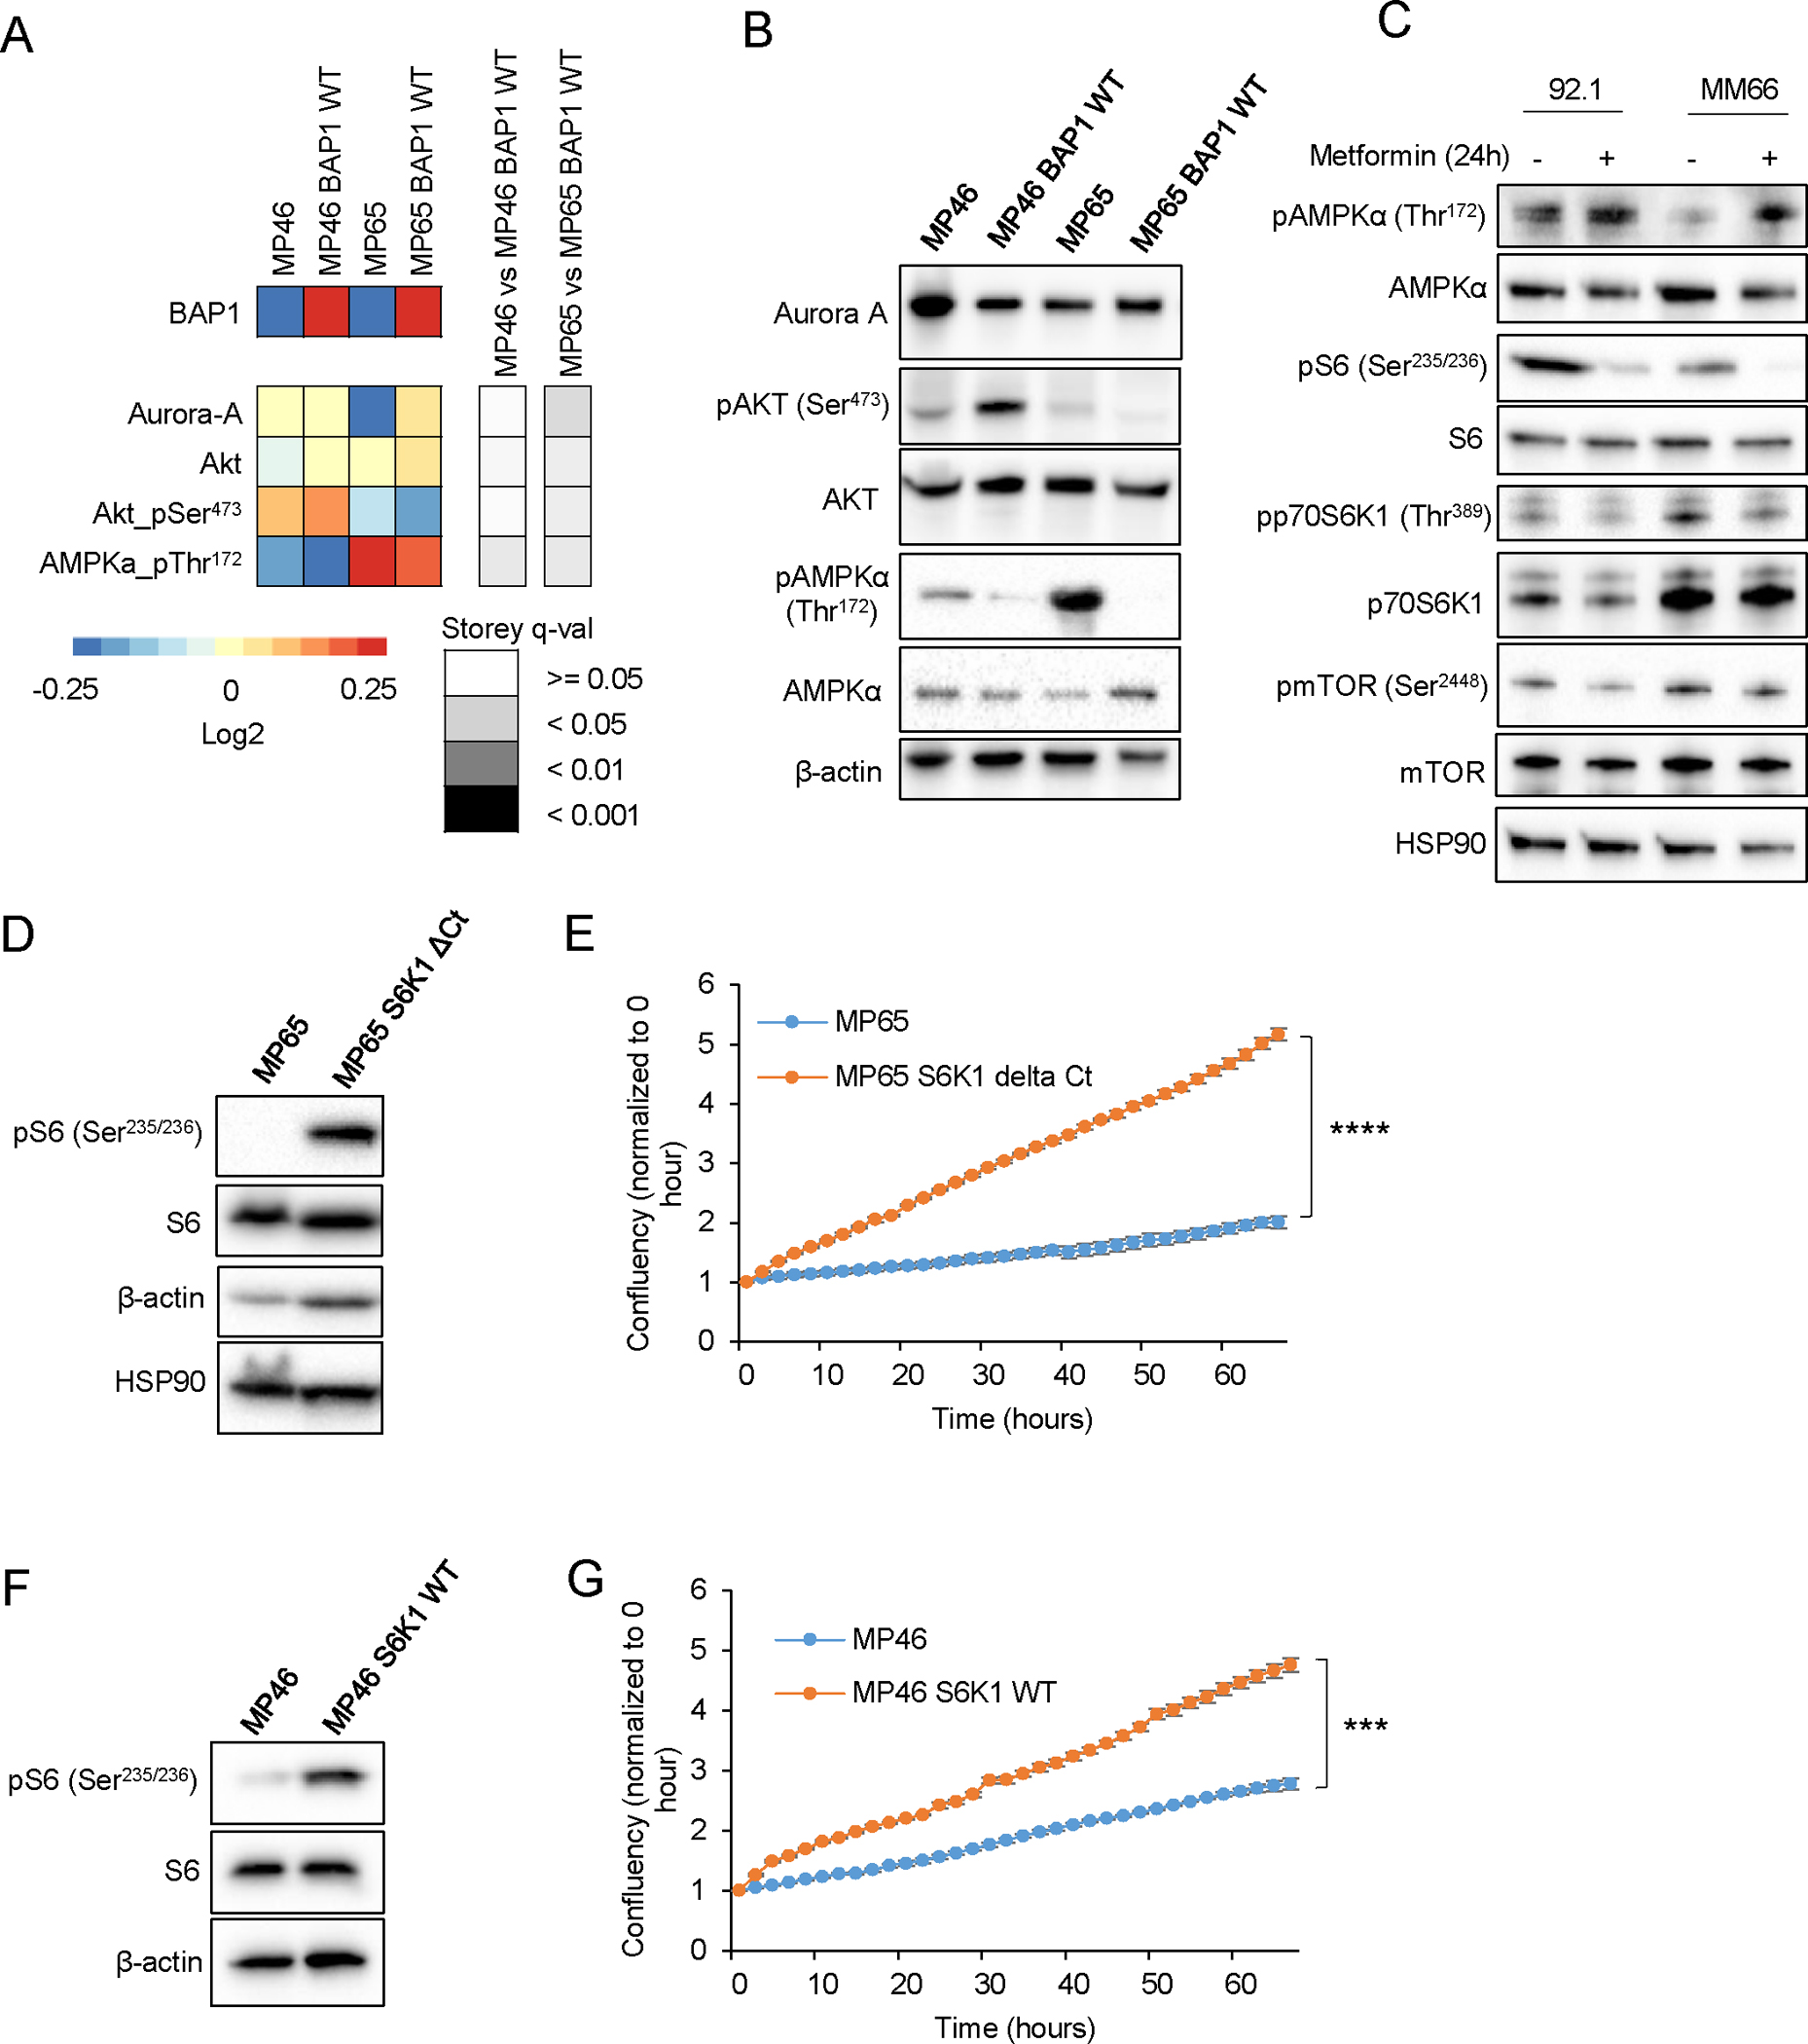
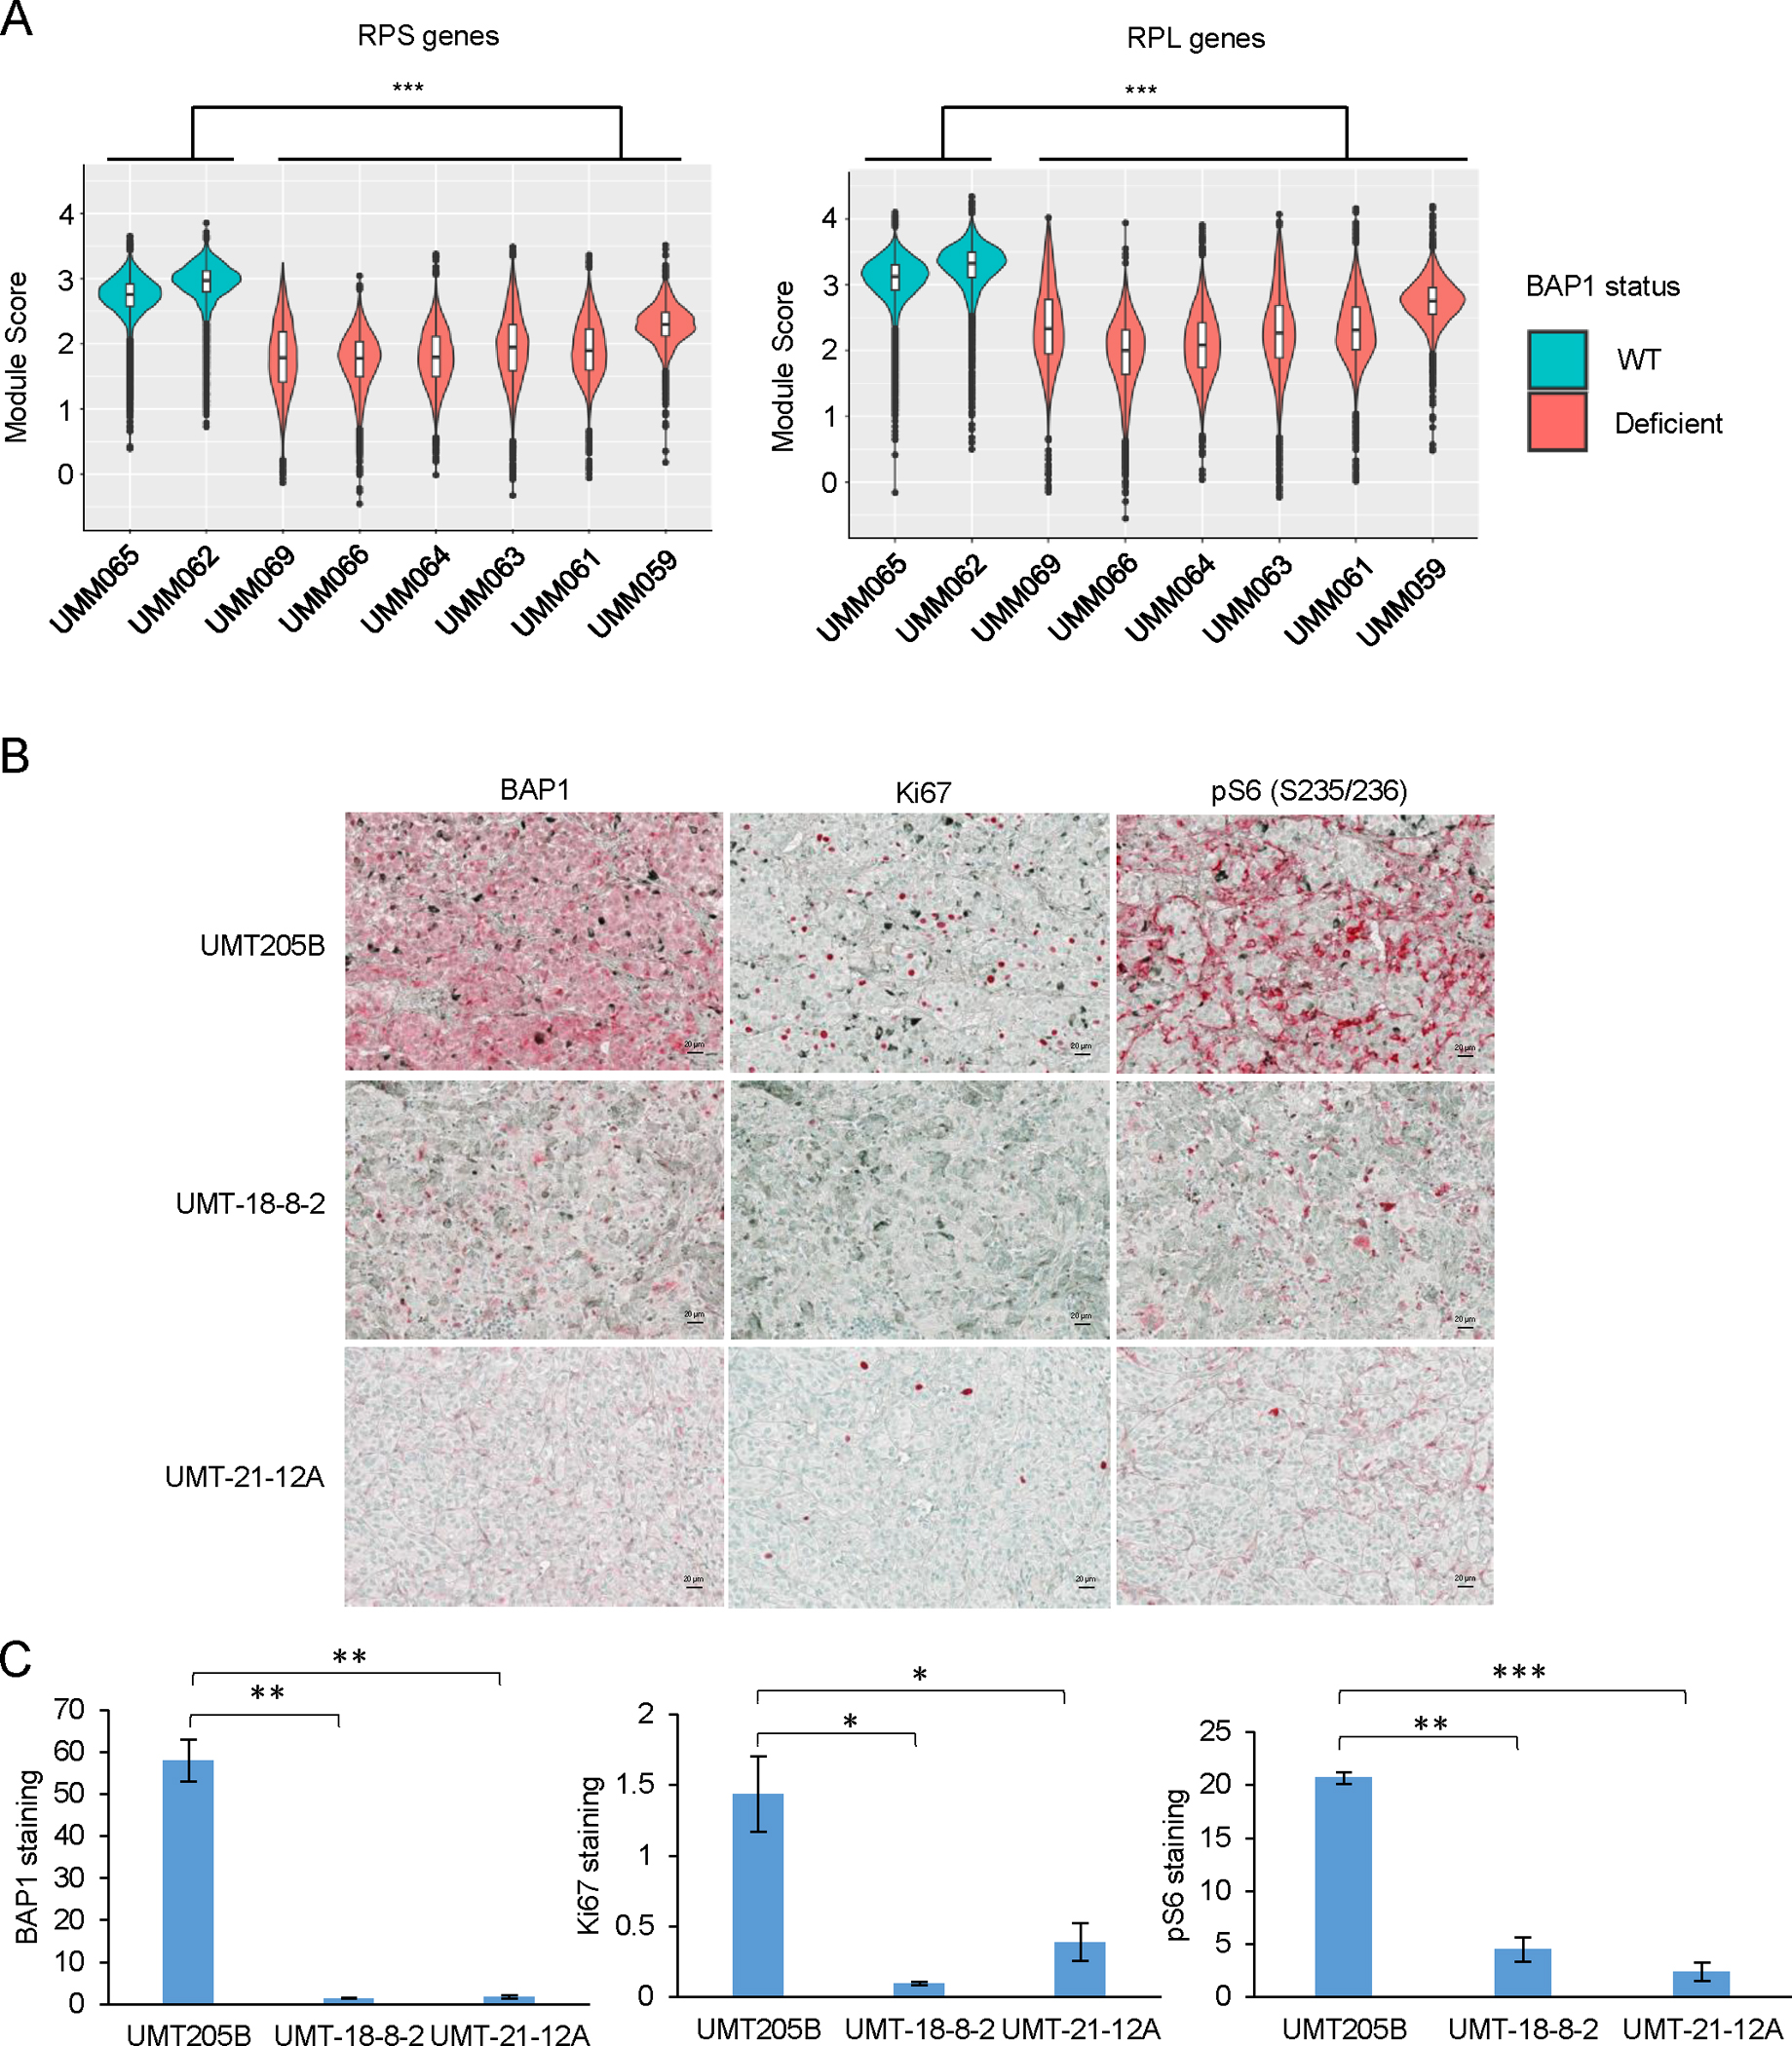
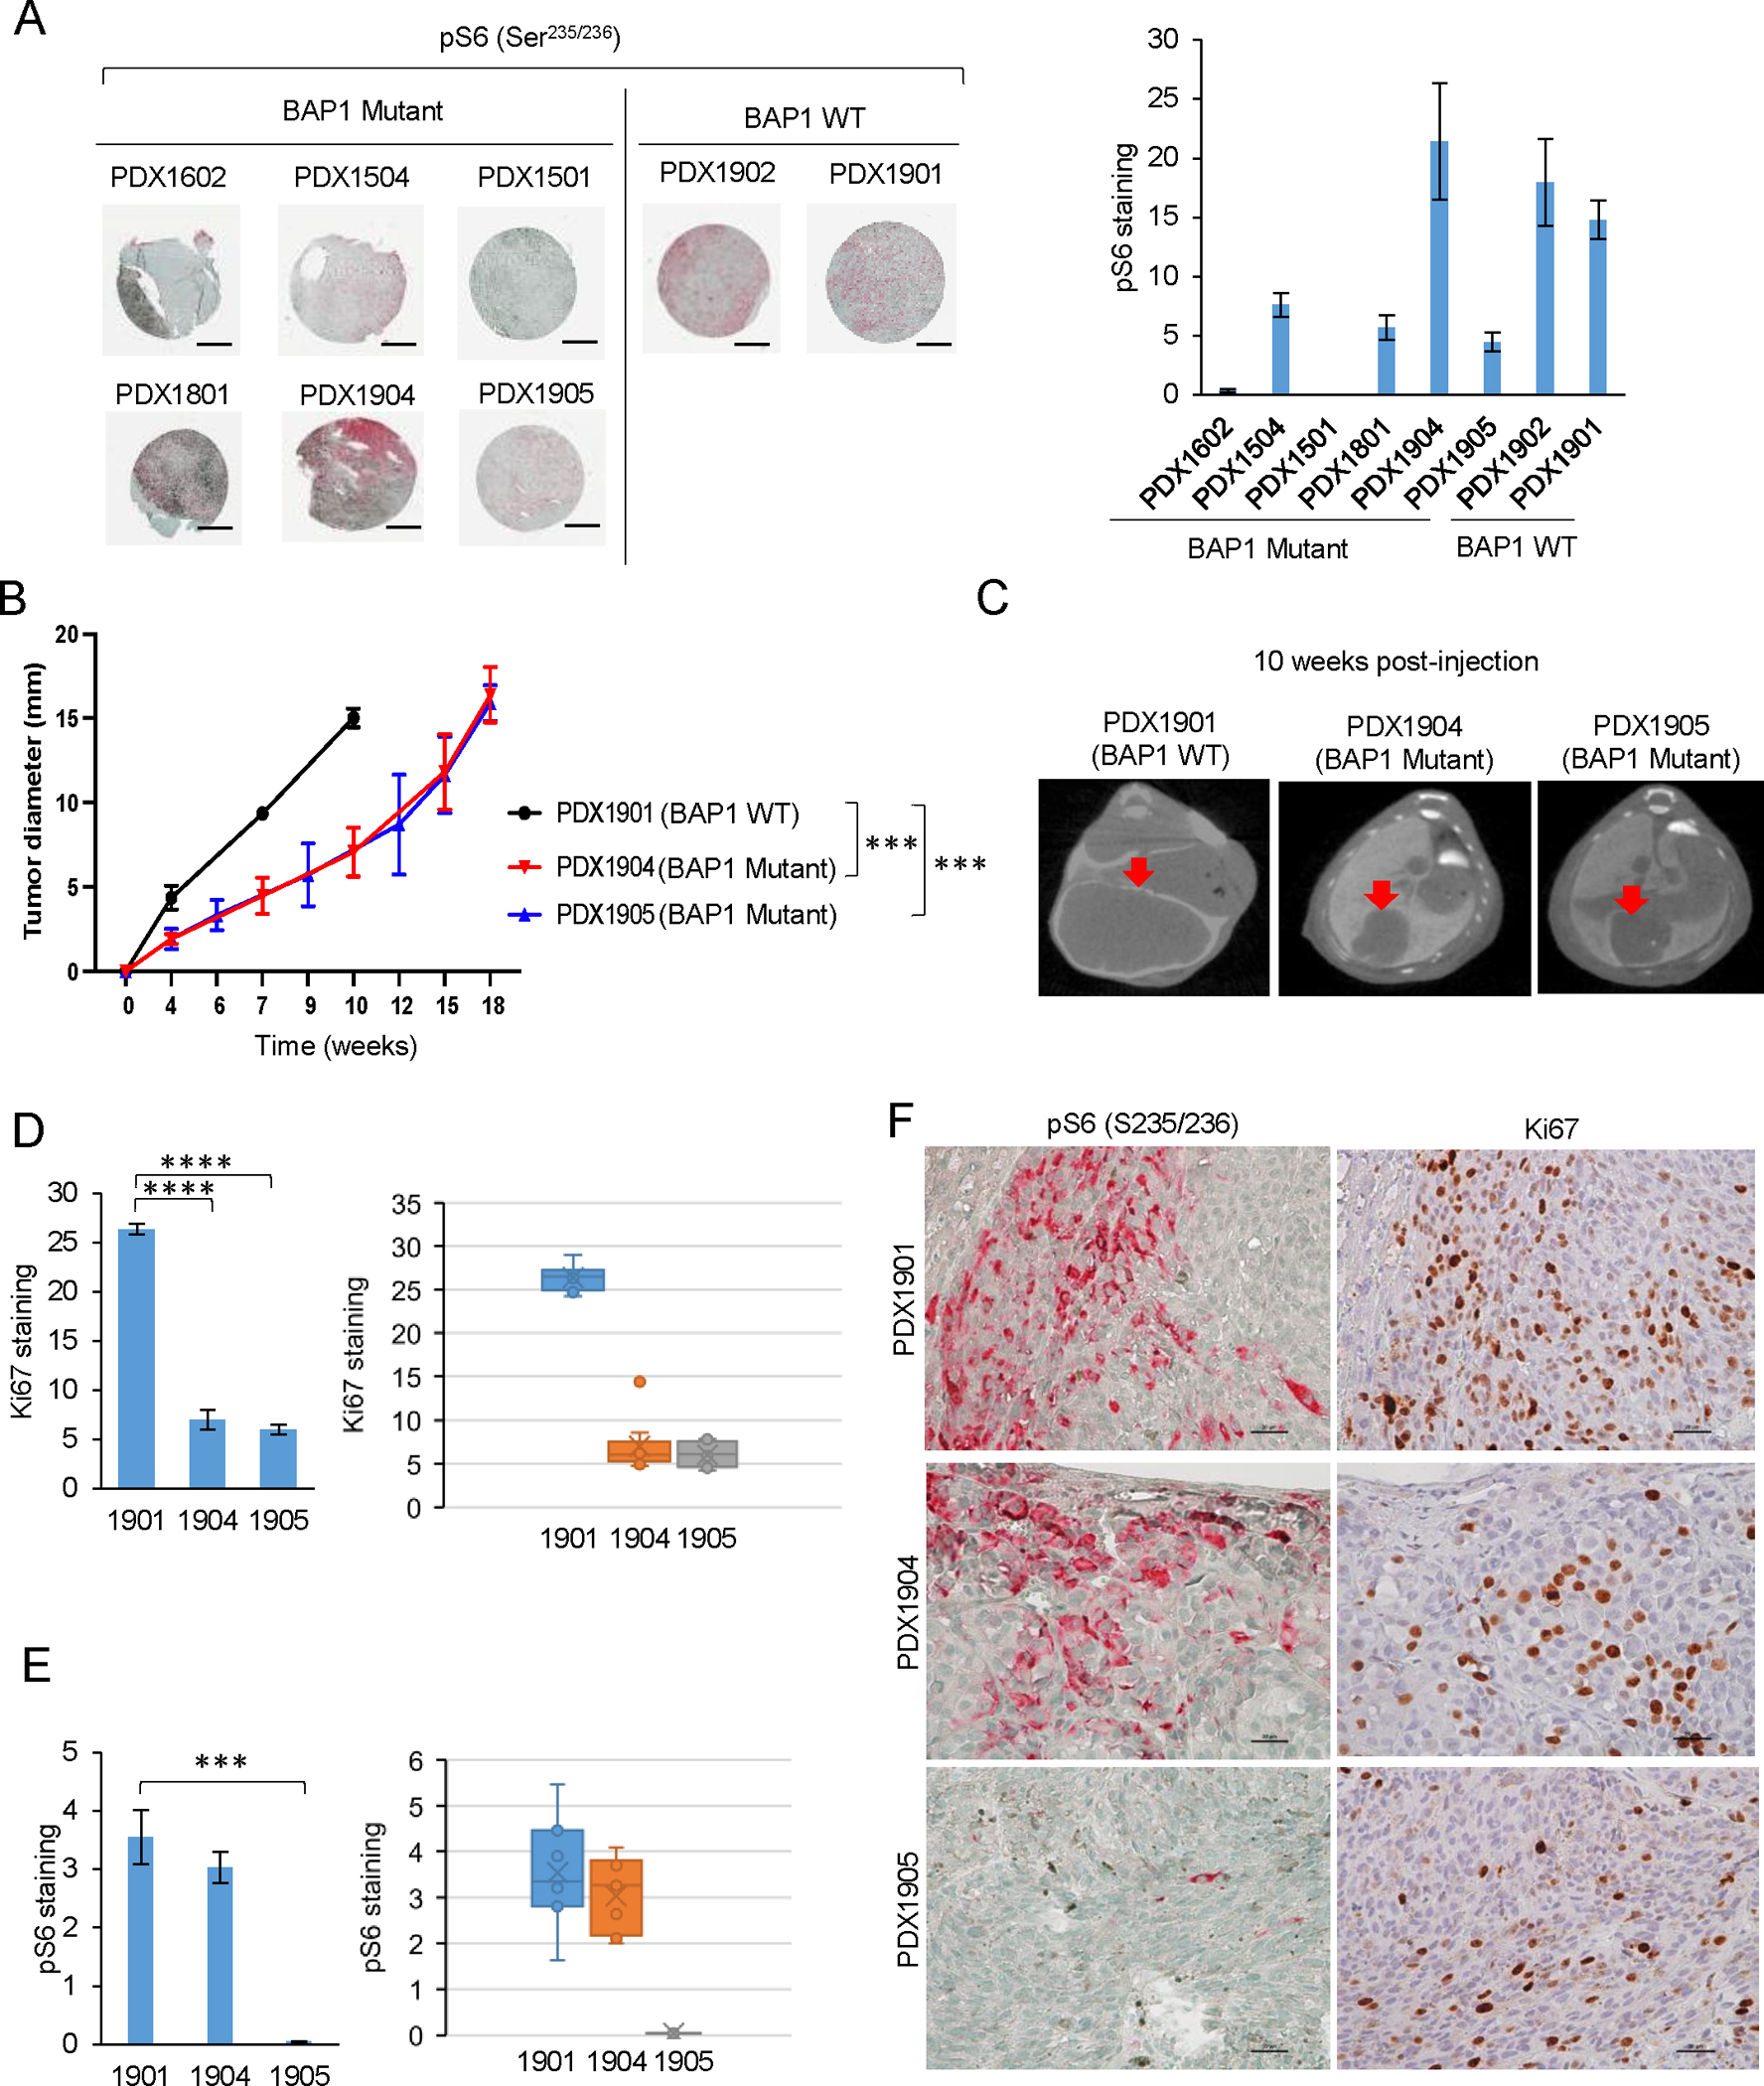
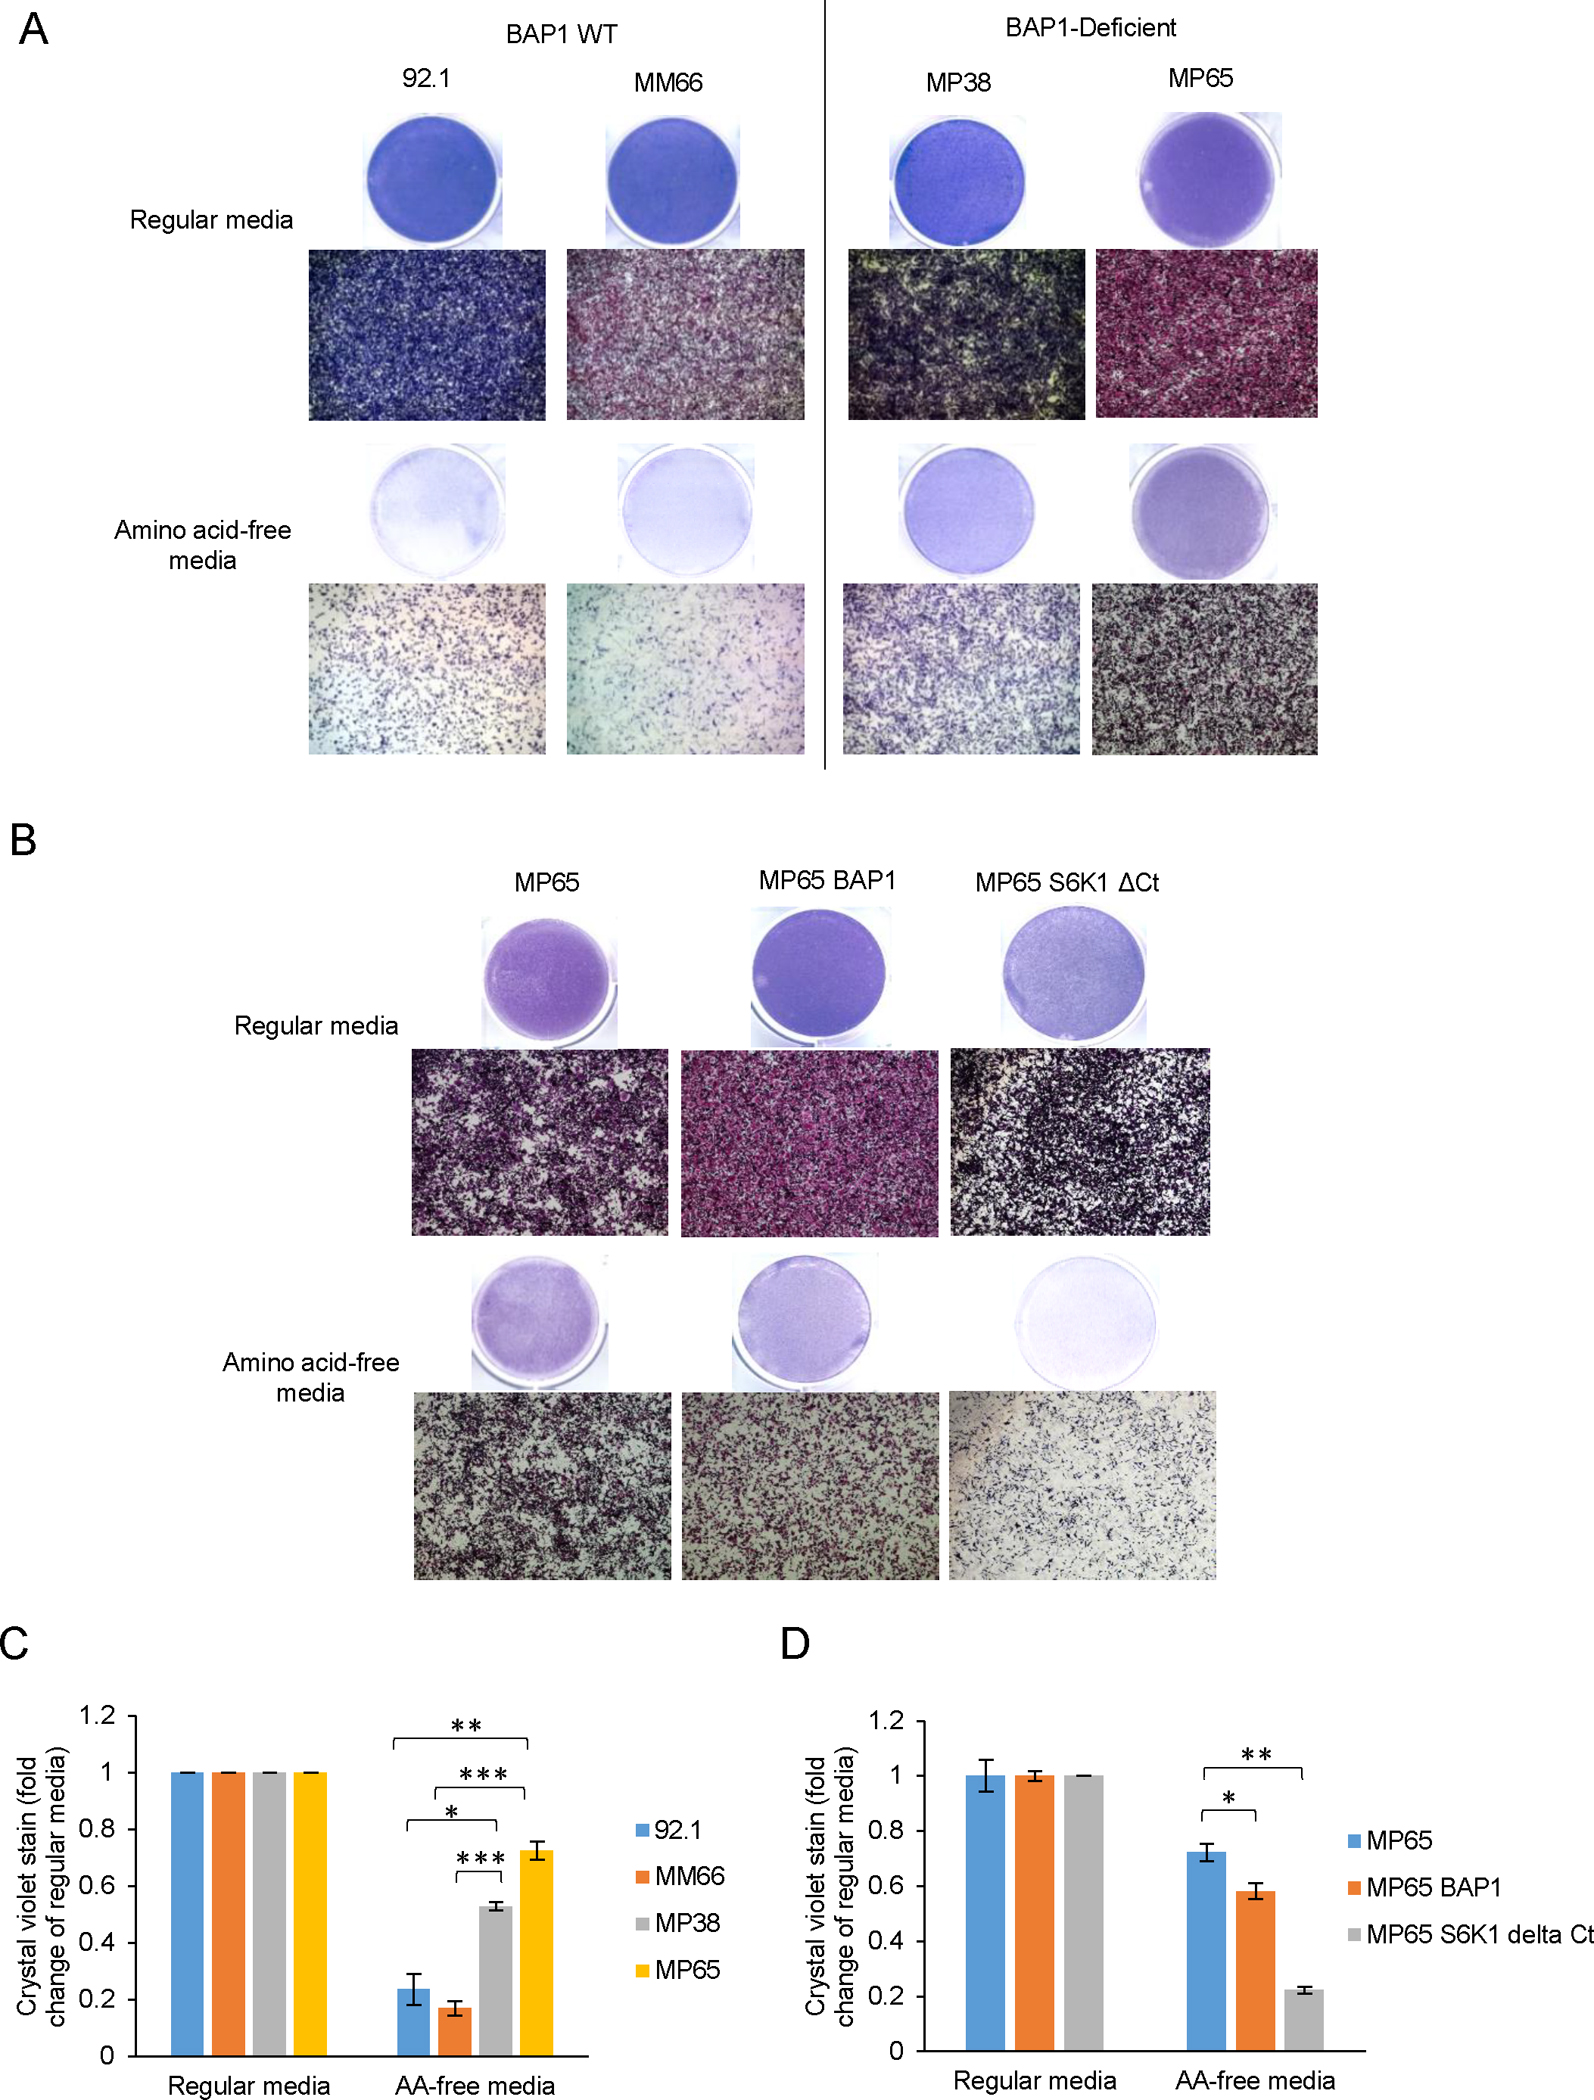
Uveal melanoma (UM) is the deadliest form of eye cancer in adults. Inactivating mutations and/or loss of expression of the gene encoding BRCA1-associated protein 1 (BAP1) in UM tumors are associated with an increased risk of metastasis. To investigate the mechanisms underlying this risk, we explored the functional consequences of BAP1 deficiency. UM cell lines expressing mutant BAP1 grew more slowly than those expressing wild-type BAP1 in culture and in vivo. The ability of BAP1 reconstitution to restore cell proliferation in BAP1-deficient cells required its deubiquitylase activity. Proteomic analysis showed that BAP1-deficient cells had decreased phosphorylation of ribosomal S6 and its upstream regulator, p70S6K1, compared with both wild-type and BAP1 reconstituted cells. In turn, expression of p70S6K1 increased S6 phosphorylation and proliferation of BAP1-deficient UM cells. Consistent with these findings, BAP1 mutant primary UM tumors expressed lower amounts of p70S6K1 target genes, and S6 phosphorylation was decreased in BAP1 mutant patient-derived xenografts (PDXs), which grew more slowly than wild-type PDXs in the liver (the main metastatic site of UM) in mice. BAP1-deficient UM cells were also more resistant to amino acid starvation, which was associated with diminished phosphorylation of S6. These studies demonstrate that BAP1 deficiency slows the proliferation of UM cells through regulation of S6 phosphorylation. These characteristics may be associated with metastasis by ensuring survival during amino acid starvation.


Conflict of interest statement

Competing interests: A.E.A. has ownership interest in patent number 9880150 and has a pending patent, PCT/US22/76492. M.A.D. has been a consultant to Roche/Genentech, Array, Pfizer, Novartis, BMS, GSK, Sanofi-Aventis, Vaccinex, Apexigen, Eisai, Iovance, and ABM Therapeutics, and he has been the PI of research grants to MD Anderson by Roche/Genentech, GSK, Sanofi-Aventis, Merck, Myriad, Oncothyreon, ABM Therapeutics, and LEAD Pharma. J.A.A-G. is a scientific co-founder, scientific advisory board member and equity owner in HiberCell and receives financial compensation as a consultant for HiberCell, a Mount Sinai spin-off company focused on the research and development of therapeutics that prevent or delay the recurrence of cancer. All other authors declare that they have no potential conflicts of interest.

Figures

Figure 1:
Figure 1:. Loss of BAP1 is associated with slow proliferation of UM cells in 2D cultures.
(A) BAP1 protein expression in BAP1 WT (92.1, MM66) and BAP1-deficient (MP46, MP65, MP38) UM cell lines detected by Western blotting. (B) Cell confluency measured over time using the Incucyte® live cell imager. Fold change in cell confluency normalized to confluency at 0 hour is shown. Mean data from triplicate experiments (N=3) is shown. (C) BAP1 protein levels in 92.1 cells following 72 hours of transfection with BAP1 siRNA. (D) Crystal violet staining of 92.1 cells after si-BAP1 transfection for 72 hours. Representative crystal violet images and mean ± S.E.M. of % crystal violet staining from triplicate experiments (N=3) are shown. *p≤0.05 by unpaired student’s t-test adjusted using the Hochberg method. (E and F) Western blot of BAP1 protein levels in MP65 and MP46 cells transduced with empty vector (EV), WT or DUB-mutant BAP1 (C91A or C91G). (G to L) Cell confluency of MP65 or MP46 parental cells compared to cells transduced with EV (empty vector), BAP1 WT, BAP1 C91A, or BAP1 C91G. Cell confluency was determined using the Incucyte® live cell imager and normalized to confluency at 0 hour. Mean ± S.E.M. of cell confluency from triplicate experiments (N=3) is shown. **p≤0.01 by unpaired student’s t-test adjusted using the Hochberg method.
Figure 2:
Figure 2:. Re-expression of BAP1 increased the proliferation of UM cells in vivo and in 3D cultures.
(A) Tumor volume of MP65 and MP65 BAP1 WT, and (B) MP46 and MP46 BAP1 WT xenografts measured weekly following subcutaneous injection of cells in NSG mice. Mean ± S.E.M. of tumor volume from four animals (N=4) is shown. *p≤0.05, **p≤0.01 by unpaired student’s t-test adjusted using the Hochberg method. (C) Percentage of single-cell or multi-cell cluster events measured at four days after seeding single MP65 or MP65 BAP1 WT and (D) MP46 or MP46 BAP1 WT cells in 3D Matrigel. Bar graphs show mean ± S.E.M. from triplicate experiments (N=3). *p≤0.05, **p≤0.01, ****p≤0.0001 by unpaired student’s t-test adjusted using the Hochberg method.
Figure 3:
Figure 3:. S6 phosphorylation is low in BAP1-deficient UM cells.
(A) Dot-plot showing proteins up- or down-regulated in MP65 BAP1 compared to MP65 parental cells and in a panel of BAP1 WT compared to BAP1-deficient UM cells. Results were derived from analysis of RPPA data and focused on proteins associated with cell proliferation. (B) Heatmap showing median centered log2-transformed expression of pS6 and S6 protein levels from RPPA data in a panel of BAP1-deficient and BAP1 WT UM cell lines. Statistical significance of the protein expression between BAP1-deficient and BAP1 WT was determined using Storey q-values (N=4). (C) Validation of pS6 protein levels in a UM cell line panel by Western blotting. (D) Violin plots of quantitation of pS6 from Western blots in (C) and determined by densitometry. pS6 levels shown were normalized to β-actin and S6. (E) Correlation coefficient of BAP1 and pS6 (Ser235/236) or pS6 (Ser240/244) levels from quantitation of blots in (C). (F) Western blot analysis of phosphorylated (p) S6, p70S6K1, and mTOR in MP65 or MP46 re-expressing BAP1 WT or BAP1 C91A. Representative blots from triplicate experiments or lysates (N=3) are shown. (G) Percentage of cells positive for pS6 (Ser235/236) in MP65 or MP46 parental cells and cells transduced with BAP1 WT. Data was collected from single and 2-cell clusters after 4 days of seeding in 3D Matrigel. Graphs show mean ± S.E.M. from triplicate experiments (N=3). *p≤0.05, **p≤0.01 by unpaired student’s t-test adjusted using the Hochberg method.
Figure 4:
Figure 4:. Mechanisms associated with low pS6 and slow proliferation of BAP1-deficient UM cells.
(A) Heatmap of expression of proteins associated with mTOR/S6 signaling in BAP1-deficient (MP46 and MP65) and BAP1 re-expressing (MP46 BAP1 WT and MP65 BAP1 WT) cells. Proteins that are differentially expressed between the BAP1-deficient and BAP1 re-expressing cells are shown. Statistical significance of the protein expression between BAP1-deficient and BAP1 re-expressing cells was determined using Storey q-values (N=4). (B) Western blot analysis of proteins associated with mTOR/S6 signaling. (C) BAP1 WT cells, 92.1 and MM66, were treated with 10mM metformin for 24 hours and then expression of mTOR signaling pathway proteins were evaluated by Western blotting. (D) Western blotting for pS6 levels in MP65 transduced with active S6K1 (S6K1 E389 ΔCT). (E) Cell confluency of MP65 and MP65 S6K1 delta Ct. Cell confluency was determined using the Incucyte® live cell imager and normalized to confluency at 0 hour. Mean ± S.E.M. of cell confluency from triplicate experiments (N=3) is shown. ****p≤0.0001 by unpaired student’s t-test adjusted using the Hochberg method. (F) pS6 levels determined by Western blotting in MP46 cells transduced with S6K1 WT. (G) Cell confluency of MP46 and MP46 S6K1 WT. Cell confluency was determined using the Incucyte® live cell imager and normalized to confluency at 0 hour. Mean ± S.E.M. of cell confluency from triplicate experiments (N=3) is shown. ***p≤0.001 by unpaired student’s t-test adjusted using the Hochberg method.
Figure 5:
Figure 5:. pS6 levels in UM patient tumors.
(A) Violin plots from single cell RNA sequencing data displaying average expression of ribosomal biogenesis genes regulated by S6K1 (RPS and RPL genes) in primary BAP1-deficient and BAP1 WT UM patient tumors (N = 6 and 2, respectively). Significance was assessed by the Mann-Whitney test, ***p< 0.001. Violin plots contain box and whisker plots, displaying the interquartile range, median, and minimum/maximum values. (B) Immunohistochemical staining of BAP1, Ki-67 and pS6 (Ser235/236) in liver metastatic UM patient specimens. 400x magnification. Scale bar, 20 μm. (C) Quantitation of BAP1, Ki-67, and pS6 staining in liver metastatic UM patient specimens. Three random fields at 400x magnification from 3 samples were captured and analyzed using ImageJ. *p≤0.05, **p≤0.01, ***p≤0.001 by unpaired student’s t-test s adjusted using the Hochberg method.
Figure 6:
Figure 6:. BAP1 mutant PDX models of metastatic UM patient specimens express low pS6 levels and proliferate slower in vivo.
(A) pS6 staining by immunohistochemistry in PDXs originating from UM patient metastatic samples. PDXs in a tissue microarray were stained for pS6 (Ser235/236), and staining was compared between BAP1 mutant (N=6) and WT (N=2) PDXs, assigned on the basis of the available sequencing data of mutations of the specimens. Scale bar, 600 μm. Three random fields (400x magnification) of pS6 staining were captured for each PDX and the intensity and abundance of pS6 staining (red/pink) were measured using ImageJ, right of the immunohistochemical staining. (B) Two BAP1 mutant PDXs and one BAP1 WT PDX were independently implanted intrahepatically into the liver of NSG mice, and tumor size was monitored by CT scanning. N=4 mice per PDX. ***p≤0.001 by the LME model with random effects of animals and a post-hoc analysis using the Hochberg method. (C) Representative transverse CT scans of the abdomen of mice 10 weeks after injection with the indicated PDX. (D and E) Quantitation of pS6 (Ser235/236) and Ki-67 immunohistochemical staining of PDXs isolated at the last time point following sacrifice. Eight to ten random fields (400x magnification) of pS6 and Ki-67 staining were captured for each PDX tissue, and the intensity and abundance of staining were measured using ImageJ. Data are the mean ± S.E.M. of staining (N=8–10). ***p≤0.001, ****p≤0.0001 by unpaired student’s t-test adjusted using the Hochberg method. (F) Representative images of immunohistochemical staining for pS6 and Ki-67 in the PDXs. Scale bar, 20 μm.
Figure 7:
Figure 7:. BAP1-deficient cells survive better under amino acid deprivation.
(A) BAP1 WT (92.1 and MM66) and BAP1-deficient (MP38 and MP65) cells were incubated in amino acid-free (AA-free) culture media for 3 days, and cell viability was detected by crystal violet staining. (B) As in (A) in MP65 cells, MP65 cells transfected with BAP1 WT, and MP65 cells transfected with S6K1 ΔCt. (C and D) Quantitation of crystal violet staining in (A) and (B), respectively. Data are mean ± S.E.M. from triplicate experiments (N=3). *p≤0.05, **p≤0.01, ***p≤0.001 by unpaired student’s t-test and p-values adjusted using the Hochberg method.

Similar articles

References

    1. Kaliki S, Shields CL. Uveal melanoma: relatively rare but deadly cancer. Eye (Lond). 2017;31(2):241–57. - PMC - PubMed
    1. Diener-West M, Reynolds SM, Agugliaro DJ, Caldwell R, Cumming K, Earle JD, et al. Development of metastatic disease after enrollment in the COMS trials for treatment of choroidal melanoma: Collaborative Ocular Melanoma Study Group Report No. 26. Arch Ophthalmol. 2005;123(12):1639–43. - PubMed
    1. Chua V, Mattei J, Han A, Johnston L, LiPira K, Selig SM, et al. The Latest on Uveal Melanoma Research and Clinical Trials: Updates from the Cure Ocular Melanoma (CURE OM) Science Meeting (2019). Clin Cancer Res. 2021;27(1):28–33. - PMC - PubMed
    1. Orloff M Clinical Trials in Metastatic Uveal Melanoma: Immunotherapy. Ocul Oncol Pathol. 2021;7(3):168–76. - PMC - PubMed
    1. Krantz BA, Dave N, Komatsubara KM, Marr BP, Carvajal RD. Uveal melanoma: epidemiology, etiology, and treatment of primary disease. Clin Ophthalmol. 2017;11:279–89. - PMC - PubMed

MeSH terms