. 2024 Sep:97:102902.
doi: 10.1016/j.jhealeco.2024.102902. Epub 2024 May 29.

Hospital behavior over the private equity life cycle

Affiliations

Hospital behavior over the private equity life cycle

Michael R Richards et al. J Health Econ. 2024 Sep.

Abstract

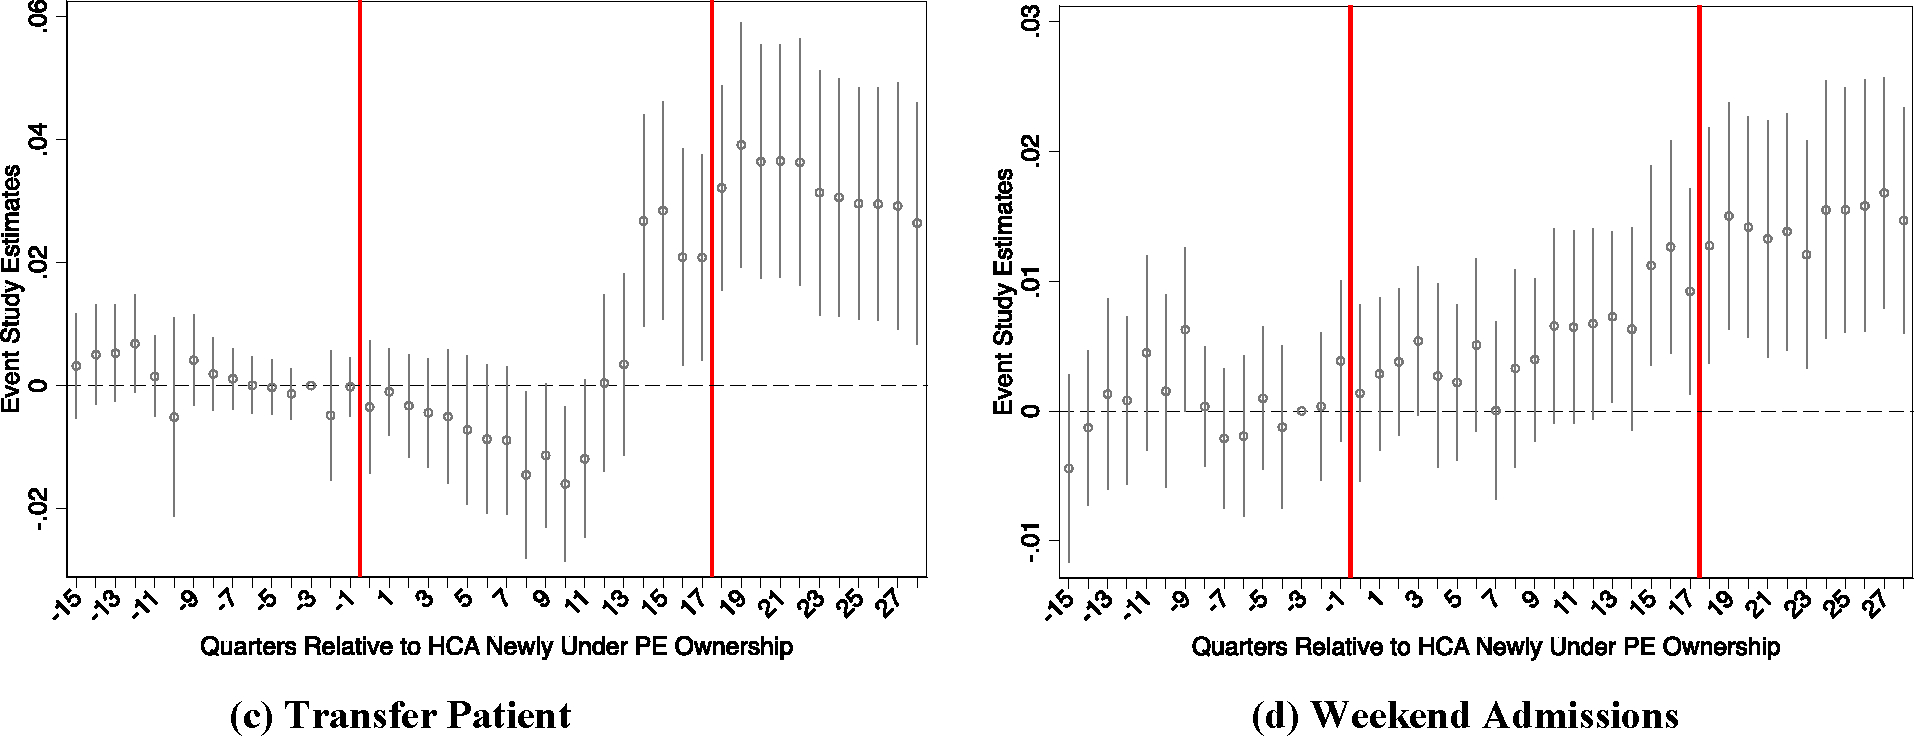
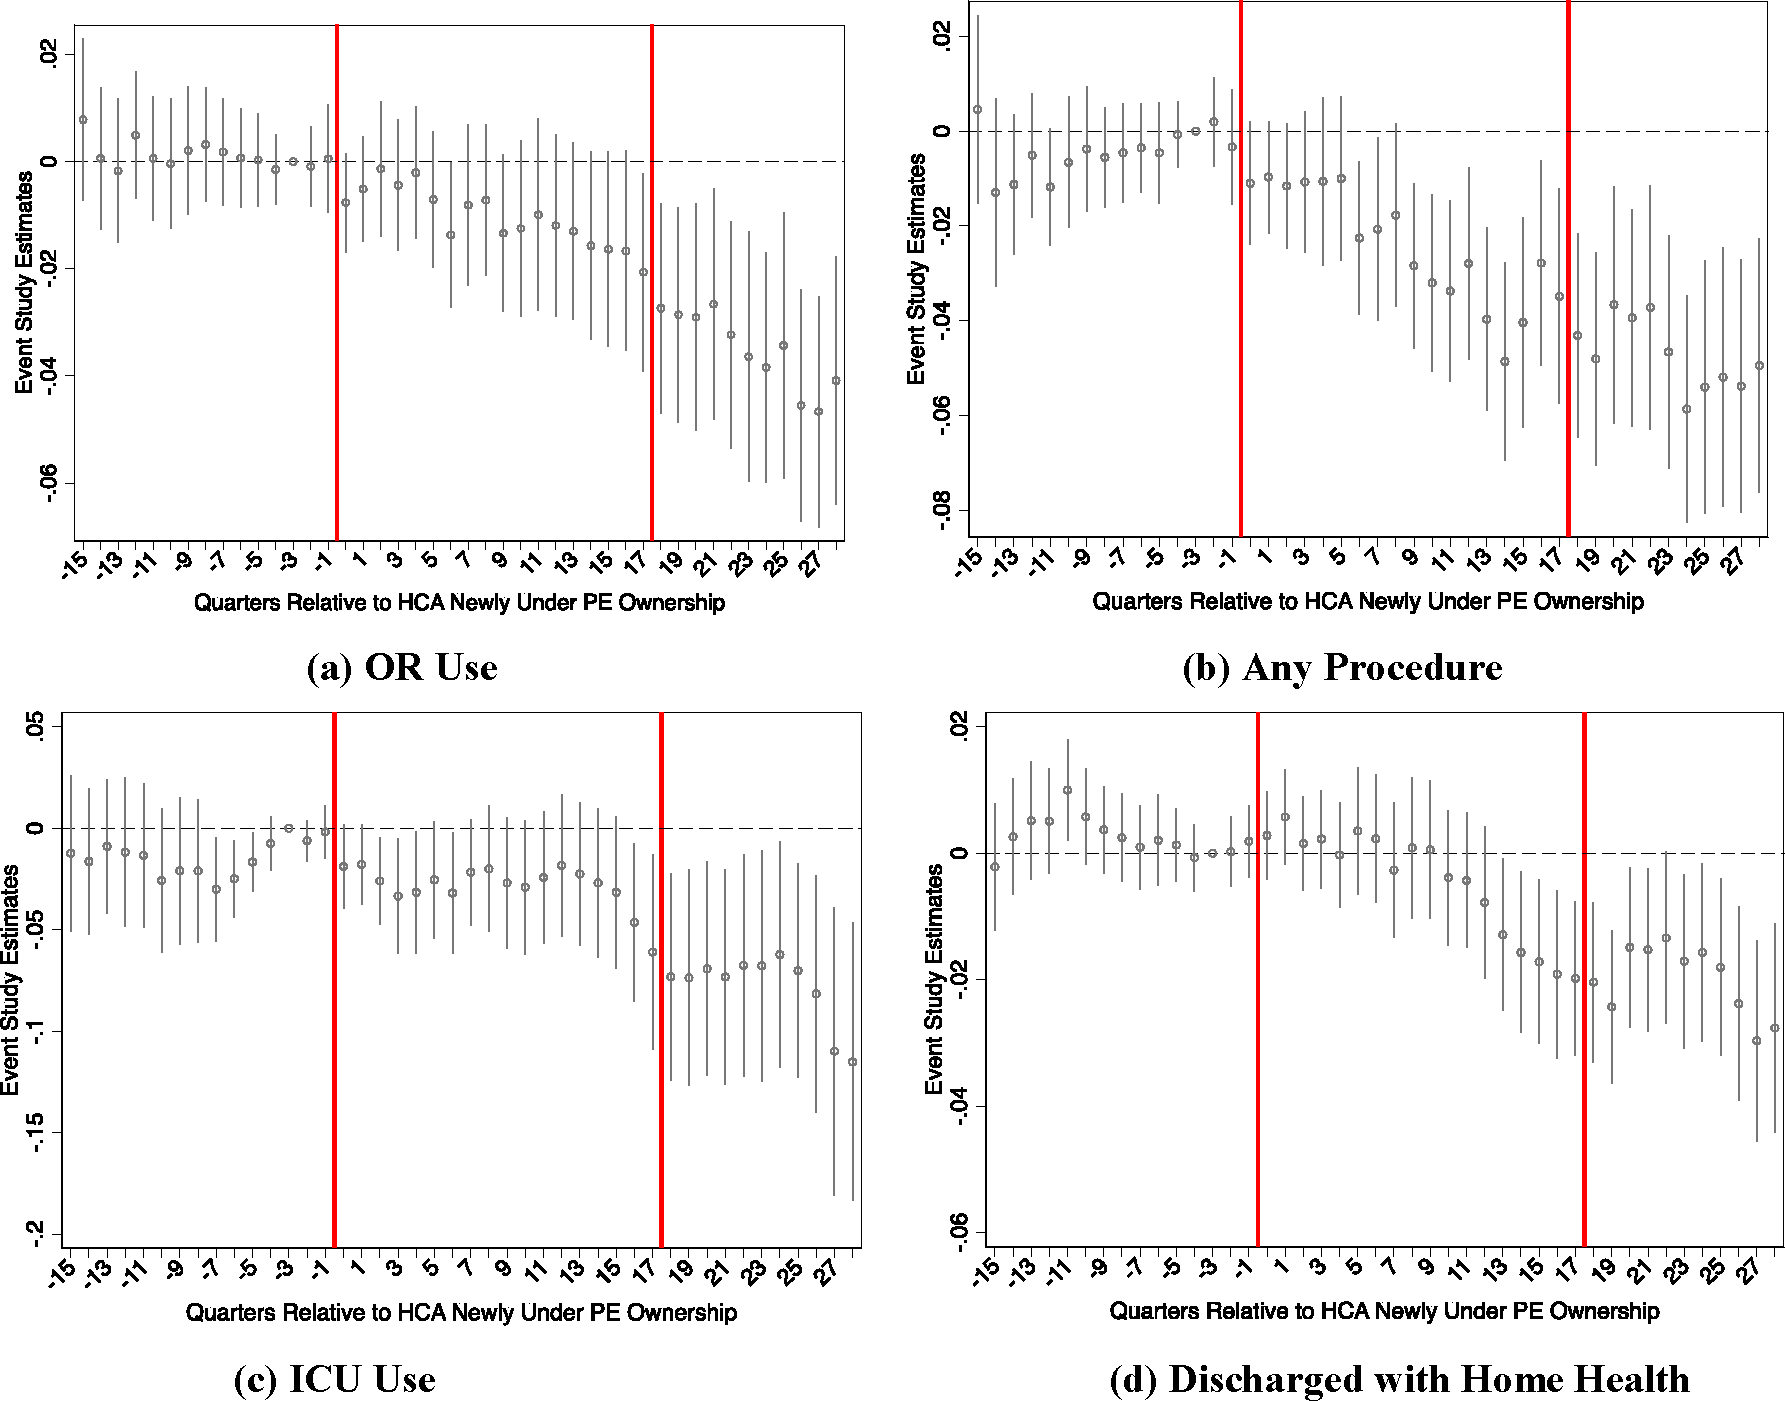
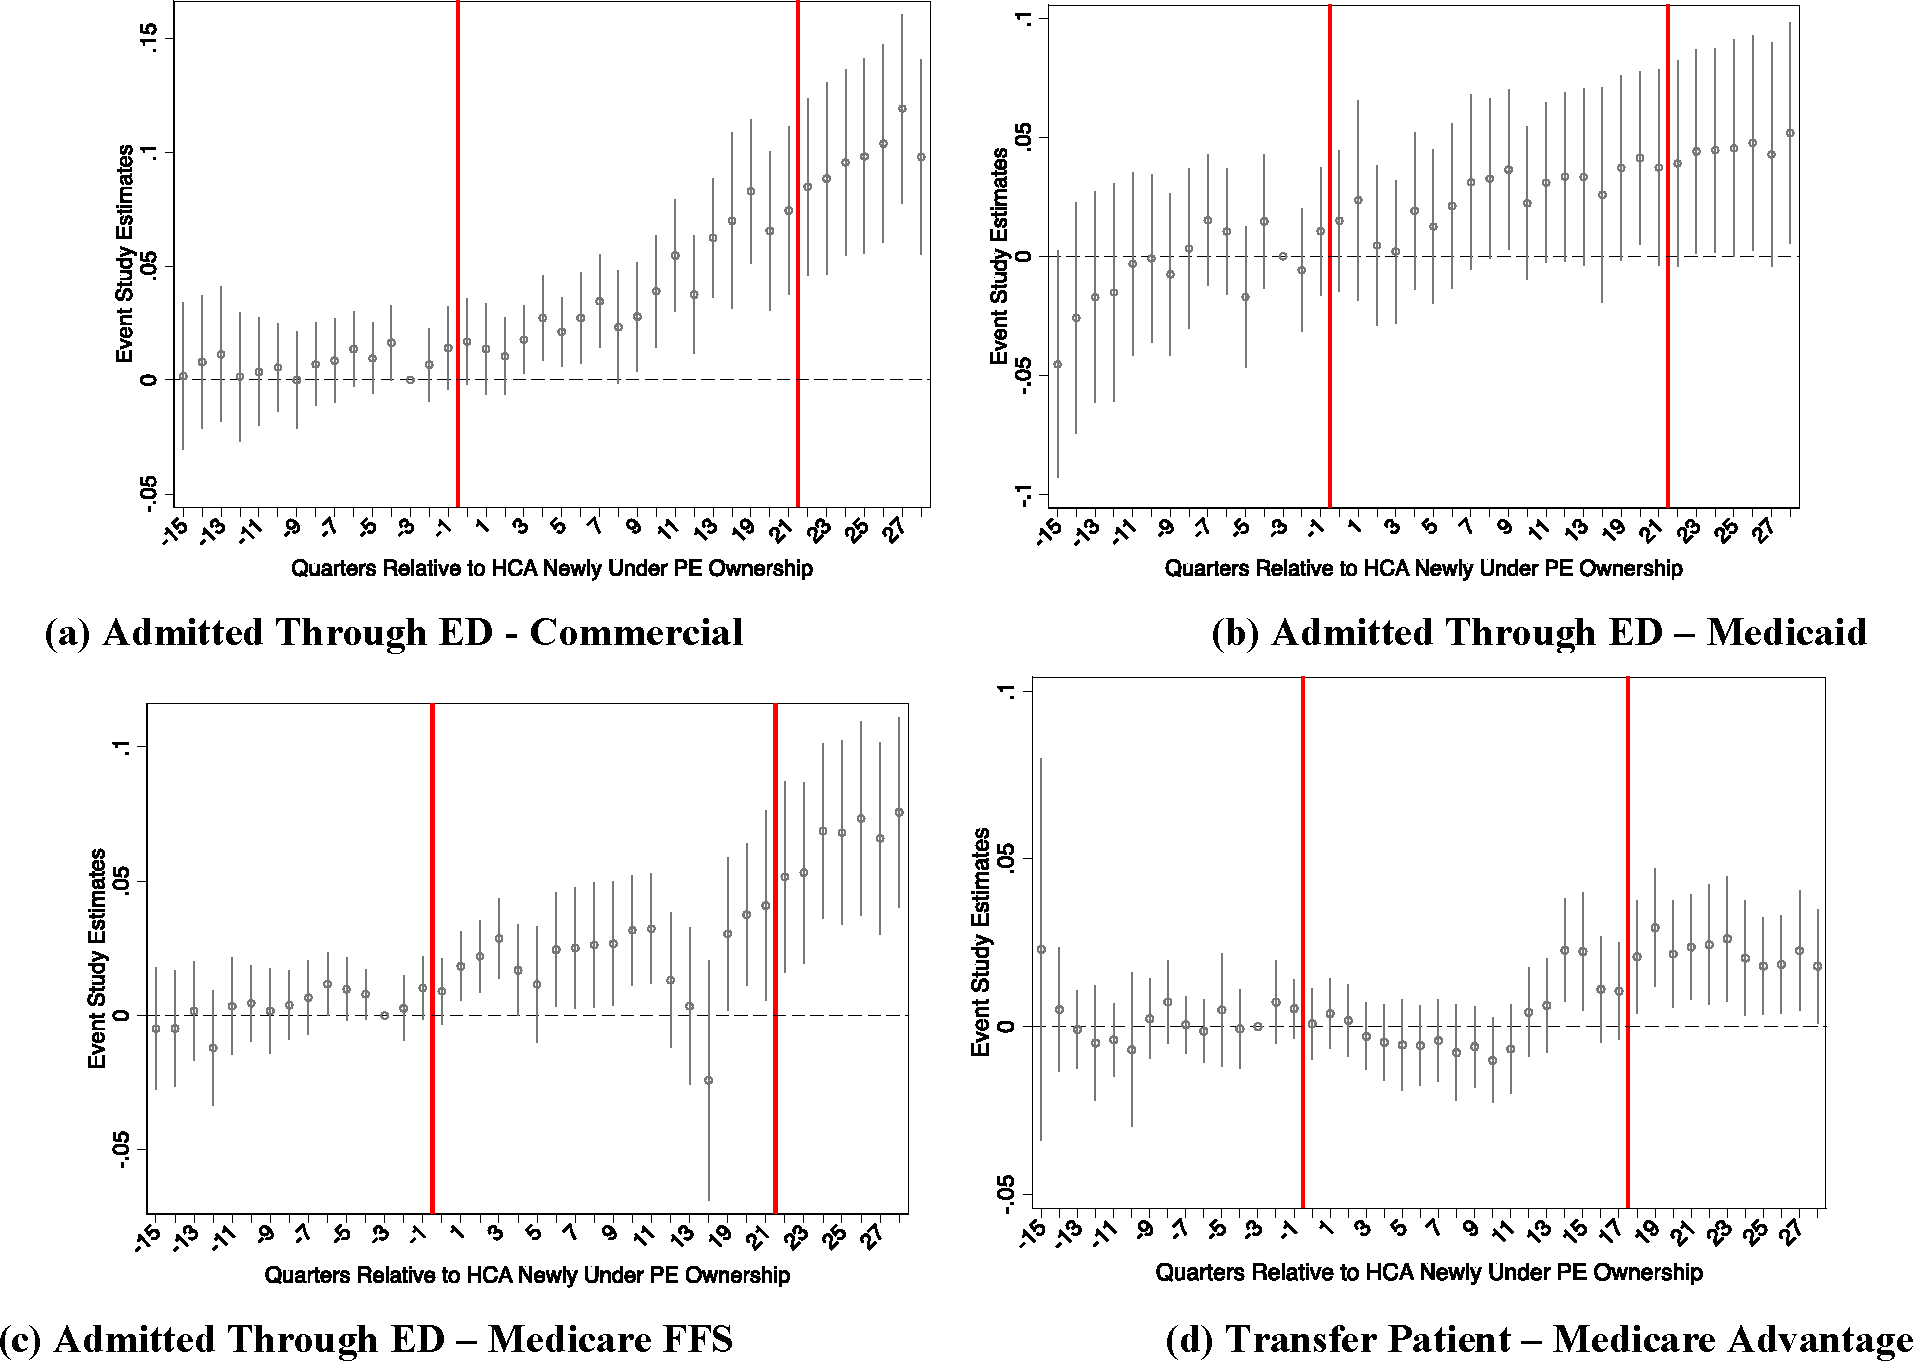
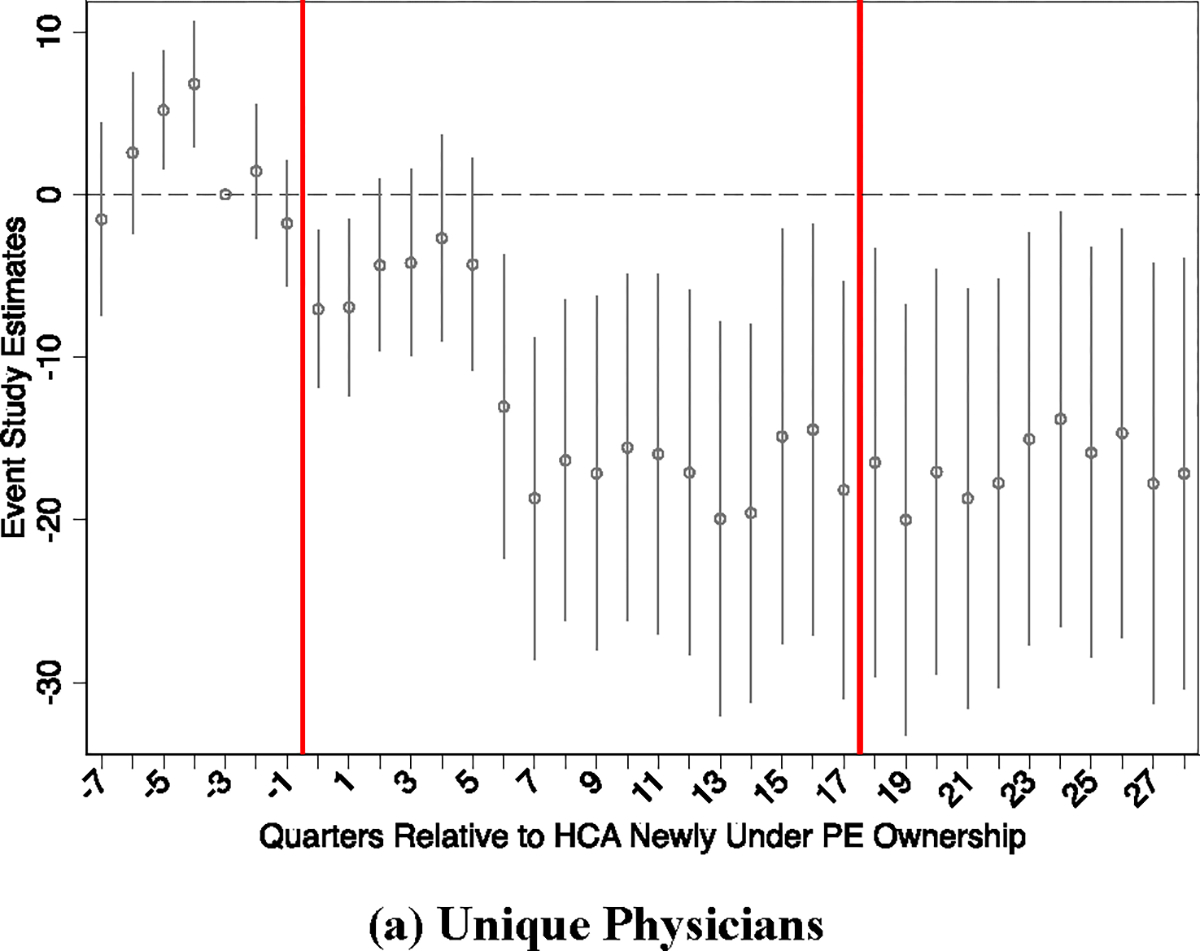
Private equity is an increasing presence in US healthcare, with unclear consequences. Leveraging unique data sources and difference-in-differences designs, we examine the largest private equity hospital takeover in history. The affected hospital chain sharply shifts its advertising strategy and pursues joint ventures with ambulatory surgery centers. Inpatient throughput is increased by allowing more patient transfers, and crucially, capturing more patients through the emergency department. The hospitals also manage shorter, less treatment-intensive stays for admitted patients. Outpatient surgical care volume declines, but remaining cases focus on higher complexity procedures. Importantly, behavior changes persist even after private equity divests.

Keywords: Hospital; Hospital outpatient care; Inpatient care; Private equity.


Conflict of interest statement

Declaration of competing interest None.

Figures

Fig 1.
Fig 1.. National HCA Advertising Spending over Time by Medium
Notes: Advertising data are from Kantar Media and span the first quarter of 2003 through the final quarter of 2017. Advertising expenditures are in thousands of dollars and nominal terms. The vertical dashed lines indicate the beginning and end of private equity ownership of the HCA hospital chain.
Fig 2.
Fig 2.. Diff-in-Diff Event Study Estimates for Private Equity Ownership Effects on HCA Advertising Expenditures
Notes: Advertising data are from Kantar Media. There are 181 control group units in panel (a), and 182 control group units in panel (b). Controls are comprised of large hospital chains and health systems.
Fig 3.
Fig 3.. Comparing HCA Ownership Stakes in Ambulatory Surgery Centers to Other Prominent Health Systems 2000 – 2014
Notes: Count of new ambulatory surgery center (ASC) ownership stakes made per year. ASC ownership information is from a FOIA request to the Centers for Medicare and Medicaid Services (CMS). Vertical dashed lines demarcate the years of private equity ownership for HCA.
Fig 4.
Fig 4.. Diff-in-Diff Event Study Estimates for Private Equity Ownership Effects on HCA ASC Ownership Stakes
Notes: Ownership data are from a FOIA request to CMS. There are 124 distinct control group units in the underlying estimation, which is a mix of large hospitals, health systems, ASC chains, and institutional investors.
Fig 5.
Fig 5.. Diff-in-Diff Event Study Estimates
Notes: Outcome definitions and analytic samples are identical to those reported in Appendix Table A2. Vertical bars bookend private equity ownership of HCA.
Fig 6.
Fig 6.. Diff-in-Diff Event Study Estimates
Notes: Outcome definitions and analytic samples are identical to those reported in Table 1. Vertical bars bookend private equity ownership of HCA.
Fig 6.
Fig 6.. Diff-in-Diff Event Study Estimates
Notes: Outcome definitions and analytic samples are identical to those reported in Table 1. Vertical bars bookend private equity ownership of HCA.
Fig 7.
Fig 7.. Diff-in-Diff Event Study Estimates
Notes: Outcome definitions and analytic samples are identical to those reported in Table 2. Vertical bars bookend private equity ownership of HCA.
Fig 7.
Fig 7.. Diff-in-Diff Event Study Estimates
Notes: Outcome definitions and analytic samples are identical to those reported in Table 2. Vertical bars bookend private equity ownership of HCA.
Fig 8.
Fig 8.. Diff-in-Diff Event Study Estimates
Notes: Outcome definitions and analytic samples are identical to those reported in Appendix Table A5. Vertical bars bookend private equity ownership of HCA.
Fig 8.
Fig 8.. Diff-in-Diff Event Study Estimates
Notes: Outcome definitions and analytic samples are identical to those reported in Appendix Table A5. Vertical bars bookend private equity ownership of HCA.
Fig 9.
Fig 9.. Diff-in-Diff Event Study Estimates
Notes: Outcome definitions and analytic samples are identical to those reported in Appendix Table A7. Vertical bars bookend private equity ownership of HCA.
Fig 9.
Fig 9.. Diff-in-Diff Event Study Estimates
Notes: Outcome definitions and analytic samples are identical to those reported in Appendix Table A7. Vertical bars bookend private equity ownership of HCA.
Fig 10.
Fig 10.. Diff-in-Diff Event Study Estimates
Notes: Outcome definitions and analytic samples are identical to those reported in Appendix Table A10. Vertical bars bookend private equity ownership of HCA.
Fig 11.
Fig 11.. Diff-in-Diff Event Study Estimates for Total Emergency Department Encounters by Payer
Notes: Outcome definitions and analytic samples are identical to those reported in Table 3. Vertical bars bookend private equity ownership of HCA
Fig 11.
Fig 11.. Diff-in-Diff Event Study Estimates for Total Emergency Department Encounters by Payer
Notes: Outcome definitions and analytic samples are identical to those reported in Table 3. Vertical bars bookend private equity ownership of HCA
Fig 12.
Fig 12.. Diff-in-Diff Event Study Estimates for Share of Emergency Department Encounters Resulting in Admission to Inpatient Unit by Payer
Notes: Outcome definitions and analytic samples are identical to those reported in Table 3. Recall, four quarters are unusable for the inpatient variable capturing admission through the ED due to a variable definition and reporting requirement transition; thus, those quarters are dropped from the analyses. Vertical bars bookend private equity ownership of HCA.
Fig 13.
Fig 13.. Diff-in-Diff Event Study Estimates for Number of Unique Physicians Staffing the Emergency Department and the Likelihood of Using Any Nurse Practitioners or Physician Assistants in the Emergency Department
Notes: Analytic samples and estimation parallel those from Figures 11 and 12. In 2005, the Florida HCA hospitals had 73.7 unique physicians (MDs or DOs) staffing their emergency department (ED) in a given quarter-year. An NP or PA was listed as the main ED provider in only 0.3% of ED visits in a given quarter-year for these same hospitals during the 2005 period. Vertical bars bookend private equity ownership of HCA.

References

    1. Agrawal Ashwini, and Tambe Prasanna. 2016. “Private Equity and Workers’ Career Paths: The Role of Technological Change.” Review of Financial Studies, 29 (9): 2455–2489.
    1. AHA. 2020. TrendWatch Chartbook. American Hospital Association. Available at https://www.aha.org/system/files/media/file/2020/10/TrendwatchChartbook-....
    1. Antoni Manfred, Maug Ernst, and Obernberger Stefan. 2019. “Private Equity and Human Capital Risk.” Journal of Financial Economics, 133 (3): 634–657.
    1. Appelbaum Eileen, and Bratt Rosemary. 2020. “Private Equity Buyouts in Healthcare: Who Wins, Who Loses?” Institute for New Economic Thinking Working Paper Series No. 118. Available at SSRN: https://ssrn.com/abstract=3593887.
    1. Bain & Company. 2022. “Global Healthcare Private Equity and M&A Report 2022. Available online: https://www.bain.com/globalassets/noindex/2022/bain_report_global_health....

LinkOut - more resources