. 2024 Jun 10;42(6):1051-1066.e7.
doi: 10.1016/j.ccell.2024.05.013.

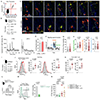
Interruption of the intratumor CD8+ T cell:Treg crosstalk improves the efficacy of PD-1 immunotherapy

Affiliations

Interruption of the intratumor CD8+ T cell:Treg crosstalk improves the efficacy of PD-1 immunotherapy

Shannon N Geels et al. Cancer Cell. .

Abstract

PD-1 blockade unleashes potent antitumor activity in CD8+ T cells but can also promote immunosuppressive T regulatory (Treg) cells, which may worsen the response to immunotherapy. Tumor-Treg inhibition is a promising strategy to improve the efficacy of checkpoint blockade immunotherapy; however, our understanding of the mechanisms supporting tumor-Tregs during PD-1 immunotherapy is incomplete. Here, we show that PD-1 blockade increases tumor-Tregs in mouse models of melanoma and metastatic melanoma patients. Mechanistically, Treg accumulation is not caused by Treg-intrinsic inhibition of PD-1 signaling but depends on an indirect effect of activated CD8+ T cells. CD8+ T cells produce IL-2 and colocalize with Tregs in mouse and human melanomas. IL-2 upregulates the anti-apoptotic protein ICOS on tumor-Tregs, promoting their accumulation. Inhibition of ICOS signaling before PD-1 immunotherapy improves control over immunogenic melanoma. Thus, interrupting the intratumor CD8+ T cell:Treg crosstalk represents a strategy to enhance the therapeutic efficacy of PD-1 immunotherapy.

Keywords: CD8(+) T cells; F-IVM; ICOS; IL-2; PD-1; T regulatory cells; Treg; functional intravital microscopy; melanoma; tumor tolerance.


Conflict of interest statement

Declaration of interests T.R.M. is a founder and shareholder in Monopteros Therapeutics, Inc. This commercial relationship is unrelated to this study.

Figures

Figure 1.
Figure 1.. PD-1 blockade increases tumor-Treg counts.
A. Scheme to assess the impact of αPD-1 on tumor T cells. B-D. Treg (B), CD8+ T cell (C), and Th cell (D) numbers per mg of tumor in mice bearing D4M or D4M-S melanomas ± αPD-1. E, F. Histograms (E) and Ki67 quantification (F) in tumor-Treg and CD8+ T cells. G. Foxp3, GITR, and ICOS MFI in tumor-Tregs. For B-G, n=25 (D4M) and 12-14 (D4M-S) mice/group from 5 (D4M) or 3 (D4M-S) experiments. Bars depict medians. p values by Mann-Whitney U test. H. Treg quantification in the indicated datasets. p values by paired Student’s t-test. I. Comparison of patients with increased Tregs after PD-1 blockade in the indicated datasets. p value by one-sample t-test against the theoretical value of 50%. The solid bar represents the mean. See also Figure S1.
Figure 2.
Figure 2.. αPD-1-mediated Treg increase hinders tumor rejection.
A. Scheme for partial Treg ablation. B. Tumor-Treg fold increase over the isotype group. The dotted line indicates the threshold for increased Tregs (the mean between the highest isotype and lowest αPD-1 sample values). n=9 (Iso) 10 (αPD-1) and 27 (αPD-1+DT) mice/group from two experiments. Bars depict the median value of the distribution. p values by Mann-Whitney U test. C. Tumor weight in mice treated as indicated. Mice treated with αPD-1+DT were stratified by Treg Hi (n=14) and Low (n=13). Rectangles indicate the tumor weight range in isotype-treated animals. p values by chi-squared test. See also Figure S2.
Figure 3.
Figure 3.. Indirect mechanisms drive tumor-Treg accumulation after PD-1 blockade.
A. Salsa6f expression in lymph node Tregs from a representative tamoxifen-treated Foxp3creERT2xRosa26LSL-Salsa6f mouse. B. Scheme for F-IVM. C. Image sequences illustrating tumor-Treg motility and Ca2+ signaling reported by Salsa6f, with or without αPD-1. Arrows and dotted lines highlight the tracked Tregs. Time in min:sec. D. GFP intensity in representative Treg tracks. The track-specific baseline is depicted in grey. E. Percentage of Treg tracks displaying at least one signaling peak. Mean ± SEM is shown. p values by Student’s t-test. F. Illustration of track segments and associated parameters. G. Percentage of time a Treg is signaling. H. Quantification of maximum GFP fluorescence, signaling duration, and AUC for individual signaling segments. For C-H, we analyzed 5 control and 7 αPD-1 movies, corresponding to 115 control and 207 αPD-1 Treg tracks and 41 control and 86 αPD-1 signaling segments. I. Scheme of phospho-flow cytometry. J, K. Representative histograms and quantification of pZap70 and pAkt in Tregs (J) and CD8+ T cells (K) from D4M-S tumors ± PD-1 blockade. n=10 mice/group from two experiments. L. Scheme of Treg-specific PD-1 deletion experiments. M. Quantification of PD-1 expression in tumor-Tregs within tamoxifen-treated Foxp3creERT2 or Foxp3creERT2xPdcd1f/f mice. Mean ± SEM is depicted. p values by Student’s t-test. N. Tumor-Treg counts in Foxp3creERT2 or Foxp3creERT2xPdcd1f/f mice ± αPD-1 treatment. n=12 to 14 mice/group from three independent experiments. In G, H, J, K, and N, bars represent medians, and p values are calculated by Mann-Whitney U test. See also Figure S3 and Videos S1, S2.
Figure 4.
Figure 4.. CD8+ T cells and IL-2 orchestrate tumor-Treg accumulation after PD-1 blockade.
A. Image of a D4M-S tumor from a Foxp3GFPxE8IcrexRosa26LSL-Tomato mouse. Three regions of interest are magnified on the right. One tumor representative of three is shown. B. Distribution of Treg distance to the closest CD8+ T cell in the original image and after randomization of Treg positions. p values by Kolmogorov-Smirnov test. C. Scheme for CD8+ T cell depletion experiments. D. Treg numbers in D4M-S tumor-bearing mice ± αPD-1 and CD8-depleting antibodies. E. MFI of NucView (active caspase-3/7) in Tregs from D4M-S melanomas ± αPD-1 and CD8-depleting antibodies. For D and E, n=7-10 mice/group from 2 independent experiments. F. Scheme to determine the source of IL-2. G. Dot plot of IL-2-transcribing cells (GFP+) in an Il2GFP mouse with a wild-type mouse shown in the inset. CD8 and CD4 expression was quantified on GFP+ cells. H. Proportions of CD4+ and CD8+ T cells among IL-2 producers in tdLN and D4M-S melanomas treated as indicated. Mean ± SEM of three independent experiments is depicted. p values by Student’s t-test. I. Scheme for IL-2 protein quantification ± αPD-1. J, K. Percentage (J) and counts (K) of IL-2-producing CD8+ T cells ± αPD-1. n=18 mice/group in four experiments. L. Scheme for IL-2 neutralization. M, N. Treg numbers, Ki67 expression (M), and CD8+ T cell counts (N) in D4M-S bearing mice ± αPD-1 and IL-2 neutralization. O. Scheme to assess the response of PD-1-deficient tumor-Tregs to IL-2i.c. P. Treg numbers within D4M-S tumors ± IL-2i.c. For J-P, n=9-12 mice/group from 2 experiments. In D, E, and J-P bars depict medians, and p values by Mann-Whitney U test. See also Figure S4.
Figure 5.
Figure 5.. ICOS mediates IL-2-driven tumor-Treg accumulation.
A. Scheme for administration of αPD-1 and IL-2i.c. B-F. Numbers (B), Ki67 (C), Bim (D), Bcl-2, Bcl-xL, Mcl-1 (E), and ICOS expression (F) in tumor-Tregs treated with PD-1 blockade ± IL-2i.c. G. Scheme for ICOSL blockade. H. Tumor-Treg numbers upon treatment with αPD-1 and αICOSL, ± IL-2i.c. For B-H, n=10-16 mice/group from 2-3 experiments. I. Scheme to quantify ICOS expression after PD-1 blockade and CD8+ T cell depletion. J. ICOS expression in tumor-Tregs ± αPD-1 and CD8+ T cell depletion. The dotted line represents the median of the isotype control group. n=8-10 mice/group from 2 independent experiments. For B-J, bars depict medians and p values by Mann-Whitney U test. K. Scheme for bone marrow chimera experiments evaluating the role of ICOS signaling in tumor-Tregs during PD-1 blockade. L. ICOS expression in tumor-Tregs after DT administration. M. Tumor-Treg percentage in the indicated groups. Median, interquartile range, and Tukey whiskers are depicted. N. Fold change of tumor-Treg percentage after PD-1 blockade, compared to isotype treatment. Separate fold change values were calculated for control and ICOS-deficient Tregs. Mean and standard deviation are depicted, and the p value was calculated by Student’s t-test with Welch correction. n=4-5 mice/group. See also Figure S5.
Figure 6.
Figure 6.. CD8+ T cell:Treg crosstalk in human melanomas.
A. CellChat analysis of communication pathways in human melanoma. TCF7-expressing memory T cells and Tregs correspond to clusters 10 and 7 of reference. The volcano plot depicts the ratio of communication score after compared to before PD-1 immunotherapy, and the p value (Mann-Whitney test) of ligand upregulation following PD-1 blockade. The IL-2/IL2Rαβγ pathway is highlighted in red. All other interactions with a finite log-fold change of communication probability are shown in grey. B. Immunofluorescence of human melanoma treated as indicated. Images from all three analyzed patients are shown. C. Magnification of Treg and CD8+ T cell clusters shown in B. D. Distribution of Treg distance to the closest CD8+ T cell cluster in the original image and after randomization of Treg positions. The depicted graphs were generated from whole tumors (treatment naïve and αPD-1+αCTLA-4) or a representative region (zone 2 for αPD-1, Fig. S6C,D). E. Single- and multi-channel images depicting the distribution of ICOS-expressing Tregs relative to a CD8+ T cell cluster. F. Quantification of ICOS+ and ICOS Treg distance to the closest CD8+ T cell cluster. One representative analysis out of three tumors is shown. p values by Kolmogorov-Smirnov test. See also Figure S6.
Figure 7.
Figure 7.. Effectiveness of sequential, but not concomitant, ICOSL/PD-1 immunotherapy.
A. Scheme for concomitant ICOSL/PD-1 therapy. B. Growth curves of D4M-S tumors in mice treated with αICOSL or αPD-1 antibodies individually or in combination. C. Scheme to characterize the effects of concomitant ICOSL/PD-1 therapy on T cells and APCs. D. Treg, CD8+ T cell, and Th cell numbers in D4M-S melanomas treated with αPD-1 or αICOSL antibodies. E. Heatmap depicting cell numbers, Lamp-1, granzyme B expression, and number of IFNγ and TNF-producing cells per mg of tumor after concomitant ICOSL/PD-1 blockade. Colors represent the median of all experimental values, normalized by the average of the isotype/isotype group. F. Scheme to investigate the effect of sequential ICOSL/PD-1 blockade on T cells and APCs. G, H. T cell counts (G) and heatmap summarizing T cell functions (H) upon sequential αICOSL/αPD-1 immunotherapy. For C-H, n=8-10 mice/group from 2 experiments. Bars depict medians. p values by Mann-Whitney U test. I. Scheme for sequential ICOSL/PD-1 immunotherapy. J. Growth curves of D4M-S tumors in mice treated with monotherapies or sequential ICOSL/PD-1 immunotherapy. For B and J, each line represents one mouse. n=10 mice/group from 2 separate experiments. p values by type II Anova with Holm post-test. See also Figure S7.

Update of

References

    1. Borghaei H, Paz-Ares L, Horn L, Spigel DR, Steins M, Ready NE, Chow LQ, Vokes EE, Felip E, Holgado E, et al. (2015). Nivolumab versus docetaxel in advanced nonsquamous non-small-cell lung cancer. New England Journal of Medicine 373, 1627–1639. 10.1056/NEJMoa1507643. - DOI - PMC - PubMed
    1. Ferris RL, Blumenschein G, Fayette J, Guigay J, Colevas AD, Licitra L, Harrington K, Kasper S, Vokes EE, Even C, et al. (2016). Nivolumab for recurrent squamous-cell carcinoma of the head and neck. New England Journal of Medicine 375, 1856–1867. 10.1056/NEJMoa1602252. - DOI - PMC - PubMed
    1. Nghiem PT, Bhatia S, Lipson EJ, Kudchadkar RR, Miller NJ, Annamalai L, Berry S, Chartash EK, Daud A, Fling SP, et al. (2016). PD-1 blockade with pembrolizumab in advanced merkel-cell carcinoma. New England Journal of Medicine 374, 2542–2552. 10.1056/NEJMoa1603702. - DOI - PMC - PubMed
    1. Migden MR, Rischin D, Schmults CD, Guminski A, Hauschild A, Lewis KD, Chung CH, Hernandez-Aya L, Lim AM, Chang ALS, et al. (2018). PD-1 Blockade with Cemiplimab in Advanced Cutaneous Squamous-Cell Carcinoma. New England Journal of Medicine, 341–351. 10.1056/nejmoa1805131. - DOI - PubMed
    1. Motzer RJ, Tannir NM, McDermott DF, Arén Frontera O, Melichar B, Choueiri TK, Plimack ER, Barthélémy P, Porta C, George S, et al. (2018). Nivolumab plus Ipilimumab versus Sunitinib in advanced renal-cell carcinoma. New England Journal of Medicine 378, 1277–1290. 10.1056/NEJMoa1712126. - DOI - PMC - PubMed

MeSH terms

Substances