. 2024 Jul 11;187(14):3726-3740.e43.
doi: 10.1016/j.cell.2024.05.025. Epub 2024 Jun 10.

Modulation of FGF pathway signaling and vascular differentiation using designed oligomeric assemblies

Affiliations

Modulation of FGF pathway signaling and vascular differentiation using designed oligomeric assemblies

Natasha I Edman et al. Cell. .

Abstract

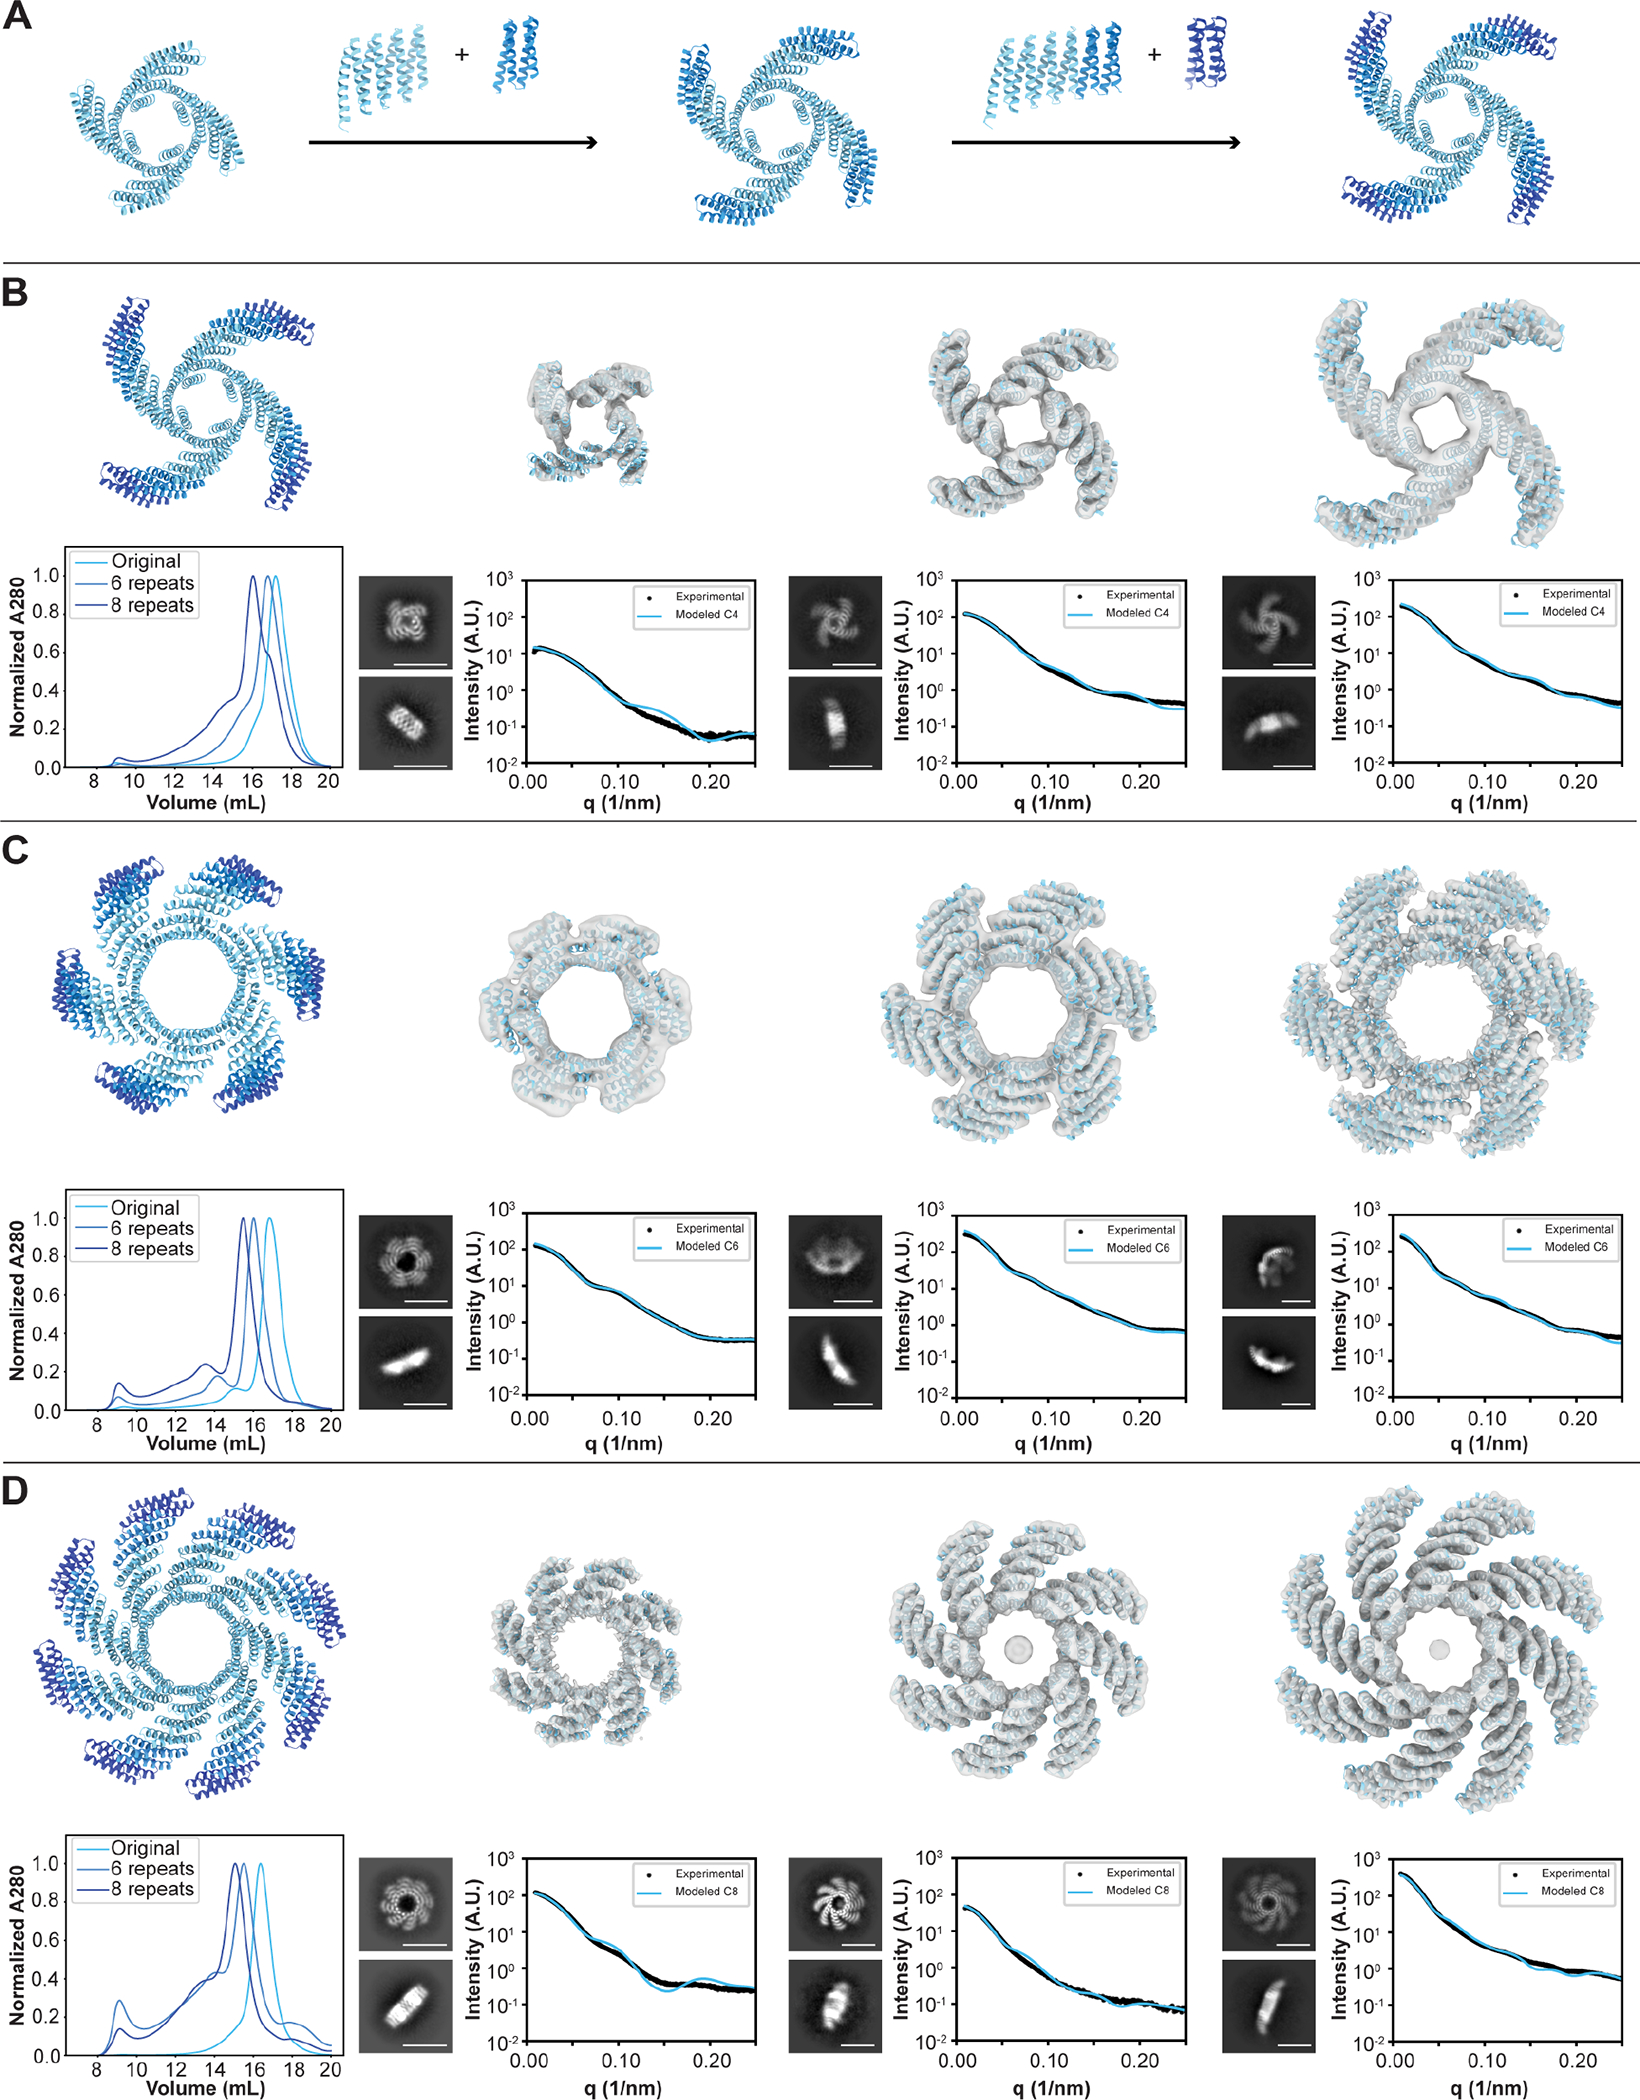
Many growth factors and cytokines signal by binding to the extracellular domains of their receptors and driving association and transphosphorylation of the receptor intracellular tyrosine kinase domains, initiating downstream signaling cascades. To enable systematic exploration of how receptor valency and geometry affect signaling outcomes, we designed cyclic homo-oligomers with up to 8 subunits using repeat protein building blocks that can be modularly extended. By incorporating a de novo-designed fibroblast growth factor receptor (FGFR)-binding module into these scaffolds, we generated a series of synthetic signaling ligands that exhibit potent valency- and geometry-dependent Ca2+ release and mitogen-activated protein kinase (MAPK) pathway activation. The high specificity of the designed agonists reveals distinct roles for two FGFR splice variants in driving arterial endothelium and perivascular cell fates during early vascular development. Our designed modular assemblies should be broadly useful for unraveling the complexities of signaling in key developmental transitions and for developing future therapeutic applications.

Keywords: FGF signaling; binder design; cryo-EM; de novo protein design; endothelial cell differentiation; iPSCs; oligomeric scaffolds; vascular development.


Conflict of interest statement

Declaration of interests L.S., D.B., N.I.E., T.S., A.E., A.F., W.Y., D.R.H., B.C., H.R.-B., A.P., R.L.R., G.B., and D.C.E. are coinventors on a patent application that has been filed by the University of Washington.

Figures

Figure 1:
Figure 1:. Biophysical characterization of designed protein oligomers.
From left to right: design model, size-exclusion chromatogram, SAXS data comparison of model to experimental data (A) C4–181, (B) C4–717, (C) C6–714, (D) C6–46, (E) C4–131 design model, size-exclusion chromatogram, SAXS data analysis, Right: cryo-EM 2D class average, cryo-EM map overlay to design model (cyan) top and side view (F) C4–81 design model, size-exclusion chromatogram, SAXS data analysis, Right: cryo-EM 2D class average, cryo-EM map superimposed to design model (cyan) top and side view (G) C6–79 SEC characterization and SAXS fit using both the C8 design model and the C6 dock. Right: cryo-EM 2D class average, cryo-EM map superimposed to design model top and side view. Scale Bar: 10 nm (E,F,G) See also Figures S1–2, S5 and Tables S1–5.
Figure 2:
Figure 2:. Repeat extensions of designed oligomers.
(A) Depiction of DHR-based repeat extension for oligomers. Each extension unit consists of 2 repeats. (B) C4–71 4-repeat, 6-repeat and 8-repeat cryo-EM maps superimposed with design model, top and side-view class averages and SAXS characterization below the cryo-EM maps of the different repeat extension variants. Bottom Left: SEC overlay of the individual structures. (C) C6–71 4-repeat, 6-repeat and 8-repeat cryo-EM maps superimposed with design model, top and side-view class averages and SAXS characterization below the cryo-EM maps of the different repeat extension variants. Bottom Left: SEC overlay of the individual structures. (D) C8–71 4-repeat, 6-repeat and 8-repeat cryo-EM maps superimposed with design model, top and side-view class averages and SAXS characterization below the cryo-EM maps of the different repeat extension variants. Bottom Left: SEC overlay of the individual structures. Scale Bar: 10 nm (B,C,D). See also Figures S3–4, S6–8 and Tables S2–5.
Figure 3:
Figure 3:. Cryo-EM structural analysis.
(A) C6–79 alignment of design model (grey) with cryo-EM structure (cyan) in top and side view. Structures align well with an RMSD of 2.85 Å (B) C8–71 alignment of design model (grey) with cryo-EM structure (cyan) in top and side view. Structures are in good agreement with an RMSD of 1.79 Å. See also Figures S9–S12 and Tables S4–6.
Figure 4:
Figure 4:. Modulation of FGFR signaling by designed agonists.
(A) Cartoon model of C6–79C_mb7 oligomer (blue and purple) engaging six FGF receptors (grey). Top left: Cartoon model of mb7 engaging FGFR4 domain 3 (PDB ID: 7N1J). Right: Natural geometry of signaling competent FGF2 (yellow) with FGFR1c (grey) and heparin (red) (PDB ID: 1FQ9) together with superimposed mb7 (purple). (B) Signaling response to a library of oligomers presenting mb7 in CHO-R1c cells, analyzed through western blot. Top: Cartoons of oligomers presenting mb7 at their N- or C-termini; distances between neighboring chains are shown above their respective treatments. Total FGFR1 and ERK loading controls can be found in Figure S14. (C) Dose-response curves of selected designs via phosphoflow for pERK1/2 stimulation. Error bars represent SEM from three independent biological repeats. (D) Single-particle tracking of FGFR1 molecules on the cell surface. (E) Intensity histograms of receptor clusters on the cell surface reveals receptor clustering induced via oligomerization. (F) Signaling response (pERK and pFGFR1) to FGF2, mb7, C6–79C_mb7 or mb7 + FGF2 in L6-R1c (top) or L6-R1b (bottom) cells, analyzed through western blot. (G) Dose-response curves of selected designs, assessed through intracellular calcium release. Error bars represent SEM from three independent biological repeats. (H) Comparison of a calcium intensity signaling trajectory after treatment with FGF2 (with or without heparin) or C6–79C_mb7 at 10 nM each. Right: Exemplary images comparing the calcium response exhibited in CHO-R1c cells following treatment with FGF2 or C6–79C_mb7 at 10 nM across three different timepoints (0:00, 2:20 and 7:30 min). Scale Bar: 2 μm (D), 50 μm (H). See also Figures S13–S22.
Figure 5:
Figure 5:. Control over vascular differentiation with designed agonists and antagonists.
(A) UMAP embeddings of all sequenced cells colored by day of harvest, along with given cluster annotations. (B) Proportion of endothelial or perivascular cells generated at Day 14 following treatment with FGF2, C2–58-2X_mb7, C6–79C_mb7, mb7 alone, or mb7 in combination with FGF2. Error bars represent SEM from 3 independent biological repeats. (C) Immunohistochemical characterization of differentiated cells treated with C6–79C_mb7 or mb7 in combination with FGF2, with PDGFR-B and CD31 to specifically mark perivascular and endothelial cells, respectively. Scale bar: 200 μm. (D) Quantitative analysis of a select panel of endothelial (VE-Cadherin, CD31, CLND5) and perivascular (PDGFR-B, ACTA2, NG2) markers using Flow Cytometry. Left: Representative 2D scatter plots; Right: Summarized results with mean and SEM from 3 independent biological repeats. (E) F-actin assembly. Left: Representative immunofluorescence images from FGF2, C6–79C_mb7 and mb7 + FGF2-derived cells (PDGFR-B: Perivascular cells, PHAL: F-actin). Scale bar: 100 μm; Right: Summarized per-cell Phalloidin (PHAL) intensity from 3 independent biological repeats (7 randomly chosen field of views from each). (F) 2D Network formation. Normalized count of nodes, segments and meshes after 24 hours, summarized from 3 independent biological repeats (5 randomly chosen fields of view from each) (G) Cell migration. Percentage closure of inflicted scratch area after 6 and 24 hours, summarized from 3 independent biological repeats (3 randomly chosen field of views from each) (H) LDL uptake. Representative flow cytometry of fluorescently labeled LDL uptake by cells generated using FGF2, C6–79C_mb7 and mb7 + FGF2 after 4 hours of treatment. Mean and SEM are reported from 3 independent biological repeats (I) Cytokine challenge assay. Representative immunofluorescence images of cells treated with TNF-a (10 ng/mL) for 24 hours, summarized from 3 independent biological repeats (5 randomly chosen fields from each) (VCAM1: Vascular cell adhesion molecule 1). Scale Bar: 100 μm. See also Figures S23, S24 and Table S7.
Figure 6:
Figure 6:. Control over endothelial subtype fate via isoform specific agonism.
(A) Left: UMAP embeddings of sub-clustered endothelial cells, colored by arteriovenous cell specificity. Middle: Density plots showing specific endothelial subtype populations enriched by the individual treatments. Right: Proportion of arterial or venous endothelial cells generated at Day 14 following treatment with No FGF, FGF2 or C6-79C_mb7. (B) Top: Representative immunofluorescence images of blood vessel organoids (BVOs) generated using FGF2 or C6-79C_mb7. Vascular networks are marked with VE-Cadherin and arterial-like endothelial cells are marked with EFNB2. Scale bars: (Whole) - 200 μm, (Inset) - 50 μm. Bottom: Per-organoid quantification of EFNB2, summarizing 10 independently generated organoids from each treatment. (C) Immunohistochemical characterization of BVOs transplanted under the mouse kidney capsule. Scale Bar: (Whole): 200 μm, (Inset) - 100 μm. See also Figures S25 and S26.
Figure 7:
Figure 7:. Control over vascular differentiation.
At the first bifurcation, the designs enable selective formation of endothelial or perivascular cells, and in subsequent endothelial cell differentiation, synthetic agonist treatments bias towards arterial fate.

Update of

References

    1. Garcia-Parajo MF, Cambi A, Torreno-Pina JA, Thompson N, and Jacobson K (2014). Nanoclustering as a dominant feature of plasma membrane organization. J. Cell Sci. 127, 4995–5005. 10.1242/jcs.146340. - DOI - PMC - PubMed
    1. Wu H (2013). Higher-order assemblies in a new paradigm of signal transduction. Cell 153, 287–292. 10.1016/J.CELL.2013.03.013. - DOI - PMC - PubMed
    1. Mayer BJ, and Yu J (2018). Protein Clusters in Phosphotyrosine Signal Transduction. J. Mol. Biol. 430, 4547–4556. 10.1016/J.JMB.2018.05.040. - DOI - PMC - PubMed
    1. Westerfield JM, and Barrera FN (2020). Membrane receptor activation mechanisms and transmembrane peptide tools to elucidate them. J. Biol. Chem. 295, 1792–1814. 10.1074/jbc.REV119.009457. - DOI - PMC - PubMed
    1. Zhang K, Gao H, Deng R, and Li J (2019). Emerging Applications of Nanotechnology for Controlling Cell-Surface Receptor Clustering. Angewandte Chemie - International Edition 58, 4790–4799. 10.1002/anie.201809006. - DOI - PubMed