. 2024 Jun 25;21(3):10.1088/1741-2552/ad5702.
doi: 10.1088/1741-2552/ad5702.

Identifying behavioral links to neural dynamics of multifiber photometry recordings in a mouse social behavior network

Affiliations

Identifying behavioral links to neural dynamics of multifiber photometry recordings in a mouse social behavior network

Yibo Chen et al. J Neural Eng. .

Abstract

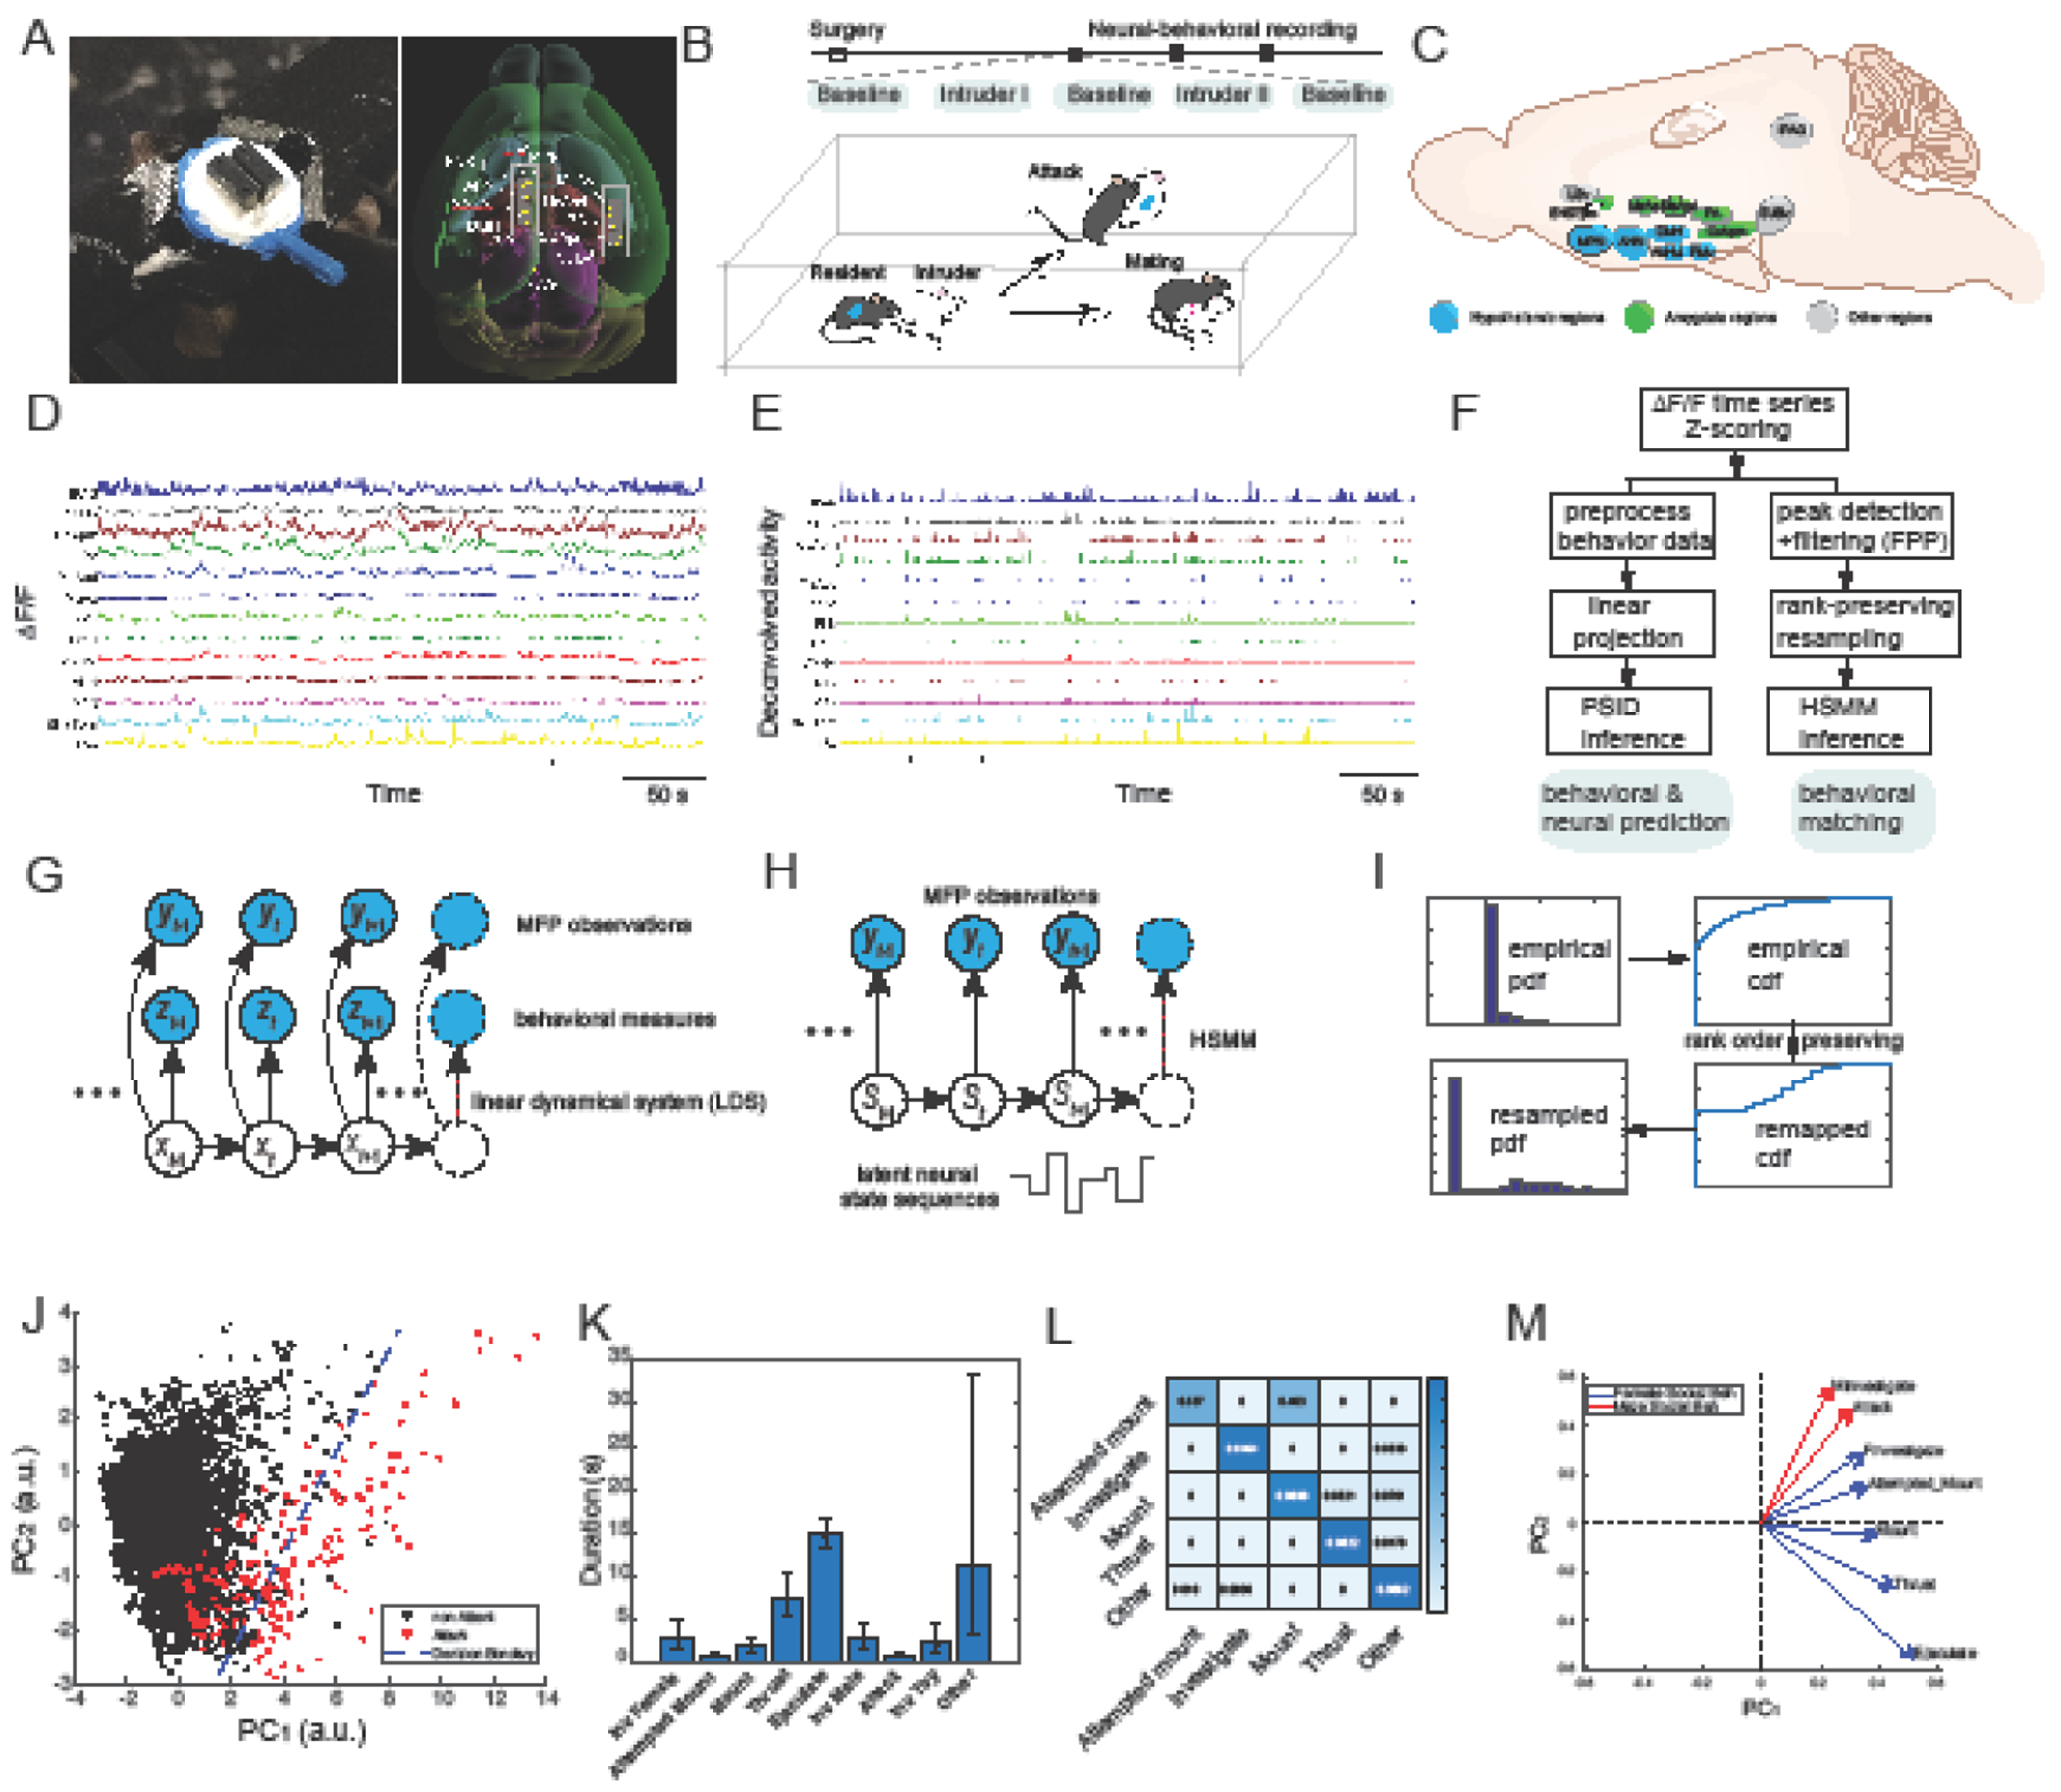
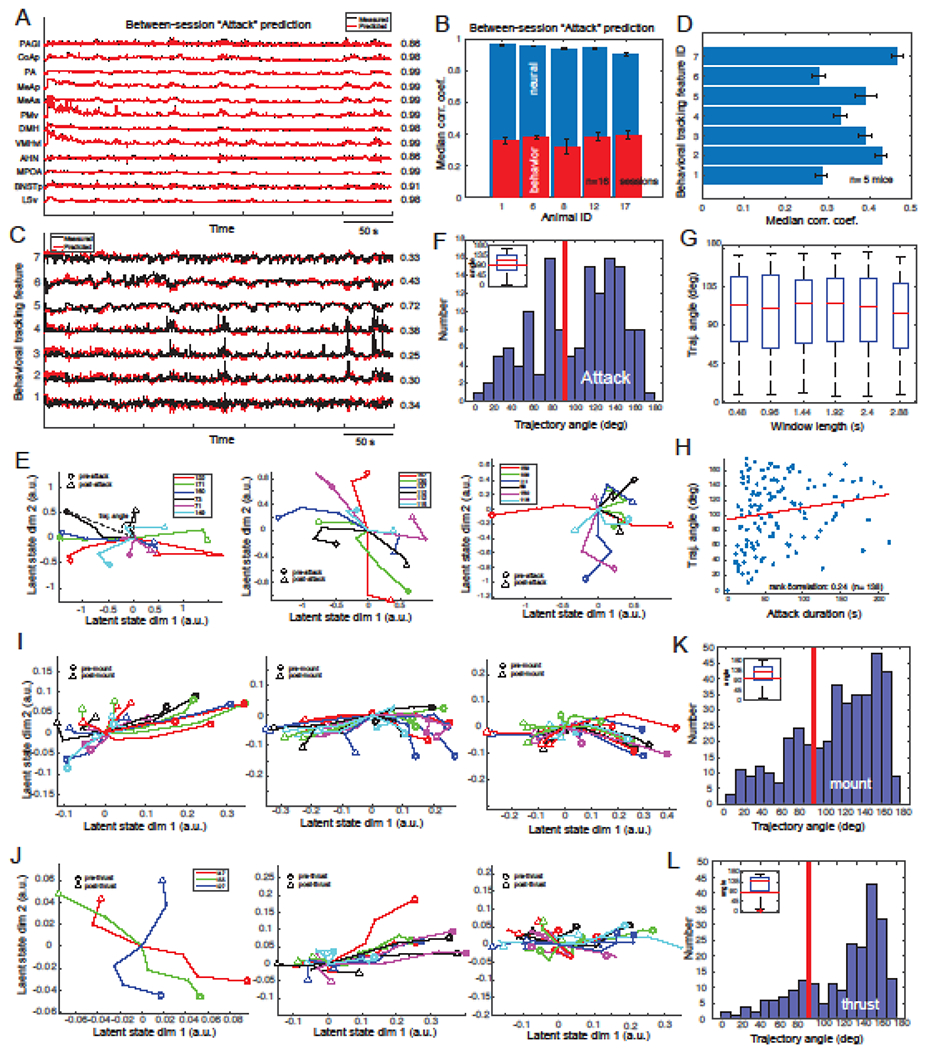
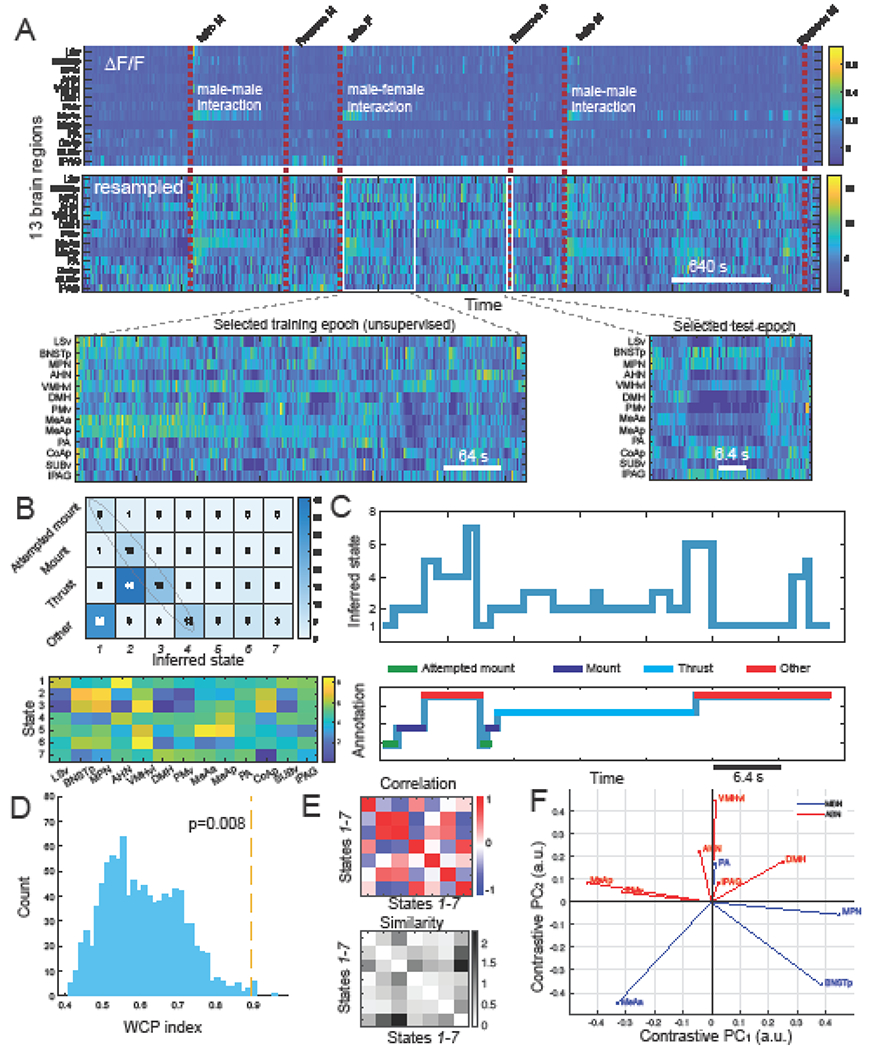
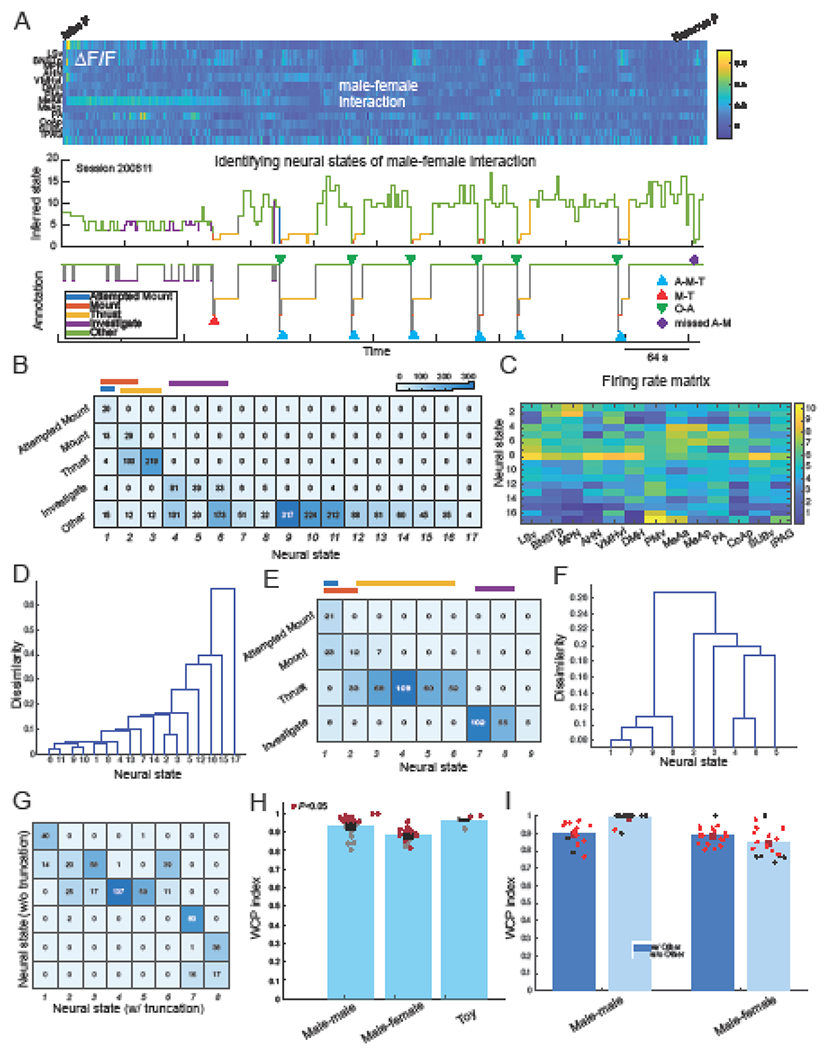
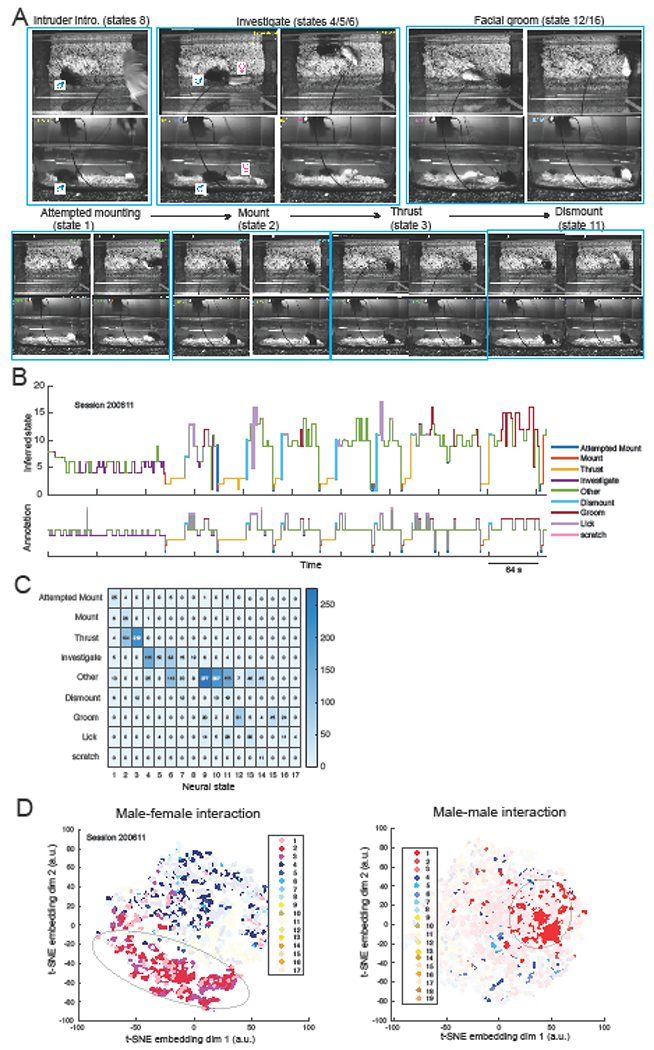
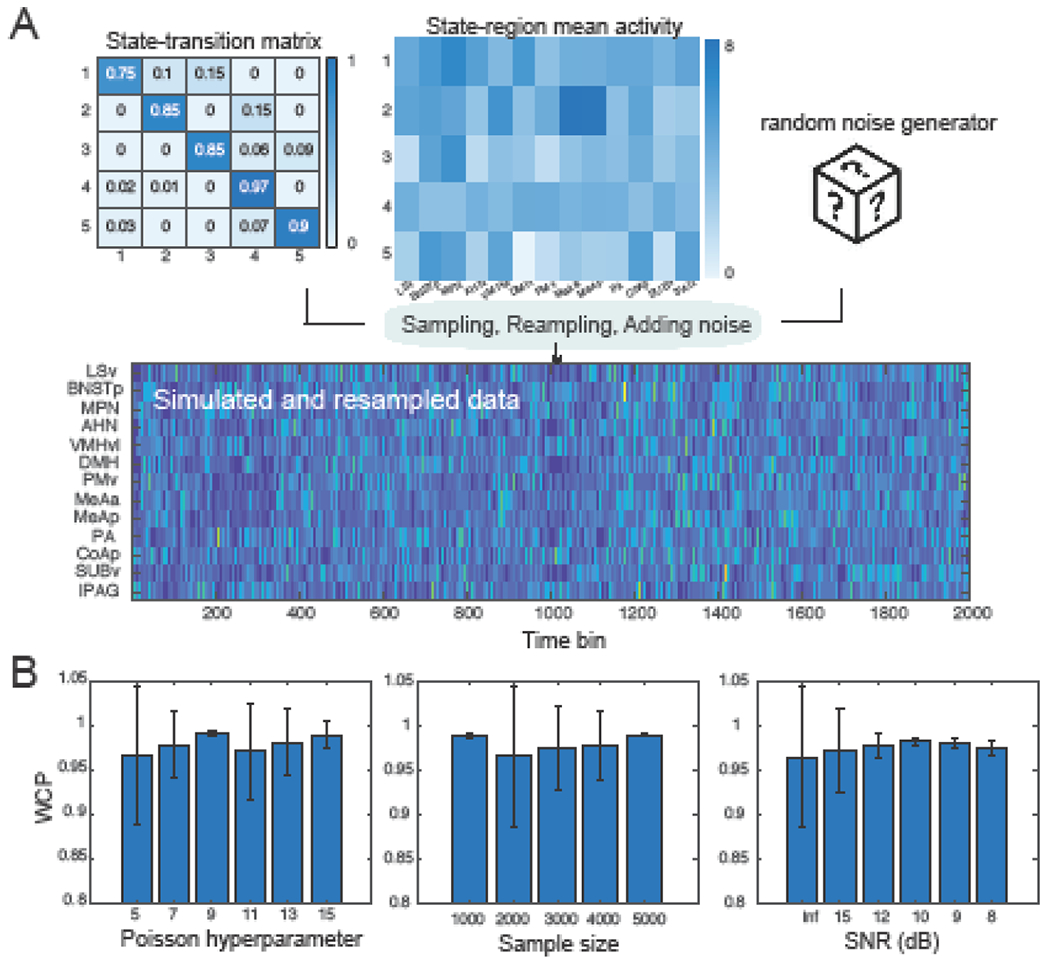
Objective.Distributed hypothalamic-midbrain neural circuits help orchestrate complex behavioral responses during social interactions. Given rapid advances in optical imaging, it is a fundamental question how population-averaged neural activity measured by multi-fiber photometry (MFP) for calcium fluorescence signals correlates with social behaviors is a fundamental question. This paper aims to investigate the correspondence between MFP data and social behaviors.Approach:We propose a state-space analysis framework to characterize mouse MFP data based on dynamic latent variable models, which include a continuous-state linear dynamical system and a discrete-state hidden semi-Markov model. We validate these models on extensive MFP recordings during aggressive and mating behaviors in male-male and male-female interactions, respectively.Main results:Our results show that these models are capable of capturing both temporal behavioral structure and associated neural states, and produce interpretable latent states. Our approach is also validated in computer simulations in the presence of known ground truth.Significance:Overall, these analysis approaches provide a state-space framework to examine neural dynamics underlying social behaviors and reveals mechanistic insights into the relevant networks.

Keywords: dynamical systems; latent variable model; multi-fiber photometry; social behavior network; social behaviors.


Figures

Figure 1.
Figure 1.. Experimental setup and joint neural and behavioral data analysis pipeline.
(A) Schematic of multi-fiber photometry (MFP) recording and optic fiber bundle. (B) Experimental protocol and recording timeline. (C) Illustration showing the recorded regions in mouse hypothalamus (blue), amygdala (green), and other brain areas (gray). (D) Representative snapshots of simultaneously recorded GCaMP6f traces (ΔF/F) of 13 brain regions in the mouse limbic system. (E) Deconvolved nonnegative activity from the ΔF/F traces in panel D. (F) Flowchart of neural data analysis pipeline. In the PSID inference, we processed the z-scored continuous traces. In the HSMM inference, we converted the z-scored continuous traces into discrete count measures by peak detection, filtering (i.e., convolution with an exponential filter and resulting in a filtered point process, FPP), and resampling. The analysis details are referred to the Methods section. (G) Schematic of linear dynamical system (LDS) for inferring latent neural states that drive neural and behavioral measures. (H) Schematic of hidden semi-Markov model (HSMM) for inferring latent neural state sequences. (I) Illustration of rank-preserving resampling. The resampled data points follow a Poisson distribution with a predefined rate hyperparameter, and the resampled data points preserve the relative ranking as the original data. (J) Principal component analysis (PCA) on selected 7-dimensional behavioral tracking measures (“subj1_median_last_longest_hull”, “subj1_median_last_centroid_mvmt”, “subj1_median_last_tail_base_mvmt”, “both_mean_last_all_bp_mvmt”, “both_prctile_rank_mean_last_sum_bp_dist”, “subj2_shortest_last_median_bp_dist”, “subj1_prctile_rank_last_sum_centroid_mvmt”) revealed a separation between “Attack” and “non-attack” behavioral episodes. Each dot represents the first two PC components at each time bin. Dotted line indicates the boundary inferred from generalized linear model (GLM) analysis. (K) Median duration of 9 annotated behaviors across all recordings. Error bar denotes 25% and 75% percentiles around the median. (L) Quantitative characterizations of the transition probability of five annotated behaviors from one representative male-female interaction session. The empirical transition probability was computed based on human annotated labels on the analyzed bin size (280 ms). (M) PCA showed two clusters of behaviorally relevant functional networks that explained the majority of variance of mean MFP activity of 13 brain regions. The analysis was conducted based on all MFP recordings from all animals.
Figure 2.
Figure 2.. The LDS-PSID method identified behaviorally relevant latent states.
(A) Z-scored ΔF/F traces of 13 brain regions in MFP activity (black) and predicted traces (red) during an Attack session in male-male interaction. Correlation coefficients between the measured and predicted traces were shown from the right. All behavioral variables were z-scored. In this example, the dimensionality of latent space is 6, but the R2 statistics were relatively stable and the results remain qualitatively similar when using a higher dimensionality. (B) Median correlation coefficients for between-session neural prediction (blue) and behavioral prediction (red) during male-male interaction. Error bars denote 25% and 75% percentiles across 16 sessions. (C) Selected 7 behavioral tracking traces (black) and prediction (red) associated with panel A during male-male interaction. Correlation coefficients between the measured and predicted traces were shown from the right. (Seven features #1-7 are “subj1_median_last_longest_hull”, “subj1_median_last_centroid_mvmt”, “subj1_median_last_tail_base_mvmt”, “both_mean_last_all_bp_mvmt”, “both_prctile_rank_mean_last_sum_bp_dist”, “subj2_shortest_last_median_bp_dist”, “subj1_prctile_rank_last_sum_centroid_mvmt”). (D) Median correlation coefficients for between-session behavioral prediction across 7 behavioral measures during male-male interaction. Error bar denotes IQR (25% and 75% percentiles) across 5 mice. (E) Visualization of aligned neural trajectories in “Attack” events from three representative recording sessions. 500-ms pre-attack and 500-ms post-attack trajectories are shown (start point: circles; end point: triangles). The angle from the start to end point define the trajectory angle. Figure legend denotes the angle in degree from the colored trajectories. (F) The distribution of trajectory angles among all “Attack” events (n=138). Median angle was greater than 90 degrees (inset). (G) The median and distribution statistics of trajectory angle was robust with respect to the event window length (i.e., start-to-end-point duration). (H) The median trajectory angles had a positive correlation with respect to the “Attack” event duration (Spearman’s rank correlation rho=0.24, P = 0.0039). Red line denotes a linear line fit. (I) Visualization of aligned neural trajectories in “Mount” events from three representative recording sessions. Figure legend same as panel E. (J) Visualization of aligned neural trajectories in “Thrust” events from three representative recording sessions (with one-to-one corresponding session in panel I). (K,L) The distribution of trajectory angles among all “Mount” (n=393) and “Thrust” (n=150) events. Median angle was greater than 90 degrees (inset).
Figure 3.
Figure 3.. HSMM estimation results from a representative male-female interaction training epoch followed by testing on an unseen male-female interaction epoch.
(A) Heatmaps of ΔF/F traces of 13 brain regions (top) in one recording session. Vertical red dashed line indicates the onset of annotated behaviors of Male (M) and Female (F) mice. Two white boxes represent the selected training and testing epochs of male-female interactions that share common annotated behaviors. Resampling helps to increase the contrast between low and high activity and converts the continuous measure to the discrete count measure. In this example, the choice of hyperparameter (i.e., mean rate parameter) is 5. However, the inference results were stable and qualitatively with respect to the hyperparameter value. (B) The derived confusion matrix (top) and state-firing rate matrix (bottom) from the selected test epoch example in panel A. The diagonal line of the confusion matrix indicates the degree of one-to-one correspondence between annotated behavior labels and inferred neural states. Each entry corresponds to the number of time bins in the analyzed example. (C) Comparison of the inferred state sequence (top) and annotated behavioral sequence (bottom) from the selected test epoch example in panel A. (D) Illustration of the weighted column purity (WCP) index (red vertical dashed line) versus its shuffle distribution derived from the surrogate data. (E) Pairwise state correlation (top) and dissimilarity (bottom) matrices for the inferred state-firing rate matrix in panel B. (F) By comparing the inferred firing rate matrices during male-male and male-female interactions, contrast PCA roughly uncovered two functional networks: mating-biased network (MBN) and aggression-biased network (ABN).
Figure 4.
Figure 4.. HSMM uncovers behaviorally interpretable latent neural states.
(A) Top: Heatmaps of ΔF/F traces of 13 brain regions (top) MFP activity in one complete male-female MFP recording session. Middle: HSMM-decoded neural sequence, which was derived based on the behavioral membership using a suboptimal state-behavior match. The latent sequence was also superimposed by the behavioral label color for improving visualization. Bottom: the annotated behavioral label. Three color-coded triangle symbols represent three different behavioral sequences. (B) The confusion matrix that shows the best match between latent neural states and behaviors. The WCP statistic is 0.918. (C) The inferred state-firing rate matrix that characterized the mean firing activity for each latent state while assuming Poisson firing of the resampled data. (D) Hierarchical clustering of the inferred latent states revealed their relationship. Two states are closer in the leaf or branch if their corresponding state-firing rate vectors are similar. (E) The new confusion matrix inferred from the modified neural data by truncating the duration of “Other” label. The WCP statistic is 0.905. (F) The new state relationship inferred from the modified neural data by truncating the duration of “Other” label. (G) The correspondence matrix between two sets of latent states inferred from two conditions showed clear correspondence. (H) The WCP population statistics derived from all MFP recording sessions (where the complete session was used for training only) according to three categories: male-male (n=16), male-female (n=14), and toy interactions (n=4). Red dots indicate statistical significance. (I) The WCP population statistics for a total of 31 testing epochs during male-male and male-female interactions. Red dots indicate statistical significance.
Figure 5.
Figure 5.. Post-hoc analysis validated HSMM-identified behaviorally relevant states.
(A) Human inspection of video footage confirmed meaningful neural states from the HSMM inference. See also Supplementary Video S1. (B) HSMM-decoded neural sequence using the suboptimal state-behavior match based on the new annotations. The latent sequence was also superimposed by the behavioral label color for the purpose of visualization. Bottom: the new annotated behavioral labels. (C) The new confusion matrix based on the new annotated behavioral labels. Compared to Figure 4B, the state-behavior mapping was improved. The state-firing rate matrix remains unchanged from Figure 4C. (D) Two representative male-female and male-male behavioral embeddings superimposed by the latent state identity with distinct color.
Figure 6.
Figure 6.. Latent state inference was robust with respect to resampling, sample size, and SNR.
(A) Schematic of generating simulated data via sampling (from a user-defined state-transition matrix and a state-region mean activity template), rank-preserving resampling, and adding additive noise. One simulated 13-by-2000 data matrix is shown. (B) Comparison of the WCP index with respect to the resampling hyperparameter, sample size, and signal-to-noise ratio (SNR). Error bar denotes SD over n=10 Monte Carlo experiments.

Update of

Similar articles

References

    1. Abid A, Zhang MJ, Bagaria VK et al. Exploring patterns enriched in a dataset with contrastive principal component analysis. Nat Commun 9, 2134 (2018). 10.1038/S41467-018-04608-8 - DOI - PMC - PubMed
    1. Aghagolzadeh M, Truccolo W. Inference and Decoding of Motor Cortex Low-Dimensional Dynamics via Latent State-Space Models. IEEE Transactions on Neural Systems and Rehabilitation Engineering, 24, 272–282 (2016) 10.1109/TNSRE.2015.2470527 . - DOI - PMC - PubMed
    1. Anderson D. Circuit modules linking internal states and social behaviour in flies and mice. Nat Rev Neurosci 17, 692–704 (2016). 10.1038/nrn.2016.125 - DOI - PubMed
    1. Aubry AV, Joseph Burnett C, Goodwin NL, Li L, Navarrete J, Zhang Y, Tsai V, Durand-de Cuttoli R, Golden SA, Russo SJ. Sex differences in appetitive and reactive aggression. Neuropsychopharmacology. 47, 1746–1754 (2022). 10.1038/s41386-022-01375-5. - DOI - PMC - PubMed
    1. Batty E, Whiteway MR, Saxena S, Biderman D, Abe T, et al. BehaveNet: nonlinear embedding and Bayesian neural decoding of behavioral videos. Advances in Neural Information Processing Systems 33 (NeurIPS’19) (2019).

Publication types

LinkOut - more resources