. 2024 Jun 27;21(3):10.1088/1741-2552/ad5703.
doi: 10.1088/1741-2552/ad5703.

Electrical rejuvenation of chronically implanted macroelectrodes in nonhuman primates

Affiliations

Electrical rejuvenation of chronically implanted macroelectrodes in nonhuman primates

K P O'Sullivan et al. J Neural Eng. .

Abstract

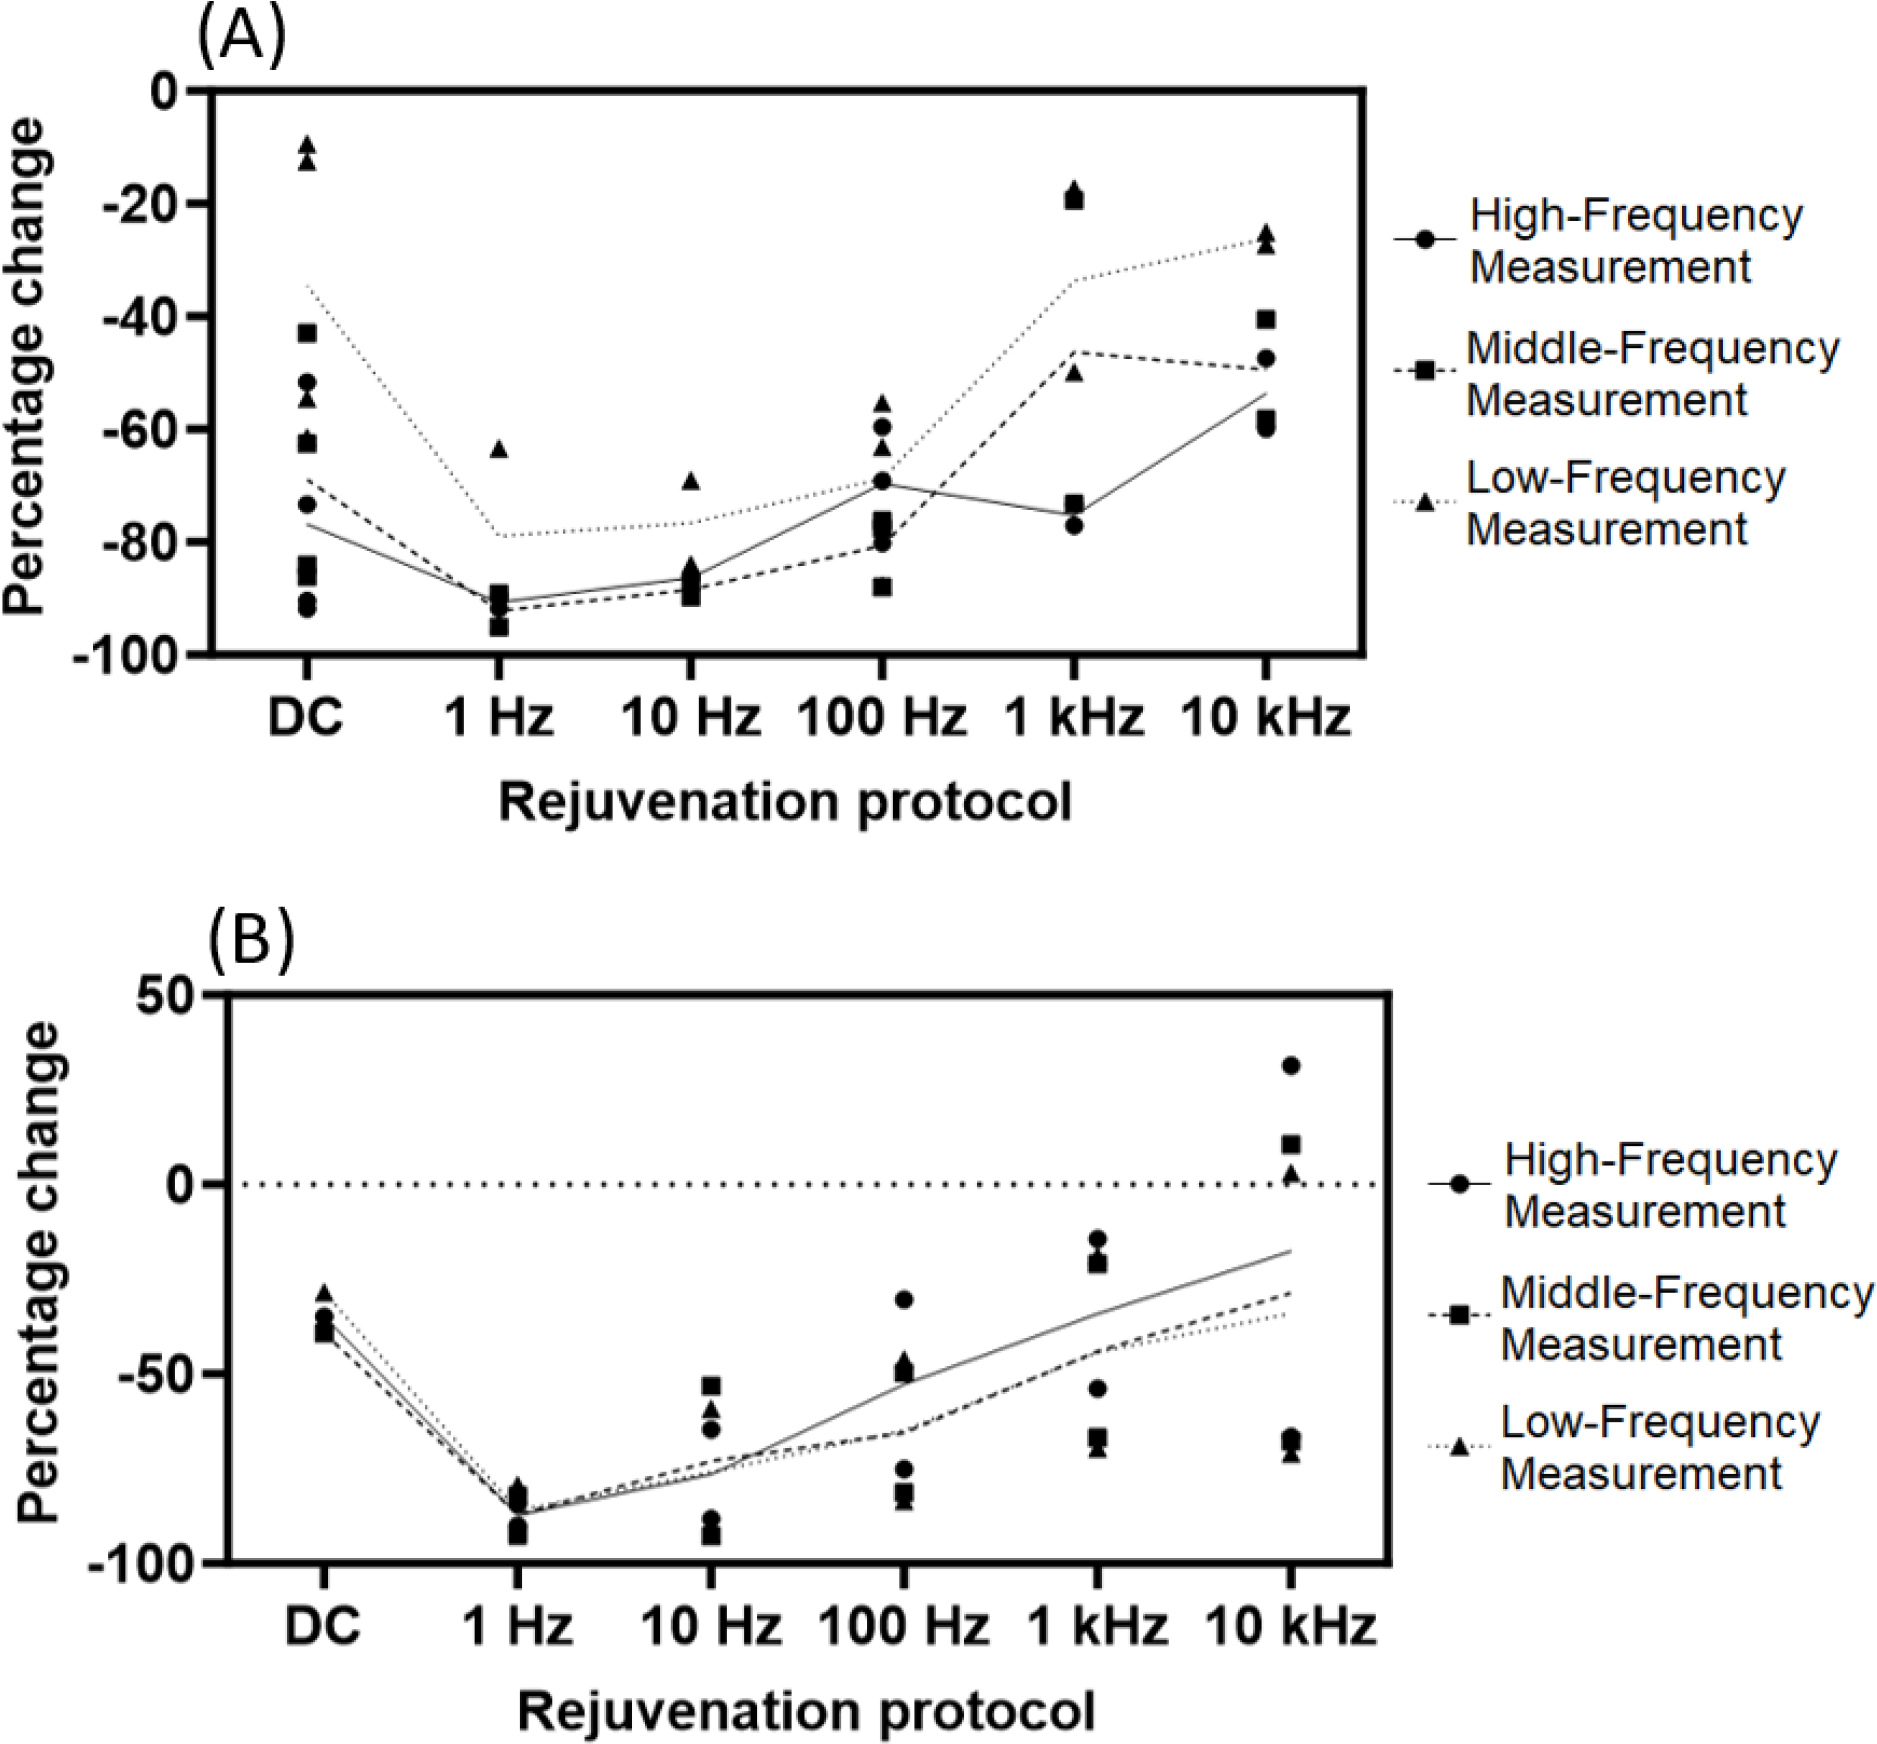
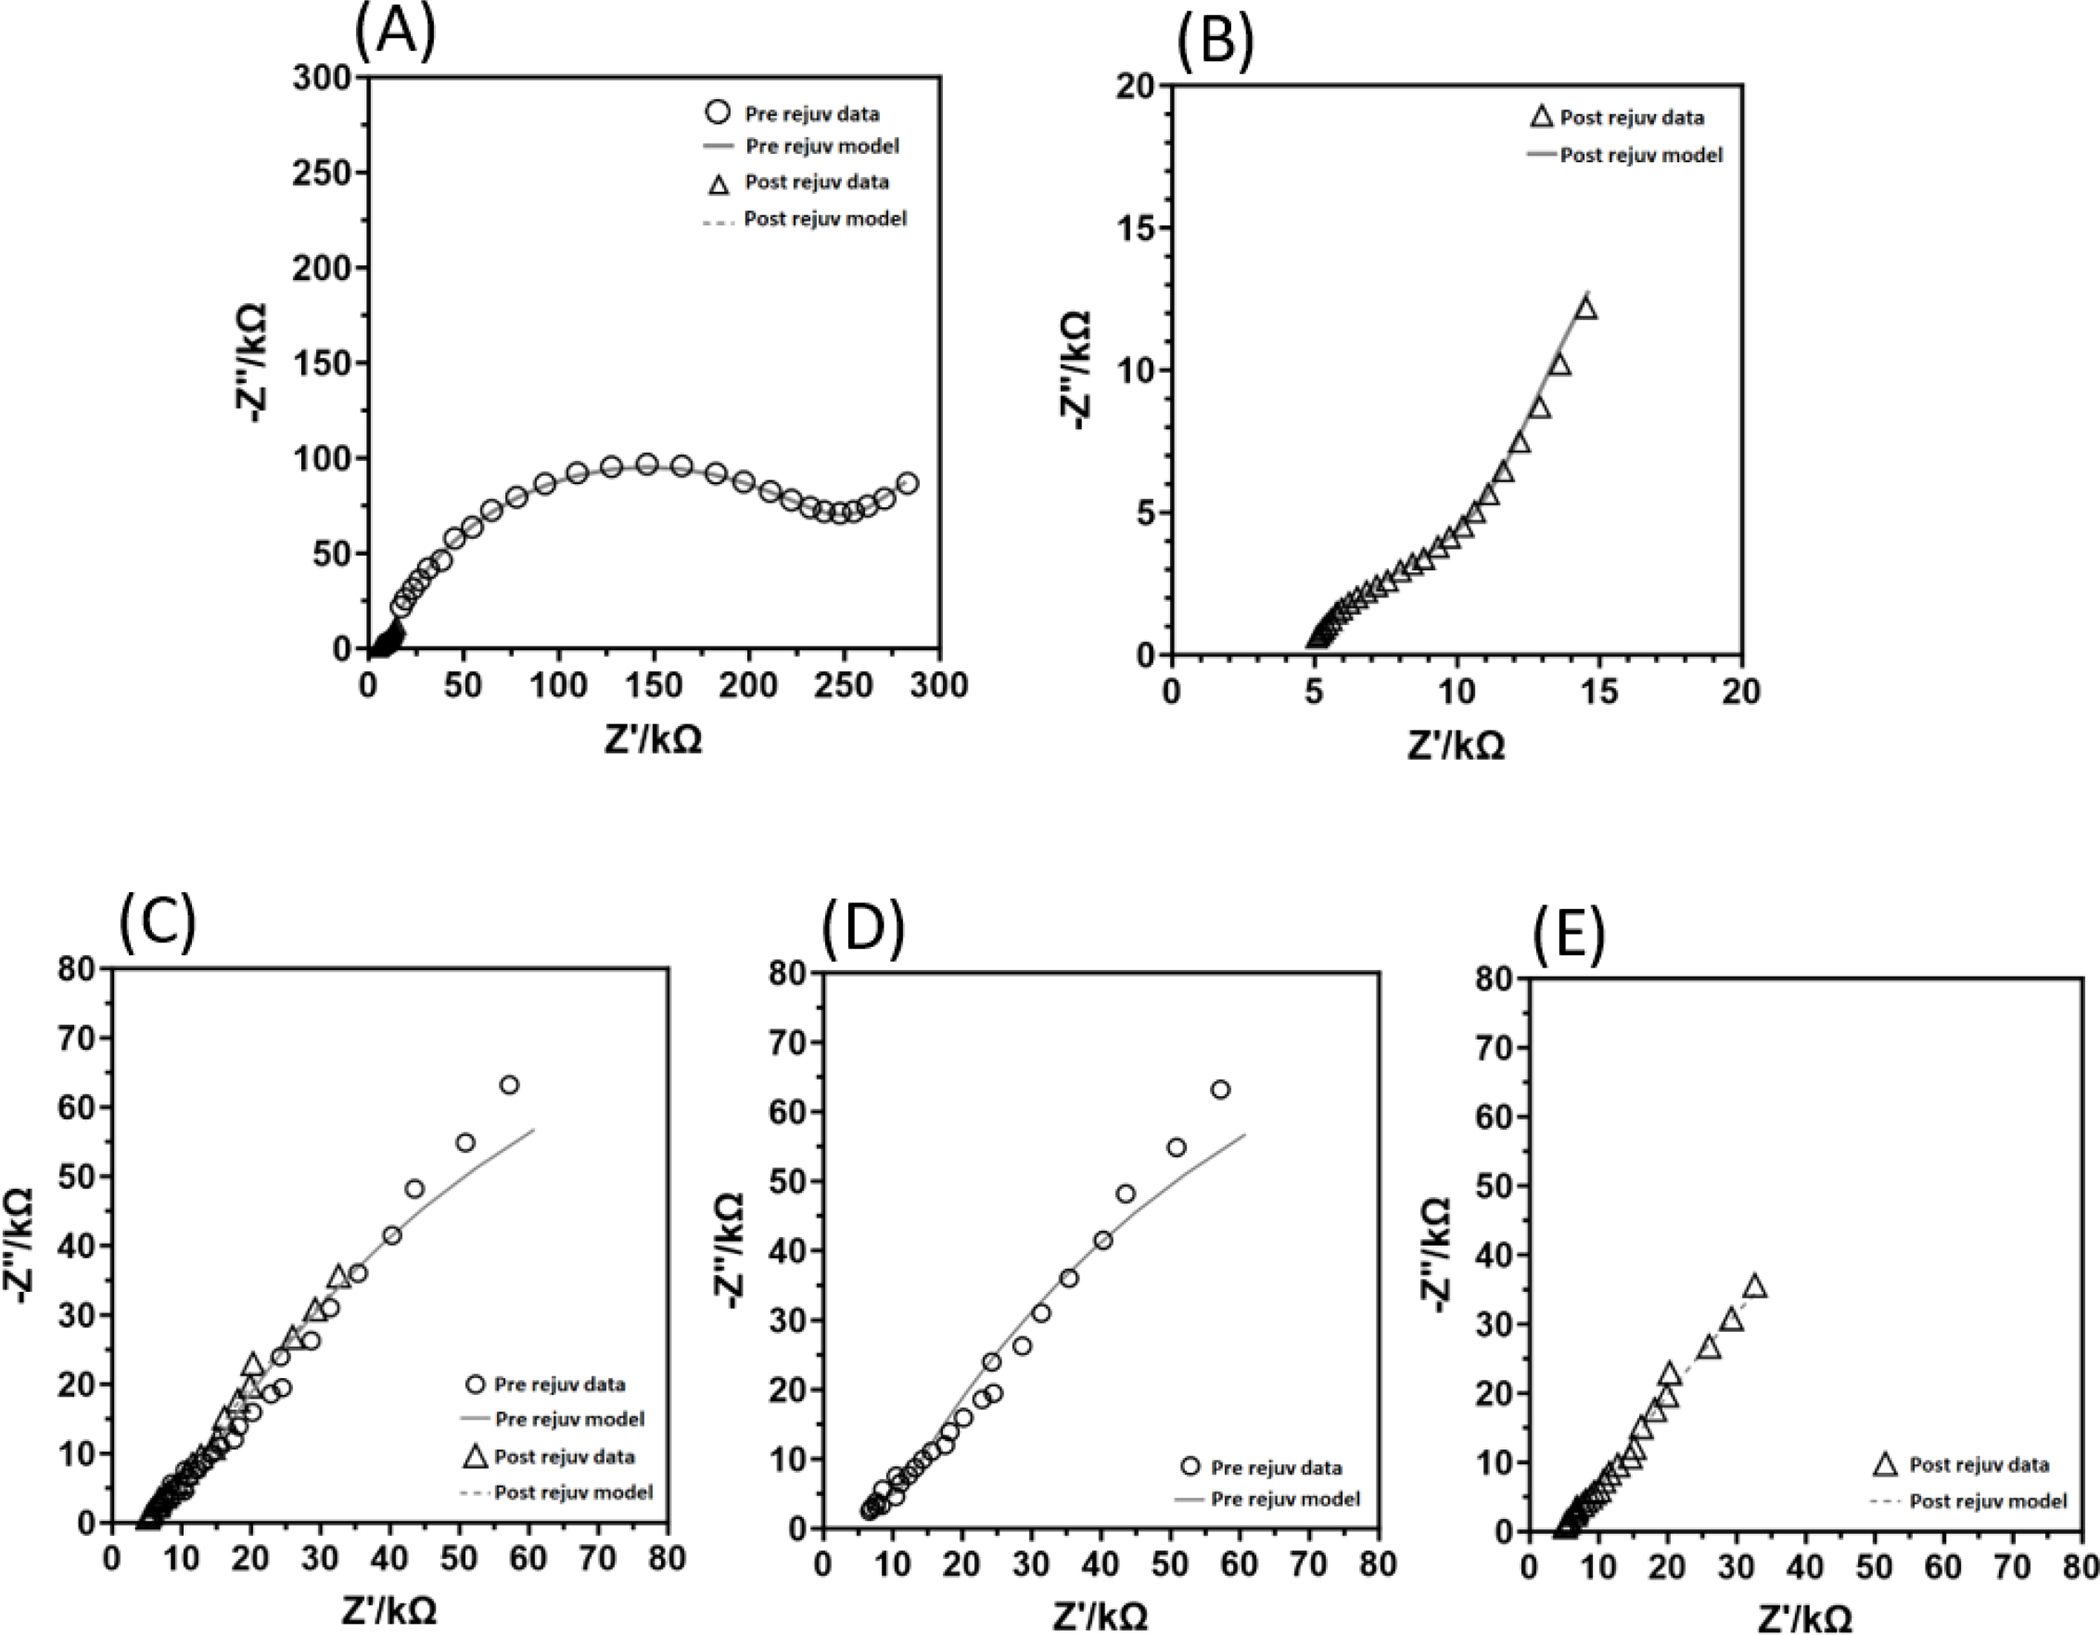
Objective.Electrodes chronically implanted in the brain undergo complex changes over time that can lower the signal to noise ratio (SNR) of recorded signals and reduce the amount of energy delivered to the tissue during therapeutic stimulation, both of which are relevant for the development of robust, closed-loop control systems. Several factors have been identified that link changes in the electrode-tissue interface (ETI) to increased impedance and degraded performance in micro- and macro-electrodes. Previous studies have demonstrated that brief pulses applied every few days can restore SNR to near baseline levels during microelectrode recordings in rodents, a process referred to as electrical rejuvenation. However, electrical rejuvenation has not been tested in clinically relevant macroelectrode designs in large animal models, which could serve as preliminary data for translation of this technique. Here, several variations of this approach were tested to characterize parameters for optimization.Approach. Alternating-current (AC) and direct-current (DC) electrical rejuvenation methods were explored in three electrode types, chronically implanted in two adult male nonhuman primates (NHP) (Macaca mulatta), which included epidural electrocorticography (ECoG) electrodes and penetrating deep-brain stimulation (DBS) electrodes. Electrochemical impedance spectroscopy (EIS) was performed before and after each rejuvenation paradigm as a gold standard measure of impedance, as well as at subsequent intervals to longitudinally track the evolution of the ETI. Stochastic error modeling was performed to assess the standard deviation of the impedance data, and consistency with the Kramers-Kronig relations was assessed to evaluate the stationarity of EIS measurement.Main results. AC and DC rejuvenation were found to quickly reduce impedance and minimize the tissue component of the ETI on all three electrode types, with DC and low-frequency AC producing the largest impedance drops and reduction of the tissue component in Nyquist plots. The effects of a single rejuvenation session were found to last from several days to over 1 week, and all rejuvenation pulses induced no observable changes to the animals' behavior.Significance. These results demonstrate the effectiveness of electrical rejuvenation for diminishing the impact of chronic ETI changes in NHP with clinically relevant macroelectrode designs.

Keywords: chronic implant; electrochemical impedance spectroscopy; electrode; foreign-body response; nonhuman primate; rejuvenation.


Figures

Figure 1-
Figure 1-
Nyquist plots comparing an ECoG electrode in saline (A) and the same electrode type after over a year of chronic implantation in a nonhuman primate (B). Note the semicircular arc “tissue component” visible at the high-frequency end of the spectrum, suggesting chronic biological effects on the behavior of the device.
Figure 2-
Figure 2-
The 3 electrode models used in this study. (A) Hereaus segmented deep brain stimulation electrode (Hereaus Group, Hanau, Germany), contact surface area 0.37 mm2. (B) CorTec Fetz Spinal cord ECoG (CorTec Neuro, Freiburg, Germany), contact surface area 0.28 mm2. (C) CorTec Micro Square ECoG (CorTec Neuro, Freiburg, Germany), 0.79 mm2 contact surface area.
Figure 3-
Figure 3-
Rejuvenation timeline overview. (A) An illustration of the order of channel rejuvenations applied to NHP2’s ECoG array. Dark circles are available electrode contacts. White number labels depict the day on which rejuvenation was performed on that channel. (A) depicts the right-side array, with rejuvenations performed on day 1, day 2, day 9 and day 10. (B) depicts the left-side array, with rejuvenations performed on day 3 and day 8. Dark circles without a number label are unrejuvenated channels, used as a reference in statistical analysis. (C) An overview of the experiment timeline in both animals. No stimulation was applied apart from the rejuvenation protocols described.
Figure 4-
Figure 4-
Diagram of the process model used to fit select examples of the rejuvenation data. Re is an Ohmic impedance representing the bulk resistance of the extracellular fluid and matrix surrounding the electrode, while the Cfilm and Rfilm circuit elements represent the cellular components of the tissue encapsulation. ZCPE depicts the constant phase element behavior of double-layer capacitance on the electrode, while RTA denotes electrode charge transfer resistance.
Figure 5-
Figure 5-
An example of initial rejuvenation testing performed in a single channel of NHP1’s ECoG electrode with similar parameters to those used in rodent rejuvenation studies. A 1.5V DC stimulation pulse was applied for 4 seconds. Note the visible “tissue component” present in the pre-rejuvenation data (depicted with circular markers). Following rejuvenation, the impedance spectra assume a more linear shape, with lower real and imaginary impedance values across the frequency spectrum (represented with triangular markers).
Figure 6-
Figure 6-
Summary of rejuvenation results for NHP1, showing the percent change in impedance observed with each rejuvenation protocol. Data for all channels rejuvenated with each protocol are shown at 3 measurement frequencies. Note that frequencies depicted for rejuvenation protocols (X axis) are frequencies of stimulation, while frequencies of measurement are frequencies at which the electrode impedance was characterized (High-Frequency = 1 kHz, Middle-Frequency = 112 Hz, and Low-Frequency = 10 Hz). Percent change values reflect the change in impedance observed immediately post-rejuvenation. Trendlines depict mean values within each category. Results for NHP1’s ECoG electrode are shown in (A). Note that low-frequency AC rejuvenation resulted in the largest percent change in measured impedance. (B) depicts NHP1’s DBS electrode results. Low-frequency AC rejuvenation was most effective in this electrode as well, with the highest rejuvenation frequency (10 kHz) failing to reduce measured impedance for some datapoints.
Figure 7-
Figure 7-
An example Nyquist plot of a rejuvenated ECoG electrode channel from NHP1 measured at timepoints over the course of 7 days following rejuvenation. This ECoG channel was rejuvenated at 1 mA, 10 kHz for 4 seconds. Note the clear presence of a semicircular arc “tissue component” in the pre-rejuvenation measurement, which is visibly reduced in the post-rejuvenation spectra, along with a reduction in impedance values across the frequency spectrum. Overall impedance values increase the 7-day interval, with the “tissue component” visibly returning to a similar magnitude to pre-rejuvenation measurements by day 7.
Figure 8-
Figure 8-
Summary of rejuvenation results for NHP2, showing the percent change in impedance observed with each rejuvenation protocol. Data for all channels rejuvenated with each protocol are shown at 3 measurement frequencies. Note that frequencies depicted for rejuvenation protocols (X axis) are frequencies of stimulation, while frequencies of measurement are frequencies at which the electrode impedance was characterized (High-Frequency = 1 kHz, Middle-Frequency = 112 Hz, and Low-Frequency = 10 Hz). Percent change values reflect the change in impedance observed immediately post-rejuvenation. Trendlines depict mean values within each category. All data shown for NHP2 were measured using the ECoG grid electrode, with data shown in (A) rejuvenated at 0.1 mA and data in (B) rejuvenated at 1 mA. DC rejuvenation was more effective in NHP2. AC rejuvenation also displayed a trend similar to that observed in NHP1, with low-frequency protocols inducing a greater percent change in measured impedance than those at higher frequency.
Figure 9-
Figure 9-
Single-frequency impedance measurements recorded in a selection of NHP2’s ECoG electrode channels, showing the changes in post-rejuvenation impedance over the course of 9–11 days. Impedance change is depicted as a difference between the pre-rejuvenation value measured at 1 kHz and each subsequent value. The top plot shows data from the right-side ECoG array, rejuvenated at 1 mA. Note the convergence of measured impedance values around the baseline value of 0 on day 10. Channels depicted with open symbols we re un-rejuvenated controls. Rejuvenated channels from the left ECoG array, rejuvenated at 0.1 mA (lower plot) did not exhibit a convergence to the original baseline values within the measured time interval.
Figure 10-
Figure 10-
Single-frequency impedance measurements recorded for NHP2’s DBS electrodes, including the rejuvenated channels (dark markers) and adjacent unrejuvenated channels within each segmented ring (open markers), showing the changes in post-rejuvenation impedance over 11days. Impedance change is depicted as a difference between the pre-rejuvenation value measured at 1 kHz and each subsequent value. Note that both DBS leads showed lowered impedance lasting approximately 4 days, followed by a return to impedance values exceeding the original measurement.
Figure 11-
Figure 11-
Data fitted to the process model described in figure 4. (A)- A summary plot containing the example data from NHP1’s ECoG electrode. Note the large, apparent tissue component in the pre-rejuvenation data. Trendlines depict the model fit, while symbols depict the measured datapoints. The small cluster of symbols from 0–25 kΩ is the post-rejuvenation data. (B)- An enlarged figure of the post-rejuvenation data and model fit for NHP1. (C)- Summary plot of the pre- and post-rejuvenation example data and fitted models for NHP2. (D)- An isolated plot of the pre-rejuvenation data and model fit for NHP2. (E)- Isolated plot of the post-rejuvenation data and model fit for NHP2.

Similar articles

References

    1. Agarwal P, Crisalle OD, Orazem ME, & Garcia-Rubio LH (1995). Application of Measurement Models to Impedance Spectroscopy: II. Determination of the Stochastic Contribution to the Error Structure (Journal of The Electrochemical Society, pp. 4149–4158).
    1. Agarwal P, Orazem ME, & Garcia-Rubio LH (1992). Measurement Models for Electrochemical Impedance Spectroscopy: I. Demonstration of Applicability. Journal of The Electrochemical Society, 139(7), 1917–1927. 10.1149/1.2069522 - DOI
    1. Ansó J, Benjaber M, Parks B, Parker S, Oehrn CR, Petrucci M, Gilron R, Little S, Wilt R, Bronte-Stewart H, Gunduz A, Borton D, Starr PA, & Denison T (2022). Concurrent stimulation and sensing in bi-directional brain interfaces: a multi-site translational experience. Journal of Neural Engineering, 19(2), 10.1088/1741-2552/ac59a3. 10.1088/1741-2552/ac59a3 - DOI - DOI - PMC - PubMed
    1. Baker JL, Ryou J-W, Wei XF, Butson CR, Schiff ND, & Purpura KP (2016). Robust modulation of arousal regulation, performance, and frontostriatal activity through central thalamic deep brain stimulation in healthy nonhuman primates. Journal of Neurophysiology, 116(5), 2383–2404. 10.1152/jn.01129.2015 - DOI - PMC - PubMed
    1. Biran R, Martin DC, & Tresco PA (2005). Neuronal cell loss accompanies the brain tissue response to chronically implanted silicon microelectrode arrays. Experimental Neurology, 195(1), 115–126. 10.1016/j.expneurol.2005.04.020 - DOI - PubMed

LinkOut - more resources