. 2024 Aug;632(8027):1155-1164.
doi: 10.1038/s41586-024-07648-x. Epub 2024 Jun 11.

Molecular and physiological changes in the SpaceX Inspiration4 civilian crew

Christopher W Jones #  1 Eliah G Overbey #  2   3   4   5 Jerome Lacombe #  6   7 Adrian J Ecker  1 Cem Meydan  2   3   4 Krista Ryon  2   3   4 Braden Tierney  2   3   4 Namita Damle  2   3   4 Matthew MacKay  2   3   4 Evan E Afshin  2   3   4 Jonathan Foox  2   3   4 Jiwoon Park  2   3 Theodore M Nelson  8 Mir Suhail Mohamad  9 Syed Gufran Ahmad Byhaqui  9 Burhan Aslam  9 Ummer Akbar Tali  9 Liaqun Nisa  9 Priya V Menon  9 Chintan O Patel  9 Sharib A Khan  9 Doug J Ebert  10 Aaron Everson  10 Michael C Schubert  11 Nabila N Ali  11 Mallika S Sarma  11 JangKeun Kim  2   3 Nadia Houerbi  2   3 Kirill Grigorev  2   3 J Sebastian Garcia Medina  2   3 Alexander J Summers  6 Jian Gu  6   7 John A Altin  12 Ali Fattahi  6 Mohammad I Hirzallah  13   14 Jimmy H Wu  14   15 Alexander C Stahn  1 Afshin Beheshti  16   17 Remi Klotz  18 Veronica Ortiz  18 Min Yu  18 Laura Patras  19   20 Irina Matei  19   21 David Lyden  19   21 Ari Melnick  2 Neil Banerjee  22 Sean Mullane  22 Ashley S Kleinman  2   3 Michael Loesche  22 Anil S Menon  23 Dorit B Donoviel  14   15 Emmanuel Urquieta  14   15 Jaime Mateus  22 Ashot E Sargsyan  10 Mark Shelhamer  11 Frederic Zenhausern  6   7   12   24 Eric M Bershad  13   14 Mathias Basner  25 Christopher E Mason  26   27   28
Affiliations

Molecular and physiological changes in the SpaceX Inspiration4 civilian crew

Christopher W Jones et al. Nature. 2024 Aug.

Abstract

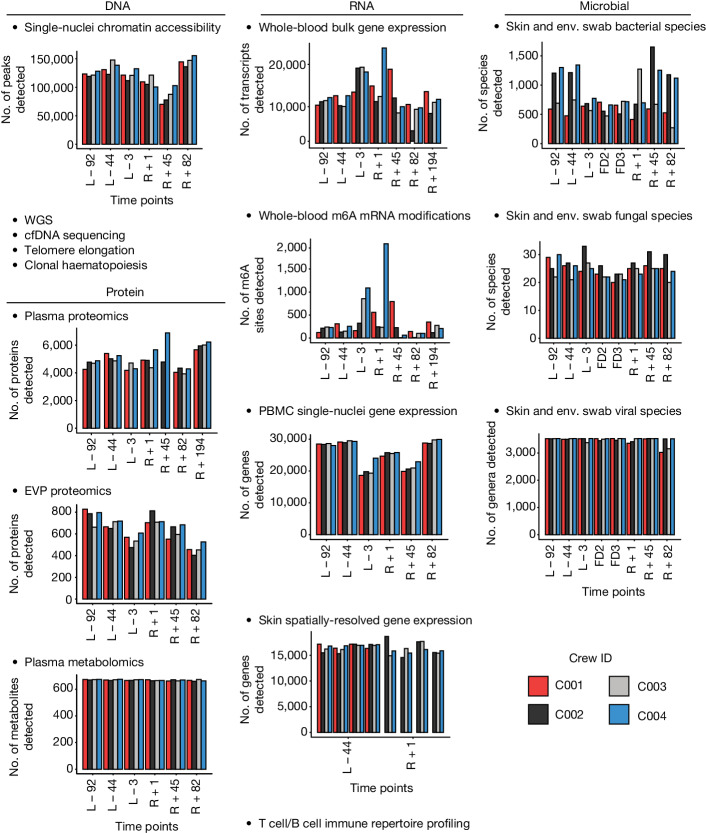
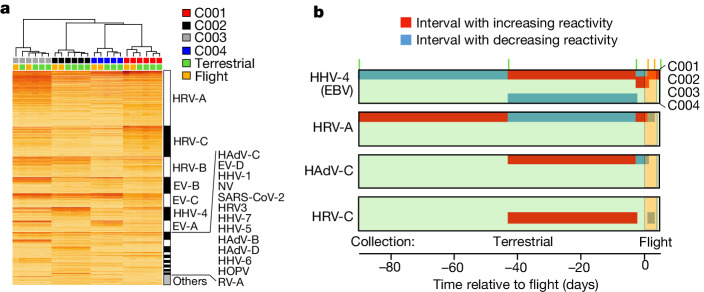
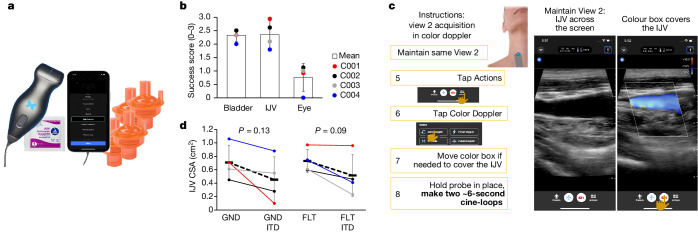
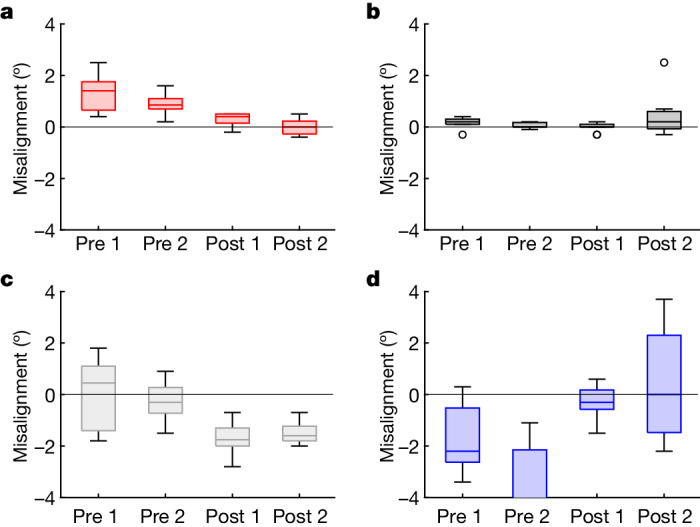
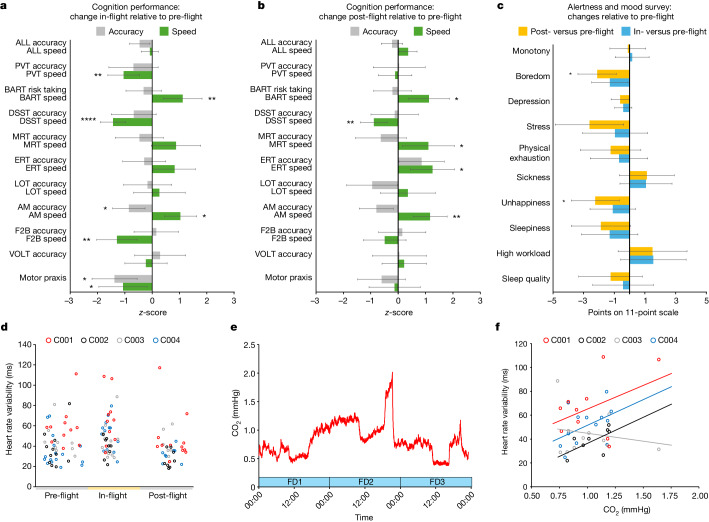
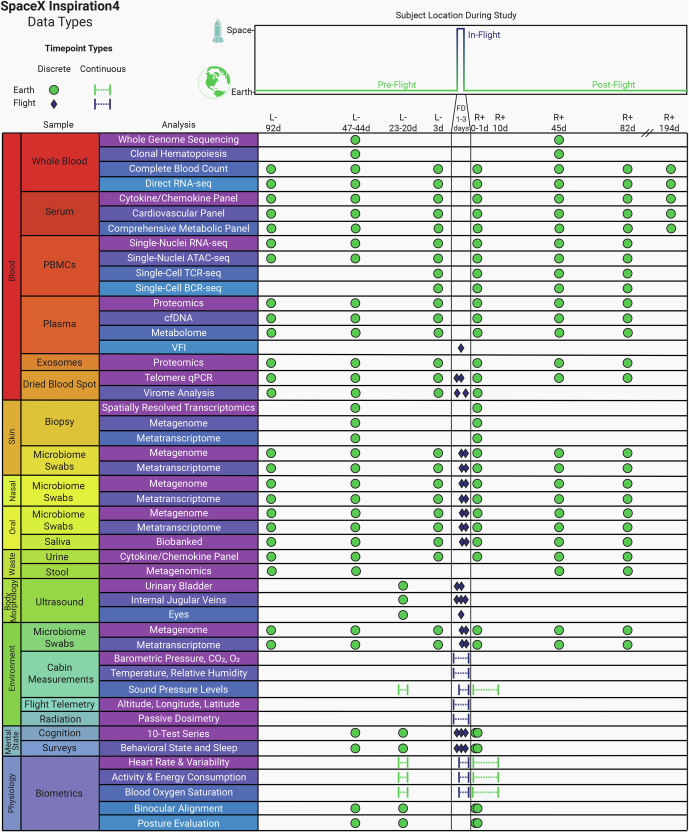
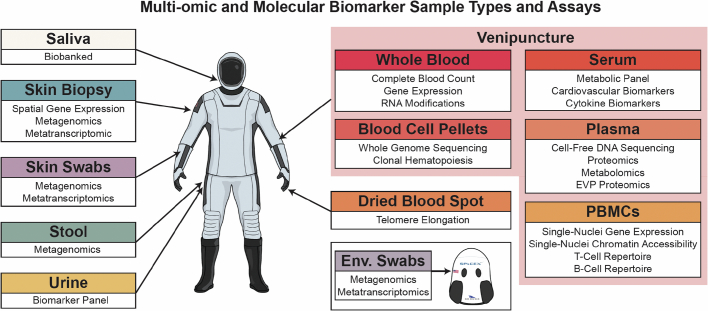
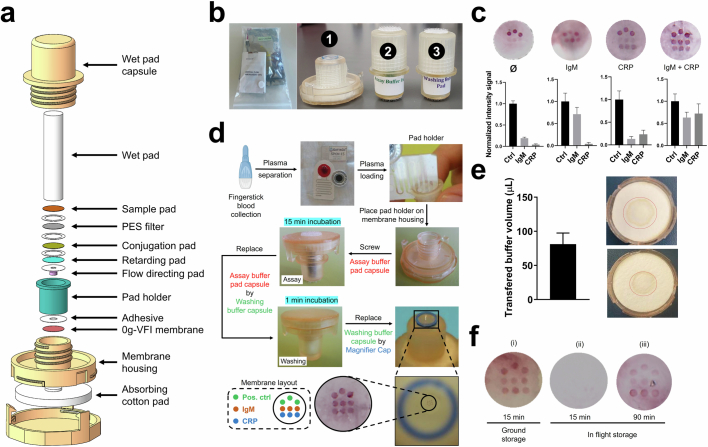
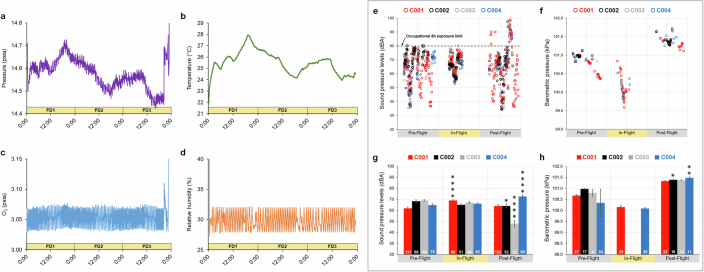
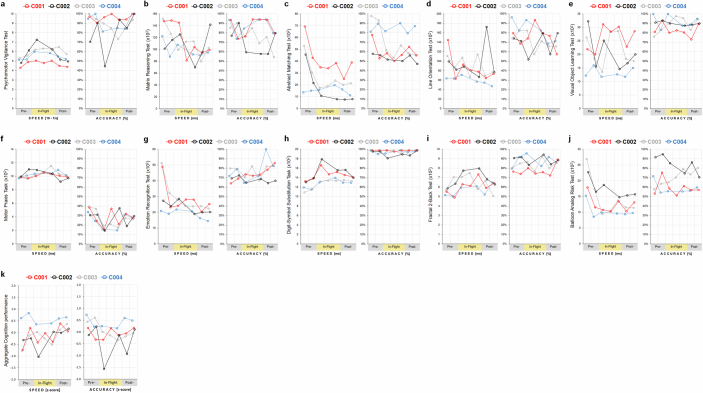
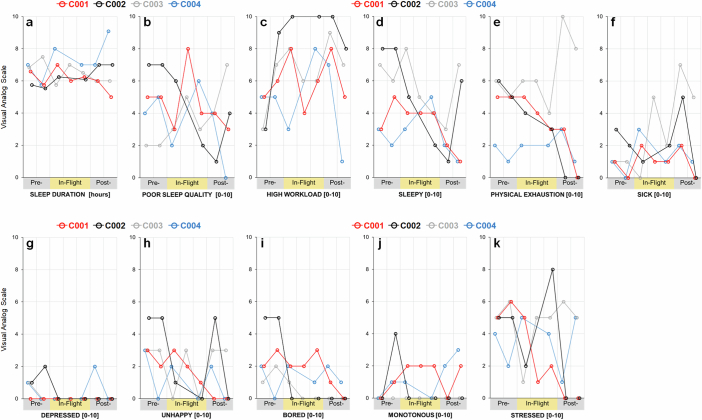
Human spaceflight has historically been managed by government agencies, such as in the NASA Twins Study1, but new commercial spaceflight opportunities have opened spaceflight to a broader population. In 2021, the SpaceX Inspiration4 mission launched the first all-civilian crew to low Earth orbit, which included the youngest American astronaut (aged 29), new in-flight experimental technologies (handheld ultrasound imaging, smartwatch wearables and immune profiling), ocular alignment measurements and new protocols for in-depth, multi-omic molecular and cellular profiling. Here we report the primary findings from the 3-day spaceflight mission, which induced a broad range of physiological and stress responses, neurovestibular changes indexed by ocular misalignment, and altered neurocognitive functioning, some of which match those of long-term spaceflight2, but almost all of which did not differ from baseline (pre-flight) after return to Earth. Overall, these preliminary civilian spaceflight data suggest that short-duration missions do not pose a significant health risk, and moreover present a rich opportunity to measure the earliest phases of adaptation to spaceflight in the human body at anatomical, cellular, physiological and cognitive levels. Finally, these methods and results lay the foundation for an open, rapidly expanding biomedical database for astronauts3, which can inform countermeasure development for both private and government-sponsored space missions.


Conflict of interest statement

C.E.M. is a co-founder of BioAstra. The remaining authors declare no competing interests.

Figures

Fig. 1
Fig. 1. Multi-omic changes across the Inspiration4 mission.
Hundreds of thousands of multi-omic measurements were generated across multiple sample types. From DNA, single-nuclei chromatin accessibility, WGS, cell-free DNA (cfDNA) sequencing, telomere length and clonal haematopoiesis were measured. From RNA, whole blood gene expression, whole blood m6A modifications, peripheral blood mononuclear cell (PBMC) single-nuclei RNA sequencing, skin spatially resolved gene expression and T cell and B cell immune repertoire profiling were performed. For proteins, plasma proteomics, extracellular vesicles and particles (EVP) proteomics and plasma metabolomics were quantified. Additionally, from microbial skin and environmental (Env.) swabs, bacterial, fungal and viral species were measured.
Fig. 2
Fig. 2. Virome-wide antibody analysis of blood samples self-collected during short-duration spaceflight.
Blood spot samples were collected longitudinally across all mission phases from the four Inspiration4 astronauts and analysed for IgG reactivity across a 15,000-plex peptide library representing 80 human-infecting viral species using the PepSeq assay. a, Reactivity for each sample (columns) is shown across all 1,490 peptides (rows) reactive in at least one astronaut, with samples clustered by the similarity of their reactivity profiles and peptides grouped by the virus species from which they were designed. Sample reactivity profiles clustered tightly within each astronaut, including those collected in-flight. Reactivity was detected against peptides from a total of 45 virus species, listed in Supplemental Table 3, including full names. b, Time intervals with significantly increasing (red) or decreasing (blue) IgG reactivity in the four astronauts, detected using Peptide Set Enrichment Analysis (Methods). Shown are the four virus species for which at least one significant increase was detected with the six sampling time points indicated by vertical tick marks at the top of the plot. EBV, Epstein–Barr virus; EV-A, Enterovirus A; EV-B, Enterovirus B; EV-C, Enterovirus C; EV-D, Enterovirus D; HAdV-B, Human mastadenovirus B; HAdV-C, Human mastadenovirus C; HAdV-D, Human mastadenovirus D; HHV-1, Human alphaherpesvirus 1; HHV-4, Human gammaherpesvirus 4; HHV-5, Human betaherpesvirus 5; HHV-6, Human betaherpesvirus 6; HHV-7, Human betaherpesvirus 7; HOPV, Human orthopneumovirus; HRV3, Human respirovirus 3; HRV-A, Rhinovirus A; HRV-B, Rhinovirus B; HRV-C, Rhinovirus C; NV, Norwalk virus; RV-A, Rotavirus; SARS-CoV-2, Severe acute respiratory syndrome coronavirus 2.
Fig. 3
Fig. 3. Imaging-based experiments.
a, Payload: Butterfly iQ+ ultrasound system and ResQGARD ITD7 used for physiological intervention. b, Summary plot of image quality assessment. For each image acquired, imaging success scores were calculated based on anatomical accuracy and technical quality (Methods). The mean success score for each astronaut is plotted as an individual data point, and grey-dotted bars represent the grand mean ± s.d. of astronaut success scores for each anatomical target; n = 4 astronauts, n = 14 bladder images, n = 73 IJV images and n = 19 eye images. Eye imaging success scores were different than bladder and IJV scores per one-way ANOVA and post hoc Tukey’s honest significant difference. c, A sample page from the JIT instructions for flow spontaneity assessment. d, CSA of the right IJV pre-flight in the supine position (GND) and in-flight (FLT), with and without ITD breathing. Pre-flight data were derived from a single imaging instance per astronaut, while in-flight data were averaged across in-flight instances within each astronaut (range = 1–3 imaging instances); mean IJV CSA for each astronaut is presented for each condition, along with the grand mean ± s.d. The difference between grand means for each IJV CSA assessment pre-flight (GND) and in-flight (FLT) is visualized with a black dashed linear trend line; n = 4 astronauts, n = 4 GND images, n = 4 GND ITD images, n = 8 FLT images and n = 7 FLT ITD images. No differences between pre-flight (GND) and in-flight (FLT) were found evaluated using paired, two-tailed Student’s t-tests with a significance threshold of α < 0.05.
Fig. 4
Fig. 4. Ocular misalignment before and after short-duration spaceflight.
ad, The response of the neurovestibular system to short-duration spaceflight was indexed by ocular misalignment, as a proximal measure of otolith asymmetry. The degree of vertical ocular misalignment (VAN) is shown for each of the n = 4 astronauts as follows: C001 (a), C002* (b), C003 (c), C004* (d). An asterisk denotes astronauts who reported SMS in-flight; in these astronauts (C002 and C004), VAN scores were not significantly different post-flight relative to pre-flight. Each box represents one test session (n = 2 pre-flight and n = 2 post-flight, for each astronaut), in which 11 VAN trials were performed. The horizontal bar in each box represents the median of that dataset, the box encompasses the central 50% of the dataset and the whiskers indicate the minimum and maximum values that are not outliers (outliers, which are more than three scaled median absolute deviations from the median, are indicated by circles). Two-sample two-tailed t-tests were performed for each astronaut individually to determine consistency of pre-flight and post-flight measures, and significant differences (indicating spaceflight adaptation) between pre-flight and post-flight measures.
Fig. 5
Fig. 5. Behavioural and physiological responses to short-duration spaceflight.
a,b, The standardized difference in accuracy (grey) and speed (green) of astronaut (n = 4) cognitive performance on the ten assays of the cognition test battery (n = 26 administrations) and unadjusted 95% confidence intervals. Response speed and accuracy metrics were standardized (z-scored) before analysis to allow for comparison among cognitive domains. a, Difference in cognition accuracy and speed in-flight relative to pre-flight. b, Difference in cognition accuracy and speed post-flight relative to pre-flight. c, Change in astronaut ratings of their behavioural state in-flight (blue) and post-flight (orange) relative to pre-flight and unadjusted 95% confidence intervals. Astronauts reported on their behavioural state using 11-point Likert scales using the alertness and mood survey. For a, b and c, differences between mission phases were tested using mixed-effect models contrasting in-flight and post-flight relative to pre-flight; P values were corrected for multiple comparisons using the false discovery rate method, and adjusted significant associations are denoted as: *P < 0.05; **P < 0.01; ****P < 0.0001. d, Average HRV, a measure of parasympathetic regulation of cardiac function, across 1 h measurement periods (n = 127). HRV estimates were derived from heart period data collected via the Apple Watch using the s.d. of RR intervals. Significant changes in HRV (F = 5.64, P = 0.0046) and heart rate (F = 37.10, P < 0.0001) were observed in the Inspiration4 crew across mission phases. e, One-minute averages of spacecraft CO2 levels. NASA’s current 1 h standard restricts CO2 levels to less than 3 mmHg. f, Relationship between 1 h average CO2 levels in the spacecraft and HRV for each astronaut in-flight (n = 44). AM, abstract matching; BART, balloon analogue risk test; DSST, digit–symbol substitution task; ERT, emotion recognition test; F2B, fractal 2-back; LOT, line orientation test; MP, motor praxis task; MRT, matrix reasoning test; PVT, psychomotor vigilance test; VOLT, visual object learning test.
Extended Data Fig. 1
Extended Data Fig. 1. The environmental, physiological, cognitive, imaging, and omics measures collected across Inspiration4 mission phases and their sampling frequency.
To assess the effect of short-duration spaceflight on an all-civilian crew, data were collected on myriad domains using various methodologies (colors, left) before, during, and after flight spanning human biometrics, virome, cognition, spacecraft environment, and multi-omics assays. Green circles denote samples collected on Earth (i.e., pre-flight, post-flight) and blue diamonds denote data collected in-flight, along with their respective assays. For the timing of data collection, data collected during the pre-flight period is presented as the number of days prior to launch (L) and data collected in the post-flight period is presented as the number of days following return (R) to Earth. Data with continual collection (e.g. cabin measurements) are shown as bracketed time periods.
Extended Data Fig. 2
Extended Data Fig. 2. SOMA biosample collections during the Inspiration4 mission.
Sample types and downstream assays performed for multi-omic and clinical biomarkers. A variety of blood derivatives were collected via venipuncture. Samples that have not yet been sequenced are biobanked. EVP = extracellular vesicles and particles. Env = environment. Created with BioRender.com.
Extended Data Fig. 3
Extended Data Fig. 3. Paper-based multiplexed microgravity-adapted vertical flow assay (0g-VFI).
a, Annotated exploded view of the 0g-VFI. PES, polyethersulfone. b, Pictures of the packaged 0g-VFI kit as stored in the Dragon (left) and the three different components of the 0g-VFI: (1) membrane housing with the magnifier cap, (2) assay buffer pad capsule and (3) washing buffer pad capsule. c, Schematic overview of the complete assay operation as performed during the mission, from the blood collection by fingerstick to the visual detection of the immunoglobulin M (IgM) and C-reactive protein (CRP) values, passing by the plasma separation using the Gattaco® cartridge and the different incubation and washing steps. d, Representative images of 0g-VFI membranes showing the multiplexing performance (top) and graphical quantification (bottom) of the values obtained when membranes were either incubated with no samples (ø), IgM only, CRP only or in multiplex with IgM + CRP (Data presented are mean ± SEM from three independent 0g-VFI (n = 3). e, Graph representing the average volume of assay buffer transferred to the absorbing pad when the 0g-VFI was used in microgravity during the I4 mission (Data presented are mean ± SEM; n = 3). Pictures show absorbing pads from two different 0g-VFI kits used in-flight with diameter of wet area (red circles), which informs the volume of assay buffer transferred from the wet pad during operation. f, Visual comparison of 0g-VFI membranes from kits stored in the lab and performed following standard protocol with 15 min incubation (i) with kits stored in the Dragon capsule and run in-flight for 15 min (ii) or post-flight for 90 min (iii).
Extended Data Fig. 4
Extended Data Fig. 4. 0g-Vertical Flow Immunoassay (VFI) analytical performance and quality control metrics.
a, 0g-VFI intensity for C-reactive protein (CRP) and immunoglobulin M (IgM) spots are a function of CRP and IgM concentration on multiplex membranes. CRP and IgM samples were assayed from three independent 0g-VFI (n = 3) and each CRP and IgM data point presented is the mean ± SEM of the triplicate. For each CRP and IgM plot, a four-parameter logistic model was used to generate the fitted curve and the limit of detection (LOD), represented as a dotted line, was determined using the following formula: LOD=x¯negC+3σnegC, where LOD is equal to the mean of the negative control (negC) + 3 standard deviations (σ) of the negative control. b, Intra- and inter-assay coefficients of variation (CV) across CRP and IgM assays are presented; CVs were calculated by CV (%) = (Standard Deviation/Mean) x 100. For the inter-assay CV, each point represents the CV of the control spots obtained from three independent identical replicates of 7 CRP and IgM 0g-VFI membranes (n = 14). For the intra-assay CV, each point represents the CV of the three control spots obtained within the same membranes from 43 independent CRP and IgM 0g-VFI. c, Representative intensity distribution across 0g-VFI membranes. The plot shows three IgM spots from three independent 0g-VFI membranes (R1, R2, and R3) exposed to an IgM concentration of 1 μg/mL; the average of the three IgM spots is presented in black.
Extended Data Fig. 5
Extended Data Fig. 5. Accelerated stability studies of 0g-VFI devices.
0g-VFI devices were packed: 1) in the presence of a hygroscopic substance (Desiccation, D) or 2) no hygroscopic substance (No desiccation, ø) and stored in an environmental chamber at 42 °C and 75% humidity. a, Representative 0g-VFI membranes packed with (D) and without (ø) desiccation. b, C-reactive protein (CRP) and immunoglobulin M (IgM) quantification after a 3-day incubation. Data presented are mean ± SEM from three independent 0g-VFI (n = 3).
Extended Data Fig. 6
Extended Data Fig. 6. Ocular misalignment before and after short-duration spaceflight.
Data as presented in Fig. 5. Red boxes indicate the grouping, for each astronaut, of pre-flight and the post-flight tests; an asterisk (*) denotes astronauts who experienced space motion sickness (SMS) in-flight. This shows consistency of pre-flight and post-flight tests in the non-SMS astronauts (C001 and C003). Vertical offsets of the boxes in each graph show change from pre-flight to post-flight, indicative of adaptive change during flight (larger adaptive change associated with lack of SMS). Boxes are drawn manually, to enclose the median in each case.
Extended Data Fig. 7
Extended Data Fig. 7. Cardiovascular responses to short-duration spaceflight.
a, One-hour averages of astronaut heart rate (HR) measured across all mission phases (N = 424). b, One-hour averages of astronaut heart rate variability (HRV), a measure of parasympathetic regulation of cardiac function, derived from heart period data using the standard deviation of R-R intervals across mission phases (N = 127). c, Scatter plot of astronaut blood oxygen saturation across mission phases (N = 177); blood oxygenation measurements failed in two astronauts in-flight. d, Scatter plot of one-hour averages of astronaut energy consumption across mission phases (N = 502). e, Average hourly HR for each mission phase. f, Average hourly HRV for each mission phase. g, Average hourly blood oxygen saturation for each mission phase. h, Average hourly energy consumption for each mission phase. For panels e-h, mean ± SEM with the n for each astronaut during that mission phase. Differences in cardiometabolic measures in-flight and post-flight relative to pre-flight were evaluated using mixed-effect models that nested repeated measures within astronauts contrasting the in-flight and post-flight periods with pre-flight; P-values were corrected for multiple comparisons using the false discovery rate method and adjusted significant associations are denoted as: *P < 0.05; ****P < 0.0001.
Extended Data Fig. 8
Extended Data Fig. 8. Profiles of the spacecraft environment during short-duration spaceflight.
a, One-minute averages of cabin pressure of the spacecraft measured throughout the Inspiration4 mission (FD: flight day). b, One-minute averages of temperature in the spacecraft. c, One-minute averages of partial pressure of Oxygen (O2) in the spacecraft. d, One-minute averages of relative humidity in the spacecraft. e, Scatter plot of sound pressure levels for each astronaut, measured using the Apple Watch, across mission phases; sound pressure levels were averaged arithmetically, and each point represents a one-hour average (N = 797). f, Scatter plot of barometric pressure levels for each astronaut, measured using the Apple Watch, across mission phases; each point represents a one-hour average (N = 177). g, Average sound pressure level for each astronaut during each mission phase (mean ± SEM), which was sampled twice per hour by the Apple Watch (N = 797). Sound pressure levels were similar in-flight relative to pre-flight for three of the four astronauts; one astronaut was exposed to higher sound pressure levels (C001; β = −7.152; P < 0.0001) in-flight. h, Average barometric pressure level for each astronaut during each mission phase. For panels g and h, mean ± SEM with the n for each astronaut during that mission phase. Differences in-flight and post-flight relative to pre-flight were evaluated using mixed-effect models contrasting the in-flight and post-flight periods with pre-flight; post-hoc analyses testing for differences between astronauts were corrected for multiple comparisons using the false discovery rate method. Significant associations are adjusted for multiple comparisons: *P < 0.05; **P < 0.01; ****P < 0.0001.
Extended Data Fig. 9
Extended Data Fig. 9. Profiles of astronaut cognitive performance on Cognition assays across mission phases.
Performance on each of the 10 Cognition tests is indexed by response speed in the left panel and accuracy in the right panel for each astronaut across mission phases (N = 26 Cognition administrations). For response speed outcomes, higher values represent slower response speeds; response speed on the Psychomotor Vigilance Test is inverted to match the direction of other Cognition speed metrics. For accuracy outcomes, higher values represent more accurate performance. a, Psychomotor Vigilance Test (PVT). b, Matrix Reasoning Test (MRT). c, Abstract Matching (AM). d, Line Orientation Test (LOT). e, Visual Object Learning Test (VOLT). f, Motor Praxis Task (MP). g, Emotion Recognition Test (ERT). h, Digit-Symbol Substitution Task (DSST). i, Fractal 2-Back (F2B). j, Balloon Analog Risk Test (BART). k, Aggregate Cognition speed and accuracy across tests (data for each test were standardized before averaging; BART risk taking does not contribute to the accuracy score across tests).
Extended Data Fig. 10
Extended Data Fig. 10. Astronaut report of behavioral states across mission phases.
Astronauts (N = 4) reported on their sleep duration and behavioral state using the Alertness and Mood Survey (AMS). For all 10 AMS items (panels b-k), astronauts rated their behavioral state using 11-point Likert-type scales for each item during all three phases of the mission (N = 26 for each item). AMS items are plotted on the full range of each scale and higher numbers represent higher ratings in the direction of the item at the bottom of each panel (e.g., for Poor Sleep Quality, a higher number represents worse sleep quality). For all AMS items except sleep quality and workload, astronauts were prompted to rate “how are you feeling right now?” a, Sleep duration (derived from self-reported sleep and wake-up times). b, Sleep quality (question: “How was the quality of your sleep?”; anchors: good—poor). c, High workload (question: “What was today’s workload?”; anchors: very low—very high). d, Sleepiness (anchors: not sleepy at all—very sleepy). e, Physical exhaustion (anchors: energetic—physically exhausted). f, Sickness (anchors: healthy—sick). g, Depressed (anchors: not depressed at all—very depressed). h, Unhappiness (anchors: happy—unhappy). i, Bored (anchors: good—poor). j, Monotonous (anchors: good—poor). k, Stressed (anchors: not stressed at all—very stressed).

Similar articles

  • Development of Progressively Earth-Independent Medical Operations to Enable NASA Exploration Missions.
    Anderson A, Stratton E, Nelson A, Lemery J, Berens K, Hilmers D, Lehnhardt K. Anderson A, et al. Wilderness Environ Med. 2025 Sep;36(1_suppl):95S-103S. doi: 10.1177/10806032241310386. Epub 2025 Jan 27. Wilderness Environ Med. 2025. PMID: 39865932
  • A second space age spanning omics, platforms and medicine across orbits.
    Mason CE, Green J, Adamopoulos KI, Afshin EE, Baechle JJ, Basner M, Bailey SM, Bielski L, Borg J, Borg J, Broddrick JT, Burke M, Caicedo A, Castañeda V, Chatterjee S, Chin CR, Church G, Costes SV, De Vlaminck I, Desai RI, Dhir R, Diaz JE, Etlin SM, Feinstein Z, Furman D, Garcia-Medina JS, Garrett-Bakelman F, Giacomello S, Gupta A, Hassanin A, Houerbi N, Irby I, Javorsky E, Jirak P, Jones CW, Kamal KY, Kangas BD, Karouia F, Kim J, Kim JH, Kleinman AS, Lam T, Lawler JM, Lee JA, Limoli CL, Lucaci A, MacKay M, McDonald JT, Melnick AM, Meydan C, Mieczkowski J, Muratani M, Najjar D, Othman MA, Overbey EG, Paar V, Park J, Paul AM, Perdyan A, Proszynski J, Reynolds RJ, Ronca AE, Rubins K, Ryon KA, Sanders LM, Glowe PS, Shevde Y, Schmidt MA, Scott RT, Shirah B, Sienkiewicz K, Sierra MA, Siew K, Theriot CA, Tierney BT, Venkateswaran K, Hirschberg JW, Walsh SB, Walter C, Winer DA, Yu M, Zea L, Mateus J, Beheshti A. Mason CE, et al. Nature. 2024 Aug;632(8027):995-1008. doi: 10.1038/s41586-024-07586-8. Epub 2024 Jun 11. Nature. 2024. PMID: 38862027 Free PMC article. Review.
  • Immersive gamma music as a tool for enhancing glymphatic clearance in astronauts while improving their mental well-being.
    Wostyn P, Goddaer P. Wostyn P, et al. Life Sci Space Res (Amst). 2025 Feb;44:86-89. doi: 10.1016/j.lssr.2024.10.011. Epub 2024 Oct 28. Life Sci Space Res (Amst). 2025. PMID: 39864916
  • The Black Book of Psychotropic Dosing and Monitoring.
    DeBattista C, Schatzberg AF. DeBattista C, et al. Psychopharmacol Bull. 2024 Jul 8;54(3):8-59. Psychopharmacol Bull. 2024. PMID: 38993656 Free PMC article. Review.
  • Microbiology of human spaceflight: microbial responses to mechanical forces that impact health and habitat sustainability.
    Nickerson CA, McLean RJC, Barrila J, Yang J, Thornhill SG, Banken LL, Porterfield DM, Poste G, Pellis NR, Ott CM. Nickerson CA, et al. Microbiol Mol Biol Rev. 2024 Sep 26;88(3):e0014423. doi: 10.1128/mmbr.00144-23. Epub 2024 Aug 19. Microbiol Mol Biol Rev. 2024. PMID: 39158275 Free PMC article. Review.

Cited by

References

    1. Garrett-Bakelman, F. E. et al. The NASA Twins Study: a multidimensional analysis of a year-long human spaceflight. Science364, eaau8650 (2019). - PMC - PubMed
    1. Afshinnekoo, E. et al. Fundamental biological features of spaceflight: advancing the field to enable deep-space exploration. Cell183, 1162–1184 (2020). - PMC - PubMed
    1. Urquieta, E., Wu, J., Hury, J. & Donoviel, D. Establishment of an open biomedical database for commercial spaceflight. Nat. Med.28, 611–612 (2022). - PubMed
    1. Kim, J. et al. Single-cell multi-ome and immune profiles of the Inspiration4 crew reveal cell-type, sex, and microbiome-specific responses and recovery. Nat. Commun.15, 4954 (2024). - PMC - PubMed
    1. Overbey, E. G. et al. The Space Omics and Medical Atlas (SOMA): a comprehensive data resource and international biobank for astronauts. Nature10.1038/s41586-024-07639-y (2024). - PMC - PubMed

LinkOut - more resources