. 2024 Aug;632(8027):1145-1154.
doi: 10.1038/s41586-024-07639-y. Epub 2024 Jun 11.

The Space Omics and Medical Atlas (SOMA) and international astronaut biobank

Eliah G Overbey  1   2   3   4 JangKeun Kim  5   6 Braden T Tierney  5   6 Jiwoon Park  5   6 Nadia Houerbi  5   6 Alexander G Lucaci  5   6 Sebastian Garcia Medina  5   6 Namita Damle  5 Deena Najjar  7 Kirill Grigorev  5   6 Evan E Afshin  5   6 Krista A Ryon  5 Karolina Sienkiewicz  6   8 Laura Patras  9   10 Remi Klotz  11 Veronica Ortiz  11 Matthew MacKay  8 Annalise Schweickart  6   8 Christopher R Chin  5 Maria A Sierra  8 Matias F Valenzuela  12 Ezequiel Dantas  13   14 Theodore M Nelson  15 Egle Cekanaviciute  16 Gabriel Deards  8 Jonathan Foox  5   6 S Anand Narayanan  17 Caleb M Schmidt  18   19   20 Michael A Schmidt  18   19 Julian C Schmidt  18   19 Sean Mullane  21 Seth Stravers Tigchelaar  21 Steven Levitte  21   22 Craig Westover  5 Chandrima Bhattacharya  8 Serena Lucotti  9 Jeremy Wain Hirschberg  5 Jacqueline Proszynski  5 Marissa Burke  5   23 Ashley S Kleinman  5 Daniel J Butler  5 Conor Loy  24 Omary Mzava  24 Joan Lenz  24 Doru Paul  25 Christopher Mozsary  5 Lauren M Sanders  16 Lynn E Taylor  26 Chintan O Patel  27 Sharib A Khan  27 Mir Suhail Mohamad  27 Syed Gufran Ahmad Byhaqui  27 Burhan Aslam  27 Aaron S Gajadhar  28 Lucy Williamson  28 Purvi Tandel  28 Qiu Yang  28 Jessica Chu  28 Ryan W Benz  28 Asim Siddiqui  28 Daniel Hornburg  28 Kelly Blease  29 Juan Moreno  29 Andrew Boddicker  29 Junhua Zhao  29 Bryan Lajoie  29 Ryan T Scott  30 Rachel R Gilbert  30 San-Huei Lai Polo  30 Andrew Altomare  29 Semyon Kruglyak  29 Shawn Levy  29 Ishara Ariyapala  31 Joanne Beer  31 Bingqing Zhang  31 Briana M Hudson  32 Aric Rininger  32 Sarah E Church  32 Afshin Beheshti  33   34 George M Church  35 Scott M Smith  36 Brian E Crucian  36 Sara R Zwart  37 Irina Matei  9   14 David C Lyden  9   14 Francine Garrett-Bakelman  38   39 Jan Krumsiek  5   6   8 Qiuying Chen  40 Dawson Miller  40 Joe Shuga  41 Stephen Williams  41 Corey Nemec  41 Guy Trudel  42   43   44 Martin Pelchat  45 Odette Laneuville  46 Iwijn De Vlaminck  24 Steven Gross  40 Kelly L Bolton  47 Susan M Bailey  26   48 Richard Granstein  49 David Furman  12   50   51   52 Ari M Melnick  14   25 Sylvain V Costes  16 Bader Shirah  53 Min Yu  11 Anil S Menon  37 Jaime Mateus  21 Cem Meydan  54   55   56 Christopher E Mason  57   58   59   60   61
Affiliations

The Space Omics and Medical Atlas (SOMA) and international astronaut biobank

Eliah G Overbey et al. Nature. 2024 Aug.

Abstract

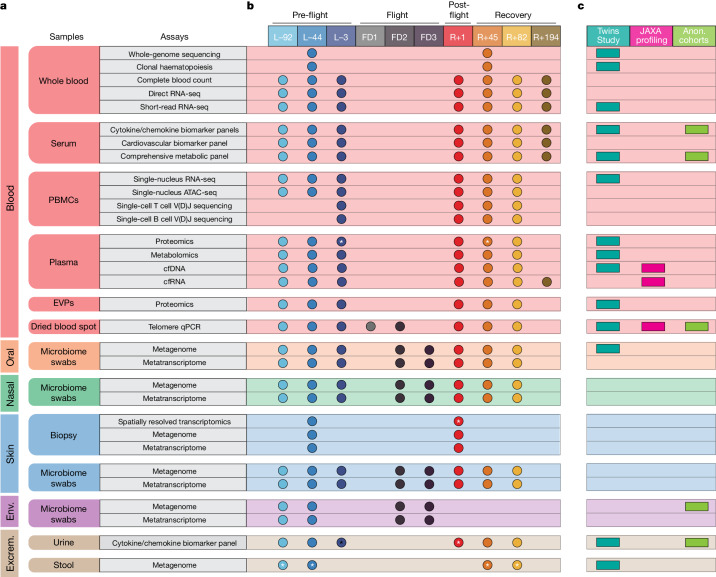
Spaceflight induces molecular, cellular and physiological shifts in astronauts and poses myriad biomedical challenges to the human body, which are becoming increasingly relevant as more humans venture into space1-6. Yet current frameworks for aerospace medicine are nascent and lag far behind advancements in precision medicine on Earth, underscoring the need for rapid development of space medicine databases, tools and protocols. Here we present the Space Omics and Medical Atlas (SOMA), an integrated data and sample repository for clinical, cellular and multi-omic research profiles from a diverse range of missions, including the NASA Twins Study7, JAXA CFE study8,9, SpaceX Inspiration4 crew10-12, Axiom and Polaris. The SOMA resource represents a more than tenfold increase in publicly available human space omics data, with matched samples available from the Cornell Aerospace Medicine Biobank. The Atlas includes extensive molecular and physiological profiles encompassing genomics, epigenomics, transcriptomics, proteomics, metabolomics and microbiome datasets, which reveal some consistent features across missions, including cytokine shifts, telomere elongation and gene expression changes, as well as mission-specific molecular responses and links to orthologous, tissue-specific mouse datasets. Leveraging the datasets, tools and resources in SOMA can help to accelerate precision aerospace medicine, bringing needed health monitoring, risk mitigation and countermeasure data for upcoming lunar, Mars and exploration-class missions.


Conflict of interest statement

B.T.T. is compensated for consulting with Seed Health and Enzymetrics Biosciences on microbiome study design and holds an ownership stake in the former. K.L.B. receives research funding from Servier and Bristol Myers Squibb, serves on the medical advisory board of GoodCell. SC Employee and is a shareholder at NanoString Technologies. K.B., J.M., A. Boddicker, J.Z., B.L., A.A., S.K. and S.L. are employees of and have a financial interest in Element Biosciences. E.E.A. is a consultant for Thorne HealthTech. A.S.G., L.W., P.T., Q.Y., J.C., R.B., A. Siddiqui and D.H. are employees of and have a financial interest in Seer Inc. and Prognomiq Inc. C. Meydan is compensated by Thorne HealthTech. C.E.M. is co-founder of Cosmica Biosciences. D.C.L. and I.M. receive research grant support/funding from Atossa Inc. R.G. is on the scientific advisory board of Elysium Health, is an advisor to Gore Range Capital and is also an informal advisor to BelleTorus Corporation, but has no financial ties to BelleTorus at this time. C.M.S., J.C.S. and M.A. Schmidt hold shares in Sovaris Holdings LLC. J. Krumsiek holds equity in Chymia LLC, intellectual property in PsyProtix and is co-founder of iollo. M.Y. is the founder and president of CanTraCer Biosciences Inc. The GC COI list is available at arep.med.harvard.edu/gmc/tech.html. A.M.M. has research funding from Jannsen, Epizyme and Daiichi Sankyo and has consulted for Treeline, AstraZeneca and Epizyme. All other authors declare no competing interests.

Figures

Fig. 1
Fig. 1. Compendium of astronaut omic data and time-series analysis paradigms.
a, Omics and biochemical assays were performed on blood (whole blood, serum, PBMCs, plasma, plasma-derived EVPs and dried blood spots), oral (microbiome swabs), nasal (microbiome swabs), skin (biopsy and microbiome swabs), environmental (env.; microbiome swabs) and excrement (excrem.; urine and stool) samples. b, The timepoints of this study are separated into four different categories: pre-flight (L−92, L−44 and L−3), in-flight (FD1, FD2 and FD3), post-flight (R+1) and recovery (R+45, R+82 and R+194). The coloured circles indicate which assay was performed at each timepoint. Assays were performed on all crew members, unless denoted with an asterisk. c, Indicator for which assay types have been previously performed in spaceflight studies, broken down by the NASA Twins Study, JAXA studies and anonymized NASA cohort studies. Anon., anonymized.
Fig. 2
Fig. 2. Telomere and cytokine Twins Study comparison.
a, Normalized average telomere lengths for I4 crew members, pre-flight, during flight and post-flight, determined by qPCR analyses of blood (DNA) collected on dried blood spot (DBS) cards (n = 32 samples for 4 independent participants across 8 timepoints). Two-sided P values were derived using a mixed-effects linear model that incorporated fixed effects for different timepoints (pre-flight, in-flight, post-flight and recovery) and random effects to account for variations among participants. The centre of the boxplots represents the median, the box hinges encompass the first and third quartiles, and the whiskers extend to the smallest and largest values no further than 1.5 × the interquartile range (IQR) away from the hinges. b, Changes in downregulated (DN; purple) and upregulated (UP; orange) gene expression log2 fold-change directionality post-flight from the Twins Study versus I4 in CD19 B cells, CD4+ T cells and CD8+ T cells (statistical significance was determined by a two-sided Wilcoxon rank-sum test). The number of genes is shown below the violin plots. The centre white dot represents the median, and the white line shows the range of the first and third quartiles. c, Relative cytokine/chemokine abundance pre-flight, post-flight and during recovery in the I4 crew versus the NASA Twins Study and anonymized NASA astronaut cohorts for CCL2, IL-10 and IL-6. MLBT, multiplexing LASER bead technology. Pre, pre-flight median; Post, post-flight (R+1). d, Relative abundance of BDNF and IL-19 pre-flight, post-flight and during recovery in the I4 crew. In panels c and d, the two-sided P values and adjusted q values were derived using a mixed-effects model that incorporated fixed effects for different timepoints (pre-flight, in-flight, post-flight and recovery) and random effects to account for variations among participants, except in the Twins Study, which had a single participant (n = 1). P values with an asterisk have a q > 0.05 after multiple correction testing.
Fig. 3
Fig. 3. Body-wide tissue stress map with cfRNA.
a, Cell-type deconvolution using Bayes Prism with Tabula Sapiens as a reference. Top ten cell types by average fraction across all samples with all remaining cell types summed together as ‘other’. b, Cell type of origin for hepatocytes, endothelial cells, haematopoietic stem cells and melanocytes, which all show increased abundance during post-flight and recovery timepoints. c, Cell proportion changes in different layers of the skin from spatially resolved transcriptomics on skin biopsies. Predicted melanocyte abundance changes are significant in the inner epidermal and outer dermal skin compartments. In panels b and c, n = 4 independent participants across 7 timepoints. The centre of the boxplots represent the median, the box hinges encompass the first and third quartiles, and the whiskers extend to the smallest and largest values no further than 1.5 × IQR away from the hinges. NS, not significant; **P ≤ 0.01; ***P ≤ 0.001.
Fig. 4
Fig. 4. Recovery profile dynamics in PBMCs.
a, Number of DEGs from PBMC snRNA-seq for each cell type during the flight, recovery and longitudinal profiles (adjusted two-sided P < 0.05, |log2FC| > 0.5). NK, natural killer. b, Fraction of DEGs shared with FP1 at RP1, RP2 and LP2 for each cell type. c, Directionality of log2FC between FP1 and RP1 and RP2 for DEGs present in both profiles. d, Bar chart of pathways of DEGs present in RP1 that were absent in FP1 in monocytes and T cells. Bars are shaded by the false discovery rate (FDR) value, and the enrichment ratio is on the x axis.
Fig. 5
Fig. 5. Pathway enrichment of most variable genes.
Enriched pathways in post-flight compared with pre-flight across various assays and missions, analysed using fast gene set enrichment analysis (fGSEA). The colour represents the normalized enrichment score, whereas the dot size indicates Benjamini–Hochberg adjusted q values. Only the pathways with unadjusted P < 0.01 are shown. The barplot shows the total number of comparisons with q < 0.05 for every pathway, coloured by the direction of the enrichment. The column ‘mixed cell type’ refers to whole blood for I4 data and lymphocyte-depleted cells for the NASA Twins Study. GOBP, gene ontology and biological process; GOMF, gene ontology molecular function; HP, human phenotype; LPS, lipopolysaccharides; NPC, neural progenitor cells; PID, pathway interaction database; WP, wikipathways.
Extended Data Fig. 1
Extended Data Fig. 1. Prior Work and Comparative Profiles.
(a) Prior human spaceflight omics study and sample counts with publicly available data, which is housed in OSDR. (b) Total number of sequence nucleic acid molecules in all prior studies (OSDR, blue) compared to this study (Inspiration4, red). (c) Visualization of the different analysis paradigms used when analyzing the time-series spaceflight data. The database identifier is provided as a shorthand to reference each comparison.
Extended Data Fig. 2
Extended Data Fig. 2. Pipelines Overview.
Computational pipelines for (a) 10x Genomics Multiome sequencing (snRNA and snATAC), (b) ONT direct RNA-sequencing gene expression and m6A detection, (c) Nanostring GeoMx whole transcriptome atlas profiling, (d) cfRNA gene abundances, (e) T-cell repertoire and B-cell repertoire V(D)J immune profiling, (f) plasma processing for proteomic, metabolomic, and EVP proteomic profiling, and (g) microbial profiling.
Extended Data Fig. 3
Extended Data Fig. 3. Transcriptomic Fingerprint of Short Duration Spaceflight.
(a) Representative spatial imaging of skin biopsy tissue for each crew member (C001, C002, C003, and C004). Processing was done in two batches and across four ROI types. (b) UMAP projection of the ROIs. The colors represent ROI types and shapes represent time points. Most of the ROIs showed good clustering around ROI types in both time points. (c) Heatmap visualization of top variable genes across ROIs and time points in skin biopsies. (d) PCA on scaled vst normalized counts of top 500 variable genes in cfRNA data. (e) Z-score of vst normalized cfRNA abundances from DESeq2 (BH adjusted two-sided p-value < 0.01, |log2FC | > 1). Total of 927 genes. (f) cfDNA RNA species elevated pre-flight vs post-flight. Top 500 displayed for each group ranked by log2 fold-change.
Extended Data Fig. 4
Extended Data Fig. 4. Direct RNA-seq Gene Expression and RNA m6A Modifications Across 13 Comparative Profiles.
(a) Patterns of gene expression across seven time points and 13 comparisons. Left: z-scored log-transformed normalized gene counts obtained from salmon (bottom left of each cell) and featureCounts (top right of each cell). Right: log2(fold-change) values obtained from edgeR (bottom left of each cell) and from DESeq2 (top right of each cell). The genes are clustered by z-scored log-transformed normalized counts using the correlation distance metric. (b) Patterns of base-level m6A modifications across seven time points and 13 comparisons. Left: z-scored log-transformed positional methylation probabilities obtained from m6anet. Right: percentage of change in methylation between the conditions in each comparison, obtained from methylKit. The sites are clustered by the pattern of differential methylation across all comparisons using the correlation distance metric. On both panes (a) and (b), only the genes and sites with significant differences in expression and/or methylation in at least one comparison are plotted; the significance of individual comparisons is annotated with up and down arrows.
Extended Data Fig. 5
Extended Data Fig. 5. Single-Nuclei RNA-Sequencing Controls.
(a) The number of DEGs in I4 flight profiles (FP1: grouped crew or individual crew members), I4 longitudinal profiles (LP3: grouped crew or individual crew members), and negative control groups (mock control day 2 vs day 1, mock control same day technical replicate differences, and I4 inter-subject comparisons in preflight). All comparisons were done with downsampling to the same number of cells. Intra-timepoint subject comparisons are crew-to-crew comparison in the pre-flight (L-92, L-44, L-3), immediately post-flight (R + 1), and recovery (R + 45, R + 82) time intervals. The bars show the mean of the total number of DEGs, and error bars show the standard error for groups that have 3 or more comparisons summarized. (n = 4 independent subjects with 6 timepoints, and n = 1 control subject with 2 timepoints and 3 technical scRNAseq replicates for each timepoint.) (b) The number of total DEGs identified by DESeq2 and pseudobulk counts in I4 flight profiles (FP1), I4 longitudinal profiles (LP3), and negative control groups (mock control day 2 vs day 1). All comparisons were done with aggregation into a single sample for each crew and each cell type. The bars show the mean of the total number of DEGs. (c) DEG directionality heatmap represents the overlap of up-regulated (orange) and down-regulated (purple) DEGs across comparison groups (I4 timepoint comparisons, I4 individual variation, 10x negative controls). (d) Heatmap representing the log2 fold-change of I4-FP1 up-regulated and down-regulated PBMC DEGs in each comparison group (I4 timepoint comparisons, I4 individual variation, 10x Genomics negative controls).
Extended Data Fig. 6
Extended Data Fig. 6. Recovery Profile Analysis.
(a) DEGs shared between the T cell and monocyte lineages for DEGs present in RP1, but not present in the FP1 profile. (b) Overrepresented KEGG pathways from DEG sets unique to the RP1 profile in the t-cell and monocyte lineages. The percent of pathways unique to each cell type are quantified along with the various configurations in which the pathway is shared between cell types and lineages.
Extended Data Fig. 7
Extended Data Fig. 7. Single-Nuclei ATAC-seq and TFBSs.
(a) log2 fold-change of chromatin accessibility at promoters of genes that are differentially expressed in FP across different cell types. Promoters are defined as the transcription start site ± 500 bp of a given gene. Two-sided p-values were calculated by Wilcoxon rank-sum test. Violin plots show the density of the points, and the center white dot represents the median, and the white line shows the range of the first and third quartiles. (b) Directionality of delta z-score for motif accessibility between flight profile FP1 and recovery profiles RP1 and RP2 for significant TF motifs of FP1 present in either RP1 or RP2. (c) Heatmap of accessibility z-score of top5 significantly increased and decreased TFs in each cell type in FP1. (d) Heatmap of accessibility z-score of top5 significantly increased and decreased TFs in each cell type in RP1. (e) Heatmap of accessibility z-score of top5 significantly increased and decreased TFs in each cell type in RP2.
Extended Data Fig. 8
Extended Data Fig. 8. Coefficients of Variation (CVs) for Microbial Taxa Across Body Sites.
(a-j) CVs for different microbial taxa from oral, forearm, nasal, gluteal crease, occiput, axillary vault, umbilicus, glabella, post-auricular, and toe web space regions generated from skin swabs. CVs are calculated from both metagenomic and metatranscriptomic sequencing data.
Extended Data Fig. 9
Extended Data Fig. 9. CV Analysis of Datasets by Time Interval.
(a-f) Abundance standardized CVs for the human omics assays across pre-flight, post-flight, and recovery time intervals. The most variable analytes are labeled at the top of each violin plot. CV is calculated across n = 4 independent subjects in 6 to 7 timepoints for p = 16283, 8464, 527, 1765, 656, 203 analytes respectively from a to f. The center dot represents the median, and the black line shows the range of the first and third quartiles.
Extended Data Fig. 10
Extended Data Fig. 10. SOMA Web Portals.
(a) Three different web portals were created: SOMA Browser, Single-Cell Browser, and Microbial Browser. The SOMA Browser includes (b) gene expression and protein abundance measurements in line chart and volcano plot formats, (c) log fold change calculations, and (d) comparison of DEGs across different contrasts, assays, studies, and organisms (statistical tests dependent on comparison, please see website). (e) The Single-Cell Browser enables visualization of cell type specific information, including gene co-expression and ATAC-seq region peak visualization. (f) The Microbial Browser includes microbial abundances across timepoints from different annotation databases for metagenomic and metatranscriptomic datasets (n = 4 independent subjects for 8 timepoints and 12 collection sites, or n = 9 environmental samples for 4 timepoints). The center of the boxplots represent the median, the box hinges encompass the first and third quartiles, and whiskers extend to the smallest and largest value no further than the 1.5x interquartile range (IQR) away from the hinges.

References

    1. Bushnell, D. M. & Moses, R. W. Commercial space in the age of ‘new space’, reusable rockets and the ongoing tech revolutions. NASAhttps://ntrs.nasa.gov/citations/20180008444 (2018).
    1. Lang, T. et al. Towards human exploration of space: the THESEUS review series on muscle and bone research priorities. NPJ Microgravity3, 8 (2017). 10.1038/s41526-017-0013-0 - DOI - PMC - PubMed
    1. Martin Paez, Y., Mudie, L. I. & Subramanian, P. S. Spaceflight associated neuro-ocular syndrome (SANS): a systematic review and future directions. Eye Brain12, 105–117 (2020). 10.2147/EB.S234076 - DOI - PMC - PubMed
    1. Crucian, B. E. et al. Immune system dysregulation during spaceflight: potential countermeasures for deep space exploration missions. Front. Immunol.9, 1437 (2018). 10.3389/fimmu.2018.01437 - DOI - PMC - PubMed
    1. Trudel, G., Shahin, N., Ramsay, T., Laneuville, O. & Louati, H. Hemolysis contributes to anemia during long-duration space flight. Nat. Med.28, 59–62 (2022). 10.1038/s41591-021-01637-7 - DOI - PMC - PubMed

MeSH terms

LinkOut - more resources