

Genetic and phenotypic associations of frailty with cardiovascular indicators and behavioral characteristics
- PMID: 38862035
- PMCID: PMC12126737
- DOI: 10.1016/j.jare.2024.06.012
Genetic and phenotypic associations of frailty with cardiovascular indicators and behavioral characteristics
Abstract
Introduction: Frailty Index (FI) is a common measure of frailty, which has been advocated as a routine clinical test by many guidelines. The genetic and phenotypic relationships of FI with cardiovascular indicators (CIs) and behavioral characteristics (BCs) are unclear, which has hampered ability to monitor FI using easily collected data.
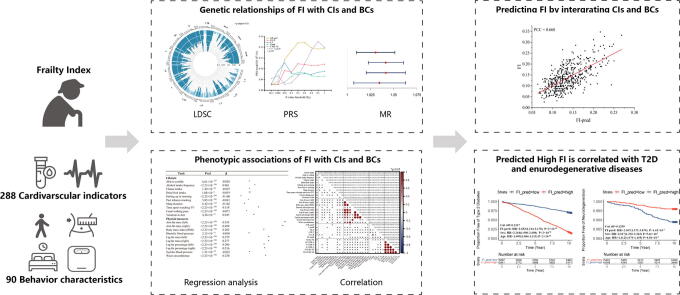
Objectives: This study is designed to investigate the genetic and phenotypic associations of frailty with CIs and BCs, and further to construct a model to predict FI.
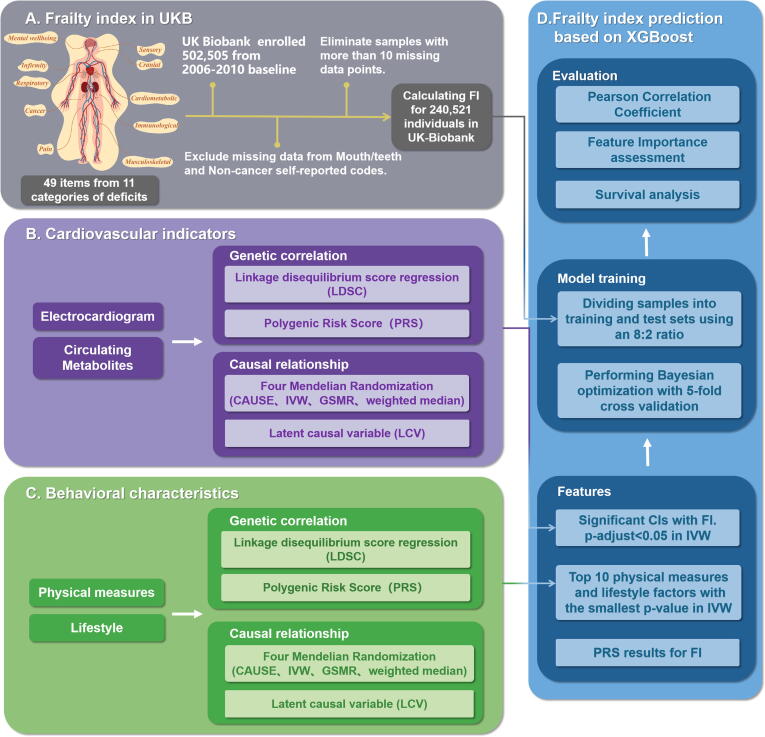
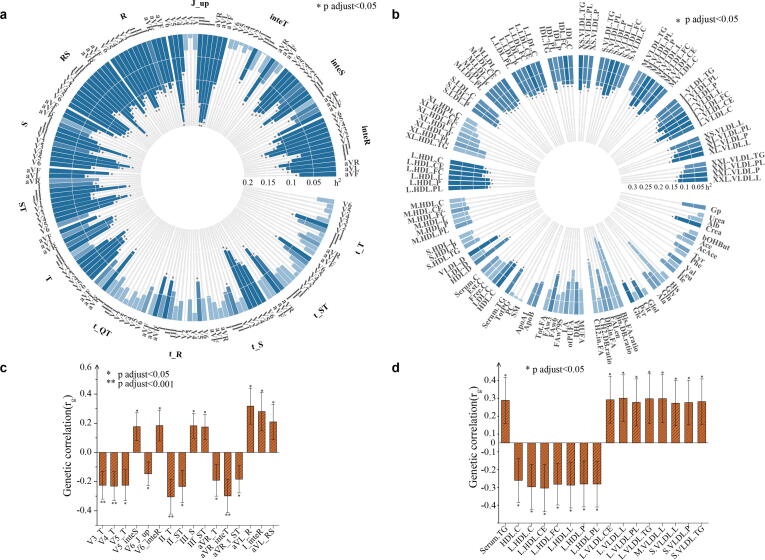
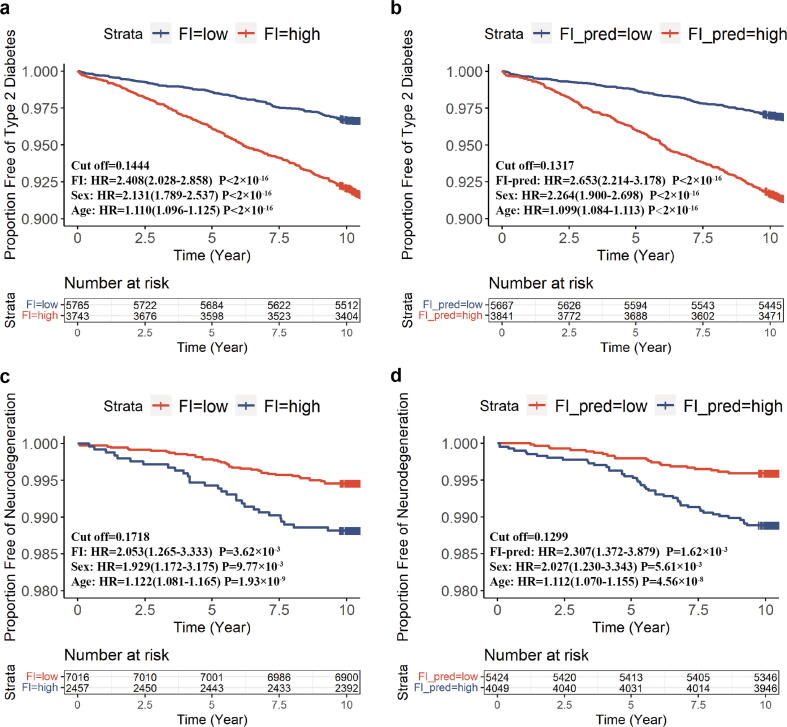
Method: Genetic relationships of FI with 288 CIs and 90 BCs were assessed by the cross-trait LD score regression (LDSC) and Mendelian randomization (MR). The phenotypic data of these CIs and BCs were integrated with a machine-learning model to predict FI of individuals in UK-biobank. The relationships of the predicted FI with risks of type 2 diabetes (T2D) and neurodegenerative diseases were tested by the Kaplan-Meier estimator and Cox proportional hazards model.
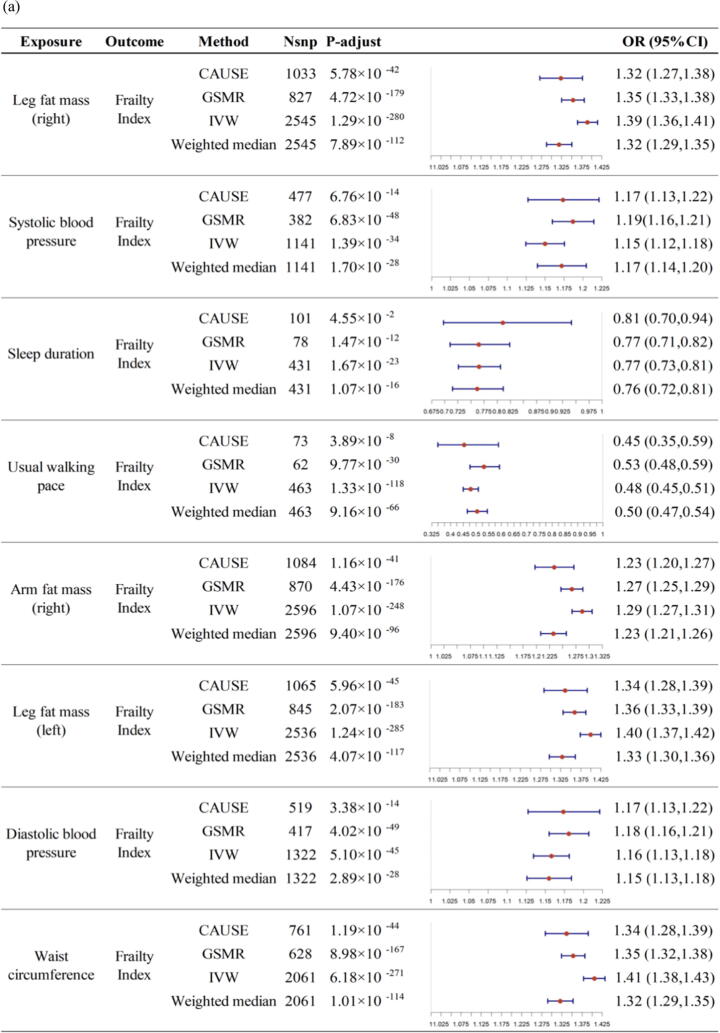
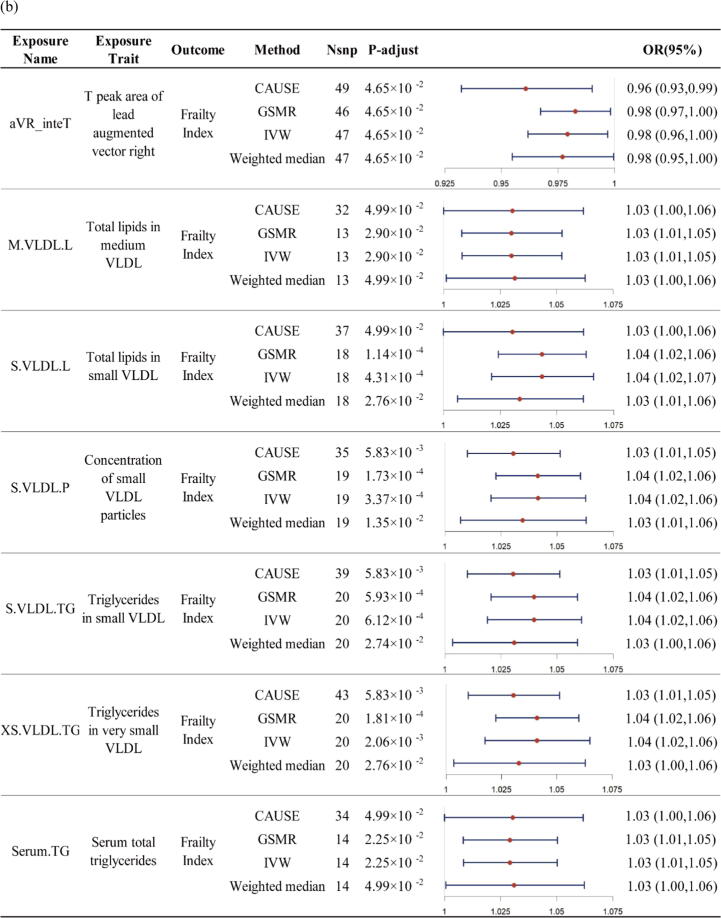
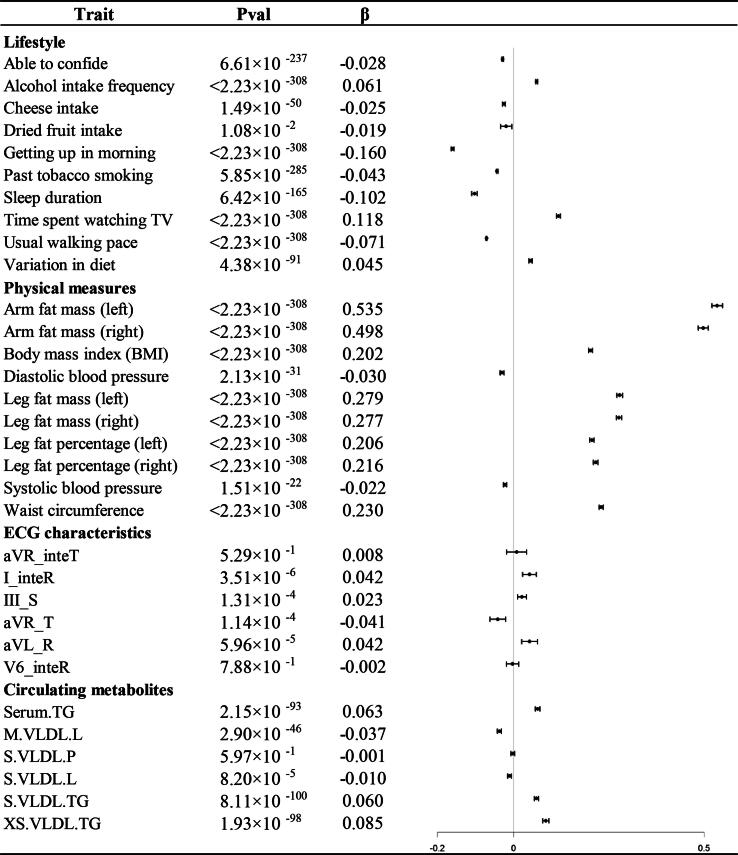
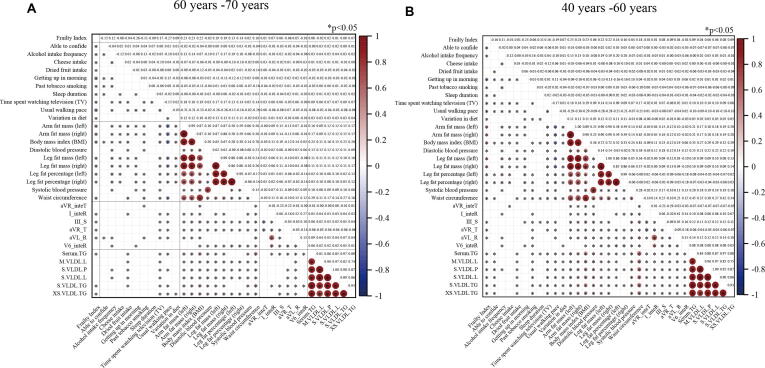
Results: MR revealed putative causal effects of seven CIs and eight BCs on FI. These CIs and BCs were integrated to establish a model for predicting FI. The predicted FI is significantly correlated with the observed FI (Pearson correlation coefficient = 0.660, P-value = 4.96 × 10-62). The prediction model indicated "usual walking pace" contributes the most to prediction. Patients who were predicted with high FI are in significantly higher risk of T2D (HR = 2.635, P < 2 × 10-16) and neurodegenerative diseases (HR = 2.307, P = 1.62 × 10⁻³) than other patients.
Conclusion: This study supports associations of FI with CIs and BCs from genetic and phenotypic perspectives. The model that is developed by integrating easily collected CIs and BCs data in predicting FI has the potential to monitor disease risk.
Keywords: Behavioural characteristics; Electrocardiography; Frailty Index; Genome-wide association study; Mendelian randomization.
Copyright © 2024. Published by Elsevier B.V.
Conflict of interest statement
Declaration of competing interest The authors declare that they have no known competing financial interests or personal relationships that could have appeared to influence the work reported in this paper.
Figures
Similar articles
-
Association between non-insulin-based insulin resistance indicators and frailty progression: a national cohort study and mendelian randomization analysis.Cardiovasc Diabetol. 2025 Jan 22;24(1):31. doi: 10.1186/s12933-025-02597-9. Cardiovasc Diabetol. 2025. PMID: 39844267 Free PMC article.
-
Association of frailty with respiratory tract infections: Evidence from cross-sectional analysis and mendelian randomization.Exp Gerontol. 2025 Jun 15;205:112753. doi: 10.1016/j.exger.2025.112753. Epub 2025 Apr 11. Exp Gerontol. 2025. PMID: 40222596
-
The bidirectional association between frailty index and cardiovascular disease: A Mendelian randomization study.Nutr Metab Cardiovasc Dis. 2024 Mar;34(3):624-632. doi: 10.1016/j.numecd.2023.10.018. Epub 2023 Oct 24. Nutr Metab Cardiovasc Dis. 2024. PMID: 38176958
-
Genetically Predicted Frailty Index Is Associated With Increased Risk of Multiple Metabolic Diseases: 175 226 European Participants in a Mendelian Randomization Study.J Diabetes. 2025 Mar;17(3):e70062. doi: 10.1111/1753-0407.70062. J Diabetes. 2025. PMID: 40024880 Free PMC article.
-
Genetically-predicted effects of lifestyle factors on frailty: Evidence from Mendelian randomization study.Arch Gerontol Geriatr. 2025 Feb;129:105662. doi: 10.1016/j.archger.2024.105662. Epub 2024 Oct 17. Arch Gerontol Geriatr. 2025. PMID: 39461086
Cited by
-
Causal associations of frailty and type 2 diabetes mellitus: A bidirectional Mendelian randomization study.Medicine (Baltimore). 2025 Mar 7;104(10):e41630. doi: 10.1097/MD.0000000000041630. Medicine (Baltimore). 2025. PMID: 40068076 Free PMC article.
-
Epigenetic Biomarkers of Cardiovascular Risk in Frail Patients-A Scope Review.Curr Issues Mol Biol. 2025 Jun 5;47(6):422. doi: 10.3390/cimb47060422. Curr Issues Mol Biol. 2025. PMID: 40699821 Free PMC article. Review.
-
The impact of ambient temperature on frailty progression in older adults: Evidence from a longitudinal study in China.Front Public Health. 2025 Jun 3;13:1507400. doi: 10.3389/fpubh.2025.1507400. eCollection 2025. Front Public Health. 2025. PMID: 40529676 Free PMC article.
References
-
- Proietti M., Cesari M. Springer International Publishing; Cham: 2020. Frailty: What Is It? Advances in Experimental Medicine and Biology; pp. 1–7. - PubMed
MeSH terms
LinkOut - more resources
Full Text Sources
Research Materials
