. 2024 Feb 7:82:ftae004.
doi: 10.1093/femspd/ftae004.

Effects of prime-boost strategies on the protective efficacy and immunogenicity of a PLGA (85:15)-encapsulated Chlamydia recombinant MOMP nanovaccine

Affiliations

Effects of prime-boost strategies on the protective efficacy and immunogenicity of a PLGA (85:15)-encapsulated Chlamydia recombinant MOMP nanovaccine

Rajnish Sahu et al. Pathog Dis. .

Abstract

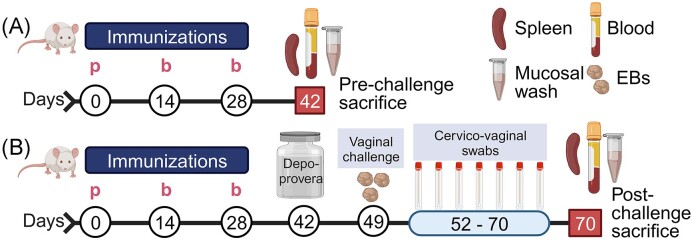
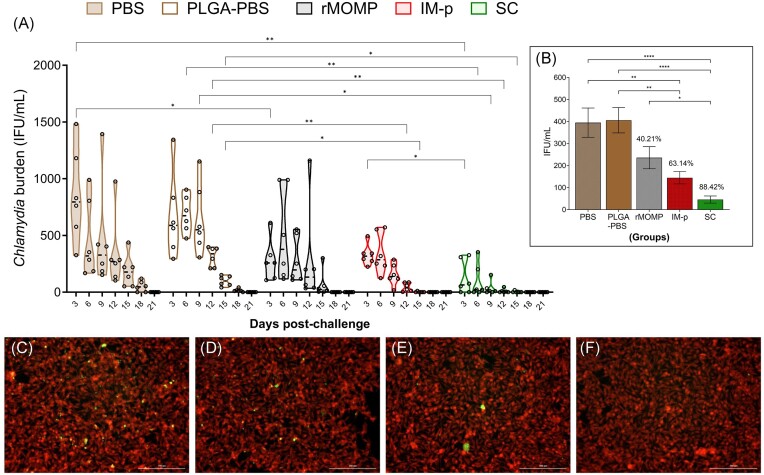
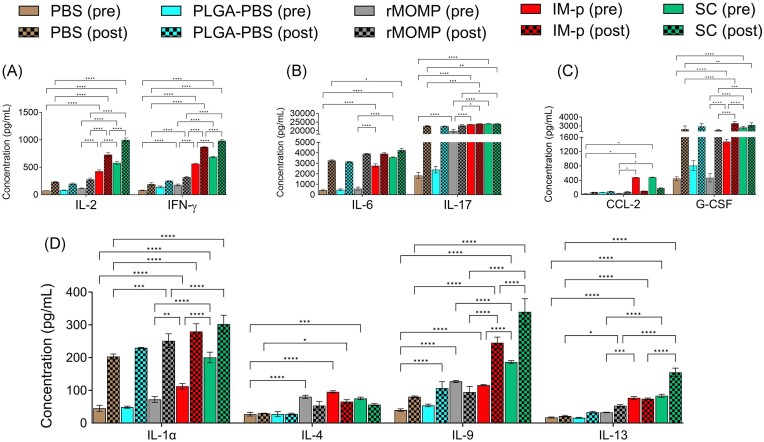
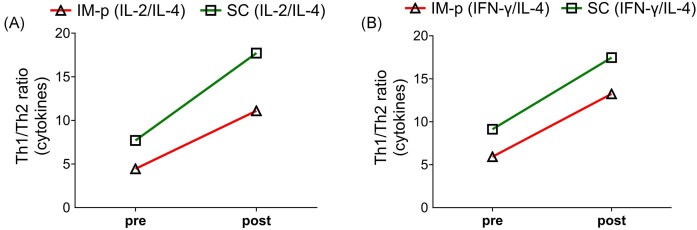
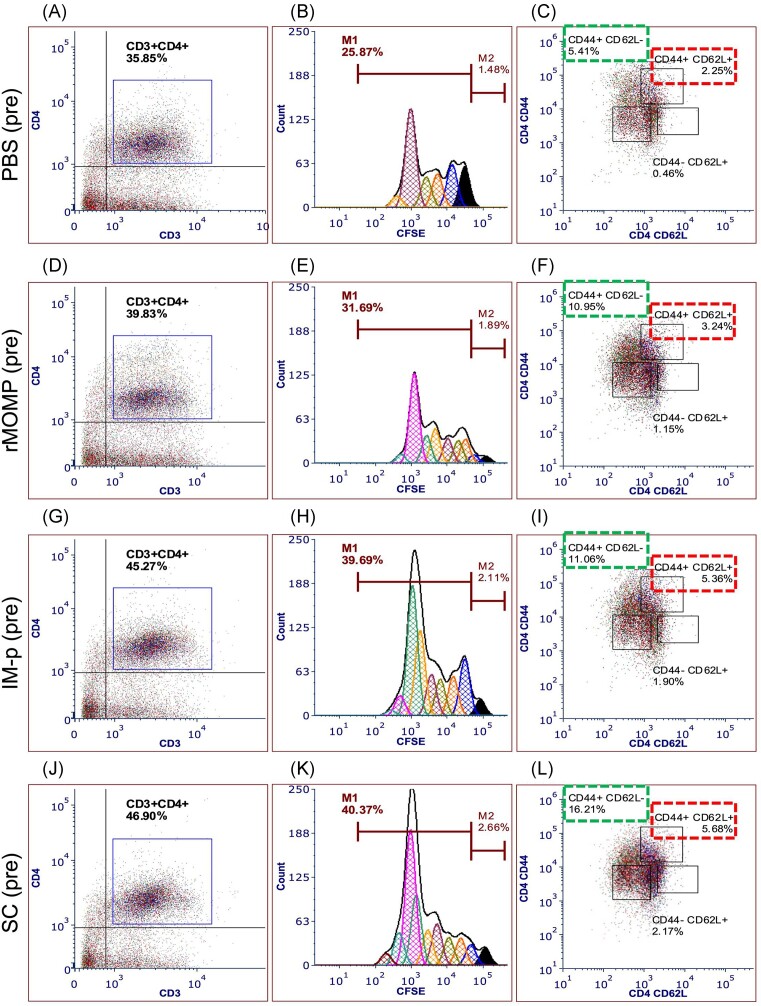
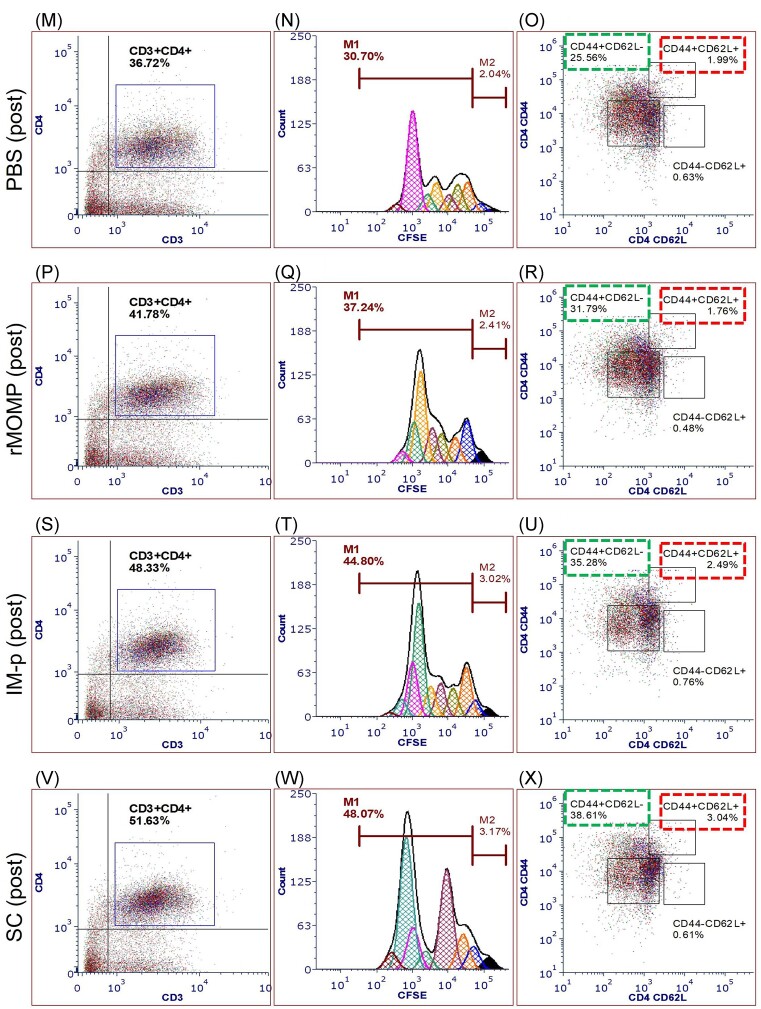
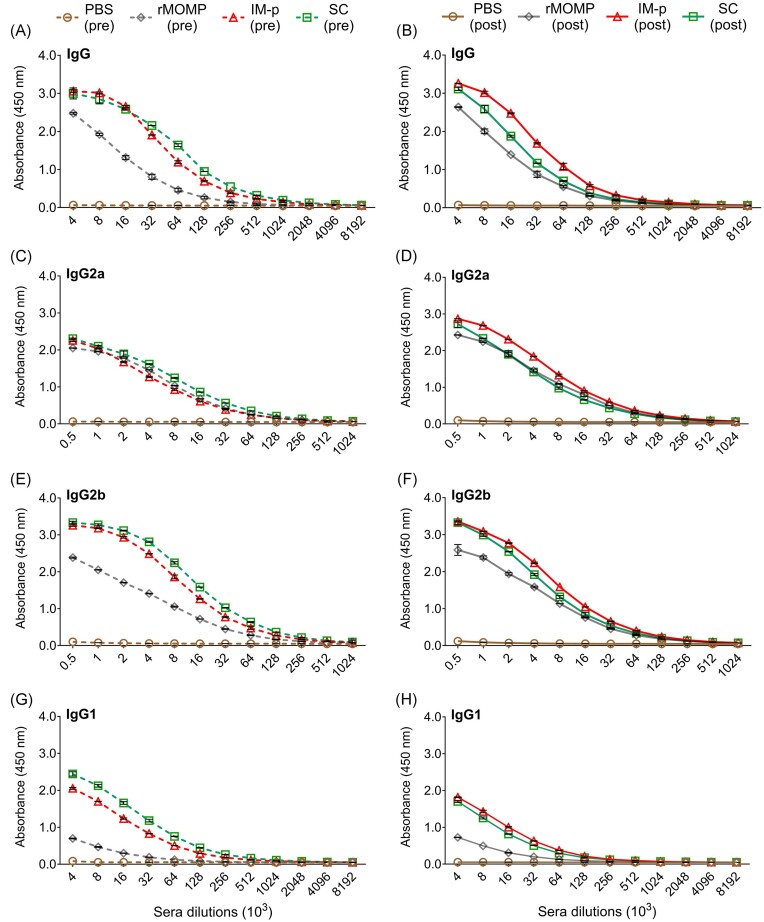
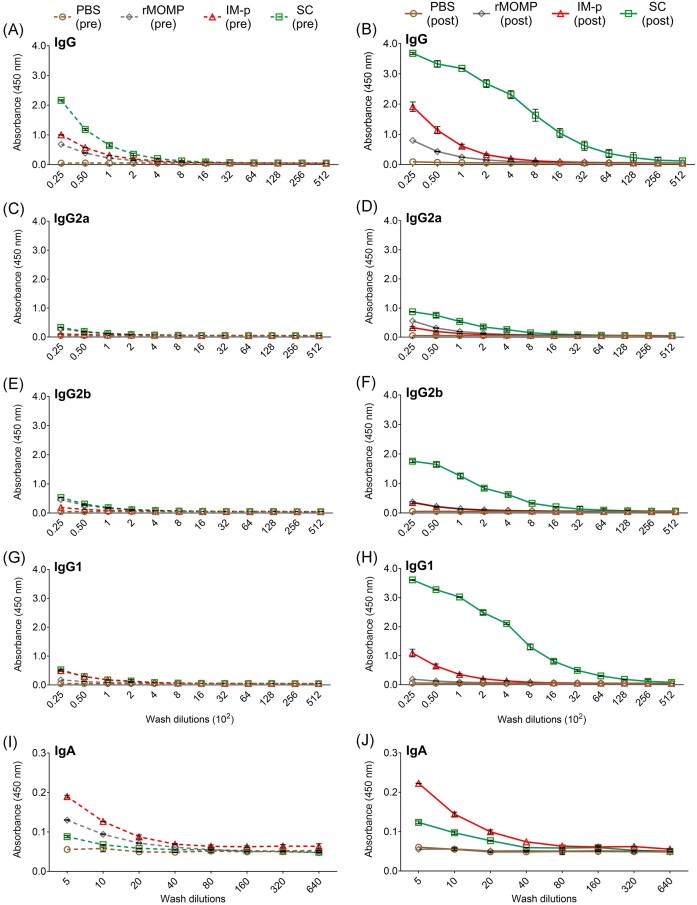
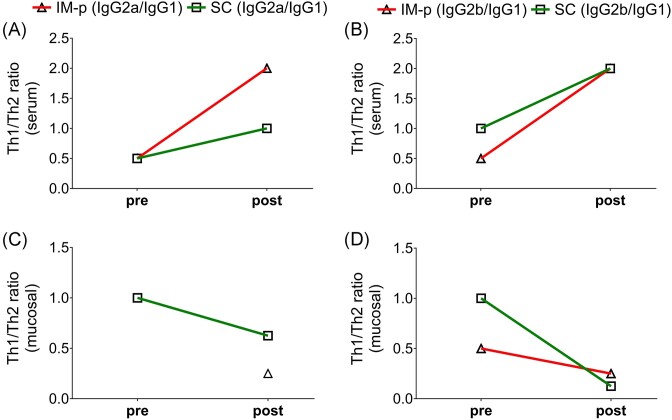
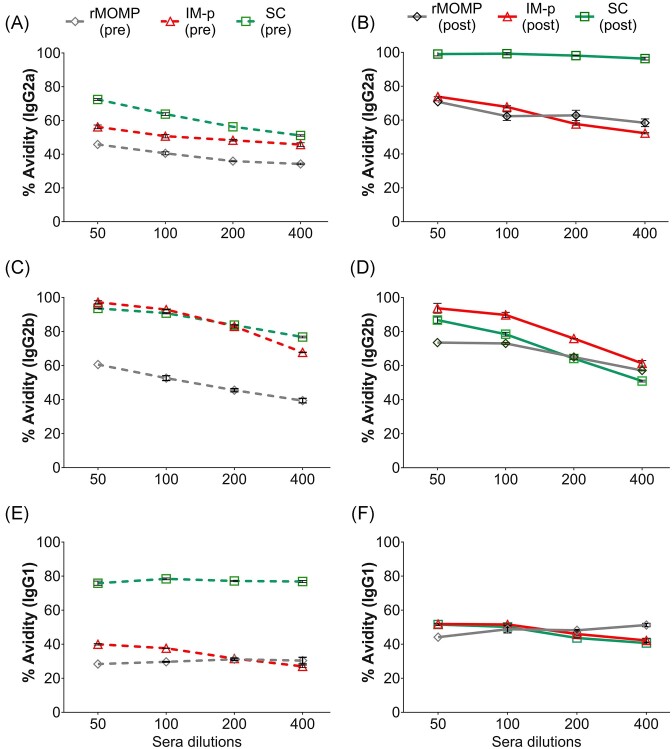
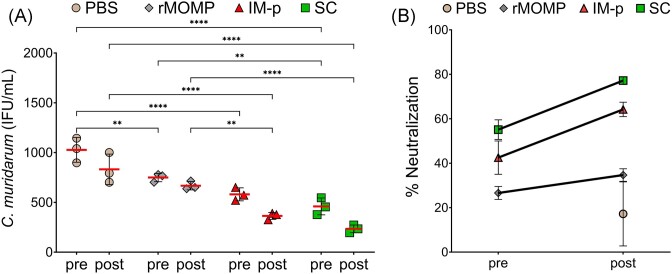
To begin to optimize the immunization routes for our reported PLGA-rMOMP nanovaccine [PLGA-encapsulated Chlamydia muridarum (Cm) recombinant major outer membrane protein (rMOMP)], we compared two prime-boost immunization strategies [subcutaneous (SC) and intramuscular (IM-p) prime routes followed by two SC-boosts)] to evaluate the nanovaccine-induced protective efficacy and immunogenicity in female BALB/c mice. Our results showed that mice immunized via the SC and IM-p routes were protected against a Cm genital challenge by a reduction in bacterial burden and with fewer bacteria in the SC mice. Protection of mice correlated with rMOMP-specific Th1 (IL-2 and IFN-γ) and not Th2 (IL-4, IL-9, and IL-13) cytokines, and CD4+ memory (CD44highCD62Lhigh) T-cells, especially in the SC mice. We also observed higher levels of IL-1α, IL-6, IL-17, CCL-2, and G-CSF in SC-immunized mice. Notably, an increase of cytokines/chemokines was seen after the challenge in the SC, IM-p, and control mice (rMOMP and PBS), suggesting a Cm stimulation. In parallel, rMOMP-specific Th1 (IgG2a and IgG2b) and Th2 (IgG1) serum, mucosal, serum avidity, and neutralizing antibodies were more elevated in SC than in IM-p mice. Overall, the homologous SC prime-boost immunization of mice induced enhanced cellular and antibody responses with better protection against a genital challenge compared to the heterologous IM-p.

Keywords: Chlamydia; l-lactic-co-glycolide)] nanoparticles; IFN-γ; PLGA [poly (d; immunization routes.


Conflict of interest statement

The authors declare no conflict of interest.

Figures

Figure 1.
Figure 1.
Schematic of immunization and challenge. (A) Female BALB/c mice (six per group) were each given PLGA-rMOMP (50 µg) on day 0 for priming (p) via the IM-p (heterologous) or SC (homologous) routes. IM-p and SC mice each received two boosters (b) immunization of PLGA-rMOMP (50 µg) via the SC route on days 14 and 28 and then sacrificed on day 42 (six per group) for immunogenicity studies. (B) For efficacy studies, immunized mice (six per group) were each challenged via the intravaginal route with live Cm IFU (1 × 105) on day 49, followed by a collection of cervico-vaginal swabs at 3-day intervals up to 3-weeks to quantify Cm IFU followed by sacrifice on day 70. Some mice received rMOMP (50 µg) or PBS via the SC route to serve as controls. After each sacrifice (days 42 and 70), spleens (for T-cells), blood (for serum), and mucosal washes were collected to evaluate cellular and humoral immune responses before and after a challenge. (Illustration created in Biorender.com).
Figure 2.
Figure 2.
SC rather than the IM-p prime-boost immunization provides better protection against a genital chlamydial challenge. Mice were each given PLGA-rMOMP (50 µg) as priming via the IM-p (heterologous) or SC (homologous) routes. IM-p and SC mice each received two booster immunization of PLGA-rMOMP (50 µg) via the SC route at 2-week intervals and then challenged via the intravaginal route with live Cm IFU (1 × 105). Cervico-vaginal swabs were collected at 3-day intervals up to 3-weeks and propagated in McCoy fibroblasts to quantify recovered Cm IFU from swabs. (A) Each floating bar represents the minimum and maximum range for the IFU counts (IFU/ml) from individual swabs, and the horizontal middle dotted line represents the mean of IFU/ml for each group of mice after challenge. (B) Graph insert represents the average of total IFU/ml (mean ± SE) calculated for each group between days 3 and 18, and presented as a % reduction of IFU compared to the PBS control. Immunofluorescence microscopic visualization of Cm IFU (green) cytoplasm in fibroblasts (red). Fibroblasts were exposed to swabs collected from mice on day 12 after the challenge. (C) PBS, (D) rMOMP, (E) IM-p, and (F) SC groups. Statistical analyses were performed using two-way ANOVA followed by Tukey’s Post-test (A) and average IFU comparison was performed using one-way ANOVA (B). Significant differences in IFU counts were considered at *P < .05, **P < .01, and ****P < .0001. No exclusions were applied for IFU counts.
Figure 3.
Figure 3.
Production of rMOMP-specific cytokines and chemokines after immunization (pre), challenge (post). Mice were immunized and challenged, as shown in Fig. 1. Immunomagnetic purified splenic T-cells (1 × 106) from immunized (pre) and immunized-challenged mice (post) were cocultured with mitomycin-C treated APCs (1 × 106) and stimulated with rMOMP (5 µg/ml) for 120 h at 37°C in a 5% CO2-humidified atmosphere. Cell-free supernatants were collected by centrifugation and used for quantification of cytokines. (A) IL-2, IFN-γ (B) IL-6, IL-17, (C) CCL-2, G-CSF, and (D) IL-1α, IL-4, IL-9, and IL-13. Statistical analyses were performed using two-way ANOVA followed by Tukey’s Post-test. Significance was established at *P < .05 **P < .01, ***P < .001, and ****P < .0001.
Figure 4.
Figure 4.
Th1, Th2 cytokines ratio. The Th1 (IL-2 or IFN-γ)/Th2 (IL-4) ratios were calculated between the groups immunized (pre) or immunized-challenged (post) and plotted as comparison between pre and post. Ratio (A) (IL-2/IL-4) and (B) (IFN-γ/IL-4).
Figure 5.
Figure 5.
Chlamydia-specific CD4+ T-cells proliferation and memory and effector phenotypes in immunized and immunized-challenged mice. Groups of mice were immunized and challenged, as described in Fig. 1 legend. Immunomagnetic purified splenic T-cells (1 × 106) from immunized (pre) and immunized-challenged mice (post) were cocultured with mitomycin-C treated APCs (1 × 106) and stimulated with rMOMP (5 µg/ml) for 120 h at 37°C in a 5% CO2-humidified atmosphere. Cocultures were centrifuged, and cells were stained with fluorochrome-labeled specific antibodies for CD3, CD4, CD44, and CD62 L surface markers. Cells were acquired on a flow cytometer and analyzed by gating on CD3+ T-cells with secondary gating on CFSE+CD3+CD4+ T-cells for proliferating memory (CD44+ CD62L+) and effector (CD44+ CD62L) T-cells phenotypes. Immunized mice (pre); (A, B, and C) PBS, (D, E, and F) rMOMP, (G, H, and I) IM-p, and (J, K, and L) SC. Immunized-challenged mice (post); (M, N, and O) PBS, (P, Q, and R) rMOMP, (S, T, and U) IM-p, and (V, W, and X) SC groups. (C, F, I, L, O, R, U, and X) Dotted red box; CD4 memory (CD44+ CD62L+) T-cells % population, Dotted green box; effector (CD44+ CD62L) T-cells % population.
Figure 5.
Figure 5.
Chlamydia-specific CD4+ T-cells proliferation and memory and effector phenotypes in immunized and immunized-challenged mice. Groups of mice were immunized and challenged, as described in Fig. 1 legend. Immunomagnetic purified splenic T-cells (1 × 106) from immunized (pre) and immunized-challenged mice (post) were cocultured with mitomycin-C treated APCs (1 × 106) and stimulated with rMOMP (5 µg/ml) for 120 h at 37°C in a 5% CO2-humidified atmosphere. Cocultures were centrifuged, and cells were stained with fluorochrome-labeled specific antibodies for CD3, CD4, CD44, and CD62 L surface markers. Cells were acquired on a flow cytometer and analyzed by gating on CD3+ T-cells with secondary gating on CFSE+CD3+CD4+ T-cells for proliferating memory (CD44+ CD62L+) and effector (CD44+ CD62L) T-cells phenotypes. Immunized mice (pre); (A, B, and C) PBS, (D, E, and F) rMOMP, (G, H, and I) IM-p, and (J, K, and L) SC. Immunized-challenged mice (post); (M, N, and O) PBS, (P, Q, and R) rMOMP, (S, T, and U) IM-p, and (V, W, and X) SC groups. (C, F, I, L, O, R, U, and X) Dotted red box; CD4 memory (CD44+ CD62L+) T-cells % population, Dotted green box; effector (CD44+ CD62L) T-cells % population.
Figure 6.
Figure 6.
Production of systemic rMOMP-specific antibodies after immunization (pre) and challenge (post). Groups of mice were immunized and challenged, as described in the legend of Fig. 1. Sera collected from groups of immunized (pre), and immunized-challenged (post) mice were pooled per group and used to quantify rMOMP-specific antibody isotypes by ELISA. Immunized mice (pre); (A) IgG, (C) IgG2a, (E) IgG2b, and (G) IgG1, and immunized-challenged mice (post); (B) IgG, (D) IgG2a, (F) IgG2b, and (H) IgG1. Sera were diluted at a 2-fold serial dilution to determine the endpoint antibody isotype titers. Each data point represents the mean ± SD of triplicate samples.
Figure 7.
Figure 7.
Production of mucosal rMOMP-specific antibodies after immunization (pre) and challenge (post). Groups of mice were immunized and challenged, as described in Fig. 1 legend. Vaginal washes collected from groups of immunized (pre) and immunized-challenged (post) mice were pooled per group and used to quantify rMOMP-specific antibody isotypes by ELISAs. Immunized mice (pre); (A) IgG, (C) IgG2a, (E) IgG2b, (G) IgG1, and (I) IgA, and immunized-challenged mice (post) groups; (B) IgG, (D) IgG2a, (F) IgG2b, (H) IgG1, and (J) IgA. Mucosal washes were diluted at a 2-fold serial dilution to determine the antibody isotype endpoint titers. Each data point represents the mean ± SD of triplicate samples.
Figure 8.
Figure 8.
Serum and mucosal wash Th1/Th2 antibody ratios after immunization (pre) and challenge (post). Groups of mice were immunized and challenged, as described in Fig. 1 legend. Sera collected from groups of immunized (pre), and immunized-challenged (post) mice were pooled per group and used to quantify rMOMP-specific antibody isotypes by ELISA. Serum and mucosal antibodies endpoint titers were used for calculating the Th1/Th2 ratios; (A) and (B) serum, (C) and (D) mucosal wash.
Figure 9.
Figure 9.
Antigen-specific serum IgG2a, IgG2b, and IgG1 avidity antibodies. Groups of mice were immunized and challenged, as described in the legend of Fig. 1. Avidity-ELISAs were conducted using pooled sera from immunized (pre) and immunized-challenged (post) mice to determine the avidity index (%) for rMOMP-specific (pre) (A) IgG2a, (C) IgG2b, and (E) IgG1 antibodies and post (B) IgG2a, (D) IgG2b, and (F) IgG1 antibodies. Each data point represents the mean ± SD of triplicate samples.
Figure 10.
Figure 10.
PLGA-rMOMP nanovaccine-induced serum neutralizing antibodies. Groups of mice were immunized and challenged as shown in the legend of Fig. 1. Pooled sera from immunized (pre) and immunized-challenged (post) mice were collected to determine their neutralization of EBs in vitro. McCoy cells were infected with sera-pretreated EBs and incubated for 30 h. Cells were fixed, stained, and observed under immunofluorescent microscope to count IFUs from three fields of one well. (A) Cm neutralization results are shown as IFU/ml. Each symbol represents mean ± SD of IFU counts from triplicate wells. The horizontal red line represents mean IFU/ml from each group. (B) The % neutralization (mean ± SEM) of Cm EB. Statistical analyses were performed using two-way ANOVA followed by Tukey’s multiple comparisons and significant differences were considered at **P < .01 and ***P < .0001.

Similar articles

Cited by

References

    1. Andrew DW, Cochrane M, Schripsema JH et al. The duration of Chlamydia muridarum genital tract infection and associated chronic pathological changes are reduced in IL-17 knockout mice but protection is not increased further by immunization. PLoS ONE. 2013;8:e76664. - PMC - PubMed
    1. Armitage CW, O'meara CP, Harvie MCG et al. Evaluation of intra- and extra-epithelial secretory IgA in chlamydial infections. Immunology. 2014;143:520–30. - PMC - PubMed
    1. Badamchi-Zadeh A, Mckay PF, Korber BT et al. A multi-component prime-boost vaccination regimen with a consensus MOMP antigen enhances Chlamydia trachomatis clearance. Front Immunol. 2016;7:162. - PMC - PubMed
    1. Bakshi RK, Gupta K, Jordan SJ et al. An adaptive Chlamydia trachomatis-specific IFN-gamma-producing CD4(+) T cell response is associated with protection against Chlamydia reinfection in women. Front Immunol. 2018;9:1981. - PMC - PubMed
    1. Belay T, Eko FO, Ananaba GA et al. Chemokine and chemokine receptor dynamics during genital chlamydial infection. Infect Immun. 2002;70:844–50. - PMC - PubMed

MeSH terms