. 2024 Jun 11;15(1):4862.
doi: 10.1038/s41467-024-48841-w.

Secretome profiling reveals acute changes in oxidative stress, brain homeostasis, and coagulation following short-duration spaceflight

Affiliations

Secretome profiling reveals acute changes in oxidative stress, brain homeostasis, and coagulation following short-duration spaceflight

Nadia Houerbi et al. Nat Commun. .

Abstract

As spaceflight becomes more common with commercial crews, blood-based measures of crew health can guide both astronaut biomedicine and countermeasures. By profiling plasma proteins, metabolites, and extracellular vesicles/particles (EVPs) from the SpaceX Inspiration4 crew, we generated "spaceflight secretome profiles," which showed significant differences in coagulation, oxidative stress, and brain-enriched proteins. While >93% of differentially abundant proteins (DAPs) in vesicles and metabolites recovered within six months, the majority (73%) of plasma DAPs were still perturbed post-flight. Moreover, these proteomic alterations correlated better with peripheral blood mononuclear cells than whole blood, suggesting that immune cells contribute more DAPs than erythrocytes. Finally, to discern possible mechanisms leading to brain-enriched protein detection and blood-brain barrier (BBB) disruption, we examined protein changes in dissected brains of spaceflight mice, which showed increases in PECAM-1, a marker of BBB integrity. These data highlight how even short-duration spaceflight can disrupt human and murine physiology and identify spaceflight biomarkers that can guide countermeasure development.


Conflict of interest statement

C.E.M. is a co-Founder of Cosmica Biosciences. I.M. receives research grant support/funding from Atossa Inc. A.S.G., L.W., P.T., Q.Y., J.C., R.B., A.S., and D.H. are employees of and have a financial interest in Seer Inc. and Prognomiq Inc. Jan Krumsiek holds equity in Chymia LLC and IP in PsyProtix and is cofounder of iollo. The remaining authors declare no competing interests.

Figures
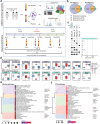
Fig. 1
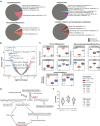
Fig. 1. Changes in the proteomic profile of plasma and EVPs after 3-day spaceflight.
a Overview of study design, sample collection, and processing of plasma and EVP proteomics. b Venn diagram of proteins measured in plasma and EVP, before (left) and after (right) filtering, based on the coefficient of variance, low abundance, and number of not assessed (NAs). c Upset plot showing the overlap of differentially abundant proteins (adjusted p-value < 0.05, |logFC | >1) across the different comparisons performed in plasma and EVPs. Differential abundance analysis was performed with limma with the following model ~astronaut+flightSatus and p-values have been adjusted to control the false discovery rate d Boxplots of the scaled abundance of the 9 proteins differentially abundant in both plasma and EVPs. Where available, data represents n = 4 astronauts averaged at the indicated condition (preflight and long-term postflight). Plasma data is the average of two technical replicates, EVP data represents one technical replicate per astronaut and timepoint. Boxes show the quartiles of the dataset while the whiskers extend to show the rest of the distribution except for outliers. e Gene Ontology enrichment was performed using clusterProfiler::enrichGO() on differentially abundant proteins in plasma (adjusted p-value < 0.05, |logFC | >1) at R + 1 vs. Preflight. Biological processes (BP) were selected, and treeplot was used to organize significant pathways (adjusted p-value < 0.05) into biologically relevant clusters. f Gene Ontology enrichment was performed using clusterProfiler::enrichGO() on differentially abundant proteins in the EVPs (adjusted p-value < 0.05, |logFC | >1) at R + 1 vs. Preflight. Biological processes were selected, and treeplot was used to organize and cluster the significant pathways (adjusted p-value < 0.05) into biologically relevant clusters. Source data are provided as a Source Data file.
Fig. 2
Fig. 2. Changes in plasma metabolites after 3-day spaceflight.
a Pie charts showing pathway annotations of differentially abundant metabolites (adjusted p-value < 0.05, |logFC | >1) at R + 1 vs. Preflight. Gray portions of the pie chart represent measured but insignificant metabolites in the specified category, while colored portions are labeled by metabolite pathway name and frequency. b Volcano plot of metabolites based on differential abundance (logFC>1 in red, logFC < −1 in blue) at R + 1 vs. Preflight. Labeled points are differentially abundant metabolites with connections to spaceflight-related anemia, inflammation, and oxidative stress. c Box plots of the scaled abundance of select differentially abundant metabolites associated with purine metabolism, glycerophospholipid metabolism, and anemia and hemolysis. Data represents n = 4 astronauts averaged at the indicated condition with one technical replicate per astronaut at each timepoint. Boxes show the quartiles of the dataset while the whiskers extend to show the rest of the distribution except for outliers. d Diagram of the sphingomyelin cycle, which is enriched in spaceflight-affected metabolites. Annotation boxes represent metabolites significantly changed at R + 1 vs. Preflight, with increased abundance indicated in red, decreased abundance in blue, and no significant change in gray (only boxed metabolites were measured). The dashed boxes indicate significant changes in some, but not all, chain lengths of the indicated lipid species. e Violin plots showing the results of Thiobarbituric acid reactive substances (TBARS) assay performed on astronaut plasma. Repeated measures one-way ANOVA was performed to assess significance. Source data are provided as a Source Data file.
Fig. 3
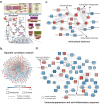
Fig. 3. Integrated proteomic and metabolomic analyses reveal a common signature of antioxidant defense and immune dysfunction.
a The top (plasma) indicates significantly differentially abundant proteins in the plasma and EVPs from immediate or long-term post-flight or both immediate and long-term post-flight groups compared to ground controls. Antioxidant proteins are white-colored, and proteins involved in mitochondrial metabolism are orange. The purple edges represent upregulated proteins, and the green edges represent downregulated proteins. The lower panel (inside the cell) shows the antioxidant and mitochondrial metabolism protein functions within the cell. b Overview of the bipartite correlation network with proteins and metabolites as nodes. Ellipses depict proteins, and metabolites are represented by square nodes. The edges indicate significant correlations between the nodes. A solid line indicates a positive correlation, while a dotted line indicates a negative correlation. Nodes are colored based on log2-fold changes immediately post-flight compared to pre-flight time points. c The antioxidant defense subnetwork is enriched in peroxidases, antioxidant enzymes, and antioxidant molecules, indicating activation of extensive antioxidant response. d The immunosuppression and anti-inflammatory response subnetwork is enriched in anti-inflammatory molecules and protein markers of immune cells that lower post-flight, indicating a deregulated immune response. Source data are provided as a Source Data file.
Fig. 4
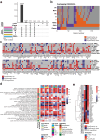
Fig. 4. Immune cells contribute to the observed secretome changes after spaceflight.
a Upset plot of identified genes in PBMC and identified proteins in EVPs and plasma. b Overlap of immune cell DEGs, plasma DAPs, and EVP daps. Up-regulated genes/proteins (Immune cells: p-value < 0.05, secretome: adjusted p-value < 0.05, fold change > 0) are depicted in orange. Down-regulated genes/proteins (Immune cells: p-value < 0.05, secretome: adjusted p-value < 0.05, fold change <0) are depicted in colored purple. Non-significant genes/proteins are depicted in colored gray. Wilcoxon rank sum tests were performed. c Expression of secretome DAPs in immune cells. d Fold change (R + 1/pre-flight) of the selected secretome-enriched pathways normalized score in immune cells. Among the secretome-enriched pathways, immune function, oxidative stress, antioxidant, lipid metabolism, coagulation, and platelet activation pathways were selected. e MACSPlex analysis of immune marker expression in EVPs. Source data are provided as a Source Data file.
Fig. 5
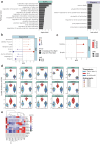
Fig. 5. Brain-related proteins are enriched in the secretome after spaceflight.
a Overrepresentation analysis of significantly enriched pathways (adjusted p-value < 0.05) related to brain function and injury of EVPs and plasma DAPs at R + 1 (adjusted p-value < 0.05, Left: EVP, Right: plasma). b Gene set enrichment analysis (GSEA) of EVP DAPs immediately post-flight and long-term post-flight based on the tissue-enriched database derived from the Human Protein Atlas database. GSEA was performed with fgsea::fgsea() using minSize=5 and maxSize = 500 as parameters. Significant results (adjusted p-value < 0.1) are shown. c Gene set enrichment analysis of cfRNA measured immediately post-flight JAXA CFE mission based on the tissue-enriched database derived from the Human Protein Atlas database. GSEA was performed with fgsea::fgsea() using minSize = 5 and maxSize = 500 as parameters. Significant results (adjusted p-value < 0.1) are shown. d Abundance of brain-enriched proteins in EVPs. Data is from n = 4 astronauts, representing one technical replicate per astronaut and timepoint averaged at the indicated condition (preflight, and long-term postflight). Boxes show the quartiles of the dataset while the whiskers extend to show the rest of the distribution except for “outliers”. Source data are provided as a Source Data file. e Abundance of brain-enriched proteins in EVPs isolated from naive, ground control mice.
Fig. 6
Fig. 6. Blood Brain Barrier integrity markers in spaceflight.
a Abundance of blood-brain barrier (BBB) integrity peptides in plasma of i4 astronauts shown as violin plots. Data is from n = 4 astronauts. Each blood proteomic measurement was performed in two technical replicates per astronaut and timepoint. Displayed data represents the average of the technical replicates which were further averaged at the indicated condition (preflight, and long-term postflight). Boxes show the quartiles of the dataset while the whiskers extend to show the rest of the distribution except for “outliers”. b Representative images of hippocampal PECAM-1 in the flight (FLT) and ground control (GC) mice (n = 5). PECAM-1 positive cells were identified based on red fluorescence, while endothelium was stained with lectin (green). The nuclei were counterstained with DAPI (blue). In the control hippocampal region, few positive cells were found. In the hippocampal region of FLT mice, enhanced PECAM expression could be detected. There was a significant difference between FLT and GC groups with p < 0.05 (n = 5 replicates, two-sided Student’s paired t-Test, p = 0.023).Source data are provided as a Source Data file. Scale bar = 50 mm.

Similar articles

Cited by

  • Molecular and physiological changes in the SpaceX Inspiration4 civilian crew.
    Jones CW, Overbey EG, Lacombe J, Ecker AJ, Meydan C, Ryon K, Tierney B, Damle N, MacKay M, Afshin EE, Foox J, Park J, Nelson TM, Suhail Mohamad M, Byhaqui SGA, Aslam B, Tali UA, Nisa L, Menon PV, Patel CO, Khan SA, Ebert DJ, Everson A, Schubert MC, Ali NN, Sarma MS, Kim J, Houerbi N, Grigorev K, Garcia Medina JS, Summers AJ, Gu J, Altin JA, Fattahi A, Hirzallah MI, Wu JH, Stahn AC, Beheshti A, Klotz R, Ortiz V, Yu M, Patras L, Matei I, Lyden D, Melnick A, Banerjee N, Mullane S, Kleinman AS, Loesche M, Menon AS, Donoviel DB, Urquieta E, Mateus J, Sargsyan AE, Shelhamer M, Zenhausern F, Bershad EM, Basner M, Mason CE. Jones CW, et al. Nature. 2024 Aug;632(8027):1155-1164. doi: 10.1038/s41586-024-07648-x. Epub 2024 Jun 11. Nature. 2024. PMID: 38862026 Free PMC article.
  • Telomeric RNA (TERRA) increases in response to spaceflight and high-altitude climbing.
    Al-Turki TM, Maranon DG, Nelson CB, Lewis AM, Luxton JJ, Taylor LE, Altina N, Wu F, Du H, Kim J, Damle N, Overbey E, Meydan C, Grigorev K, Winer DA, Furman D, Mason CE, Bailey SM. Al-Turki TM, et al. Commun Biol. 2024 Jun 11;7(1):698. doi: 10.1038/s42003-024-06014-x. Commun Biol. 2024. PMID: 38862827 Free PMC article.
  • Single-cell multi-ome and immune profiles of the Inspiration4 crew reveal conserved, cell-type, and sex-specific responses to spaceflight.
    Kim J, Tierney BT, Overbey EG, Dantas E, Fuentealba M, Park J, Narayanan SA, Wu F, Najjar D, Chin CR, Meydan C, Loy C, Mathyk B, Klotz R, Ortiz V, Nguyen K, Ryon KA, Damle N, Houerbi N, Patras LI, Schanzer N, Hutchinson GA, Foox J, Bhattacharya C, Mackay M, Afshin EE, Hirschberg JW, Kleinman AS, Schmidt JC, Schmidt CM, Schmidt MA, Beheshti A, Matei I, Lyden D, Mullane S, Asadi A, Lenz JS, Mzava O, Yu M, Ganesan S, De Vlaminck I, Melnick AM, Barisic D, Winer DA, Zwart SR, Crucian BE, Smith SM, Mateus J, Furman D, Mason CE. Kim J, et al. Nat Commun. 2024 Jun 11;15(1):4954. doi: 10.1038/s41467-024-49211-2. Nat Commun. 2024. PMID: 38862516 Free PMC article.
  • Protective alleles and precision healthcare in crewed spaceflight.
    Rutter LA, MacKay MJ, Cope H, Szewczyk NJ, Kim J, Overbey E, Tierney BT, Muratani M, Lamm B, Bezdan D, Paul AM, Schmidt MA, Church GM, Giacomello S, Mason CE. Rutter LA, et al. Nat Commun. 2024 Jul 22;15(1):6158. doi: 10.1038/s41467-024-49423-6. Nat Commun. 2024. PMID: 39039045 Free PMC article. Review.
  • Direct RNA sequencing of astronaut blood reveals spaceflight-associated m6A increases and hematopoietic transcriptional responses.
    Grigorev K, Nelson TM, Overbey EG, Houerbi N, Kim J, Najjar D, Damle N, Afshin EE, Ryon KA, Thierry-Mieg J, Thierry-Mieg D, Melnick AM, Mateus J, Mason CE. Grigorev K, et al. Nat Commun. 2024 Jun 11;15(1):4950. doi: 10.1038/s41467-024-48929-3. Nat Commun. 2024. PMID: 38862496 Free PMC article.

References

    1. Afshinnekoo E, et al. Fundamental Biological Features of Spaceflight: Advancing the Field to Enable Deep-Space Exploration. Cell. 2020;183:1162–1184. doi: 10.1016/j.cell.2020.10.050. - DOI - PMC - PubMed
    1. Kliuchnikova AA, et al. Blood Plasma Proteome: A Meta-Analysis of the Results of Protein Quantification in Human Blood by Targeted Mass Spectrometry. Int. J. Mol. Sci. 2023;24:769. doi: 10.3390/ijms24010769. - DOI - PMC - PubMed
    1. Brzhozovskiy AG, et al. The Effects of Spaceflight Factors on the Human Plasma Proteome, Including Both Real Space Missions and Ground-Based Experiments. Int. J. Mol. Sci. 2019;20:3194. doi: 10.3390/ijms20133194. - DOI - PMC - PubMed
    1. Larina IM, et al. Protein expression changes caused by spaceflight as measured for 18 Russian cosmonauts. Sci. Rep. 2017;7:8142. doi: 10.1038/s41598-017-08432-w. - DOI - PMC - PubMed
    1. Martin D, Makedonas G, Crucian B, Peanlikhit T, Rithidech K. The use of the multidimensional protein identification technology (MudPIT) to analyze plasma proteome of astronauts collected before, during, and after spaceflights. Acta. Astronaut. 2022;193:9–19. doi: 10.1016/j.actaastro.2021.12.054. - DOI

MeSH terms