. 2024 Jun 11;15(1):4382.
doi: 10.1038/s41467-024-48576-8.

Transcranial focused ultrasound to V5 enhances human visual motion brain-computer interface by modulating feature-based attention

Affiliations

Transcranial focused ultrasound to V5 enhances human visual motion brain-computer interface by modulating feature-based attention

Joshua Kosnoff et al. Nat Commun. .

Abstract

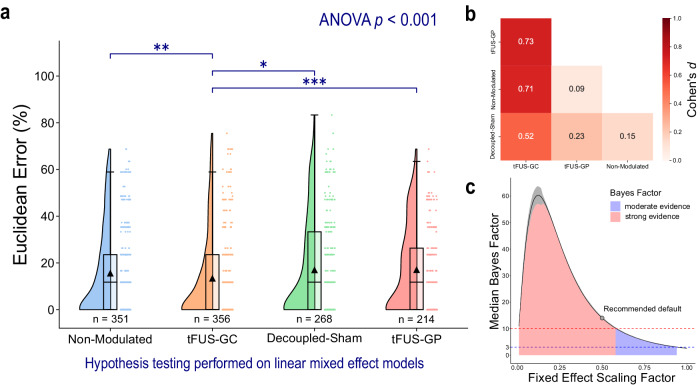
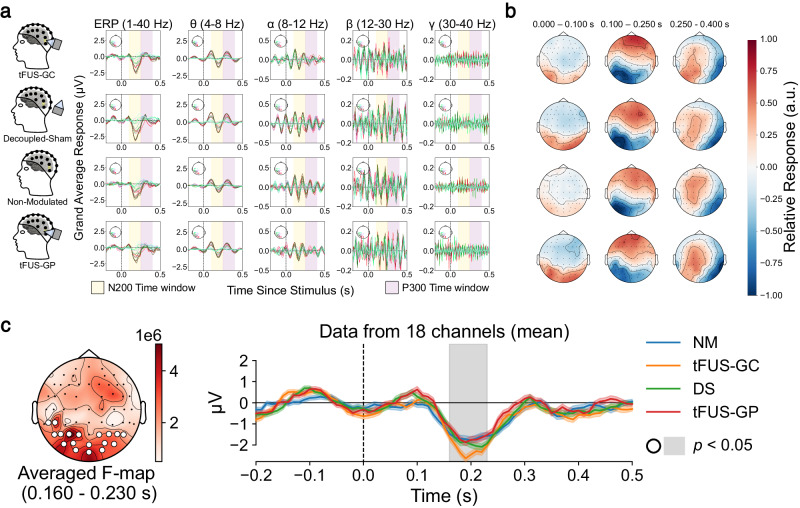
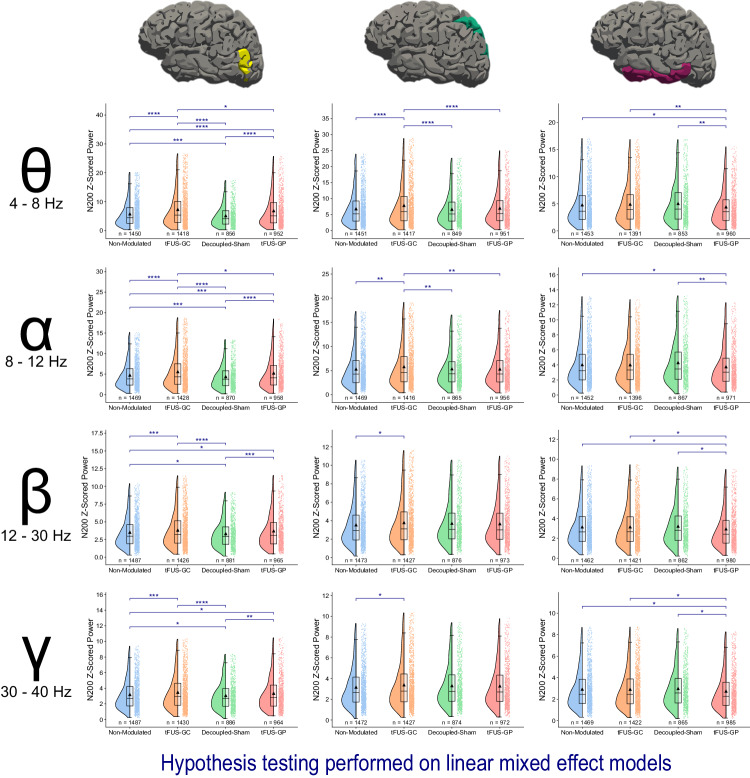
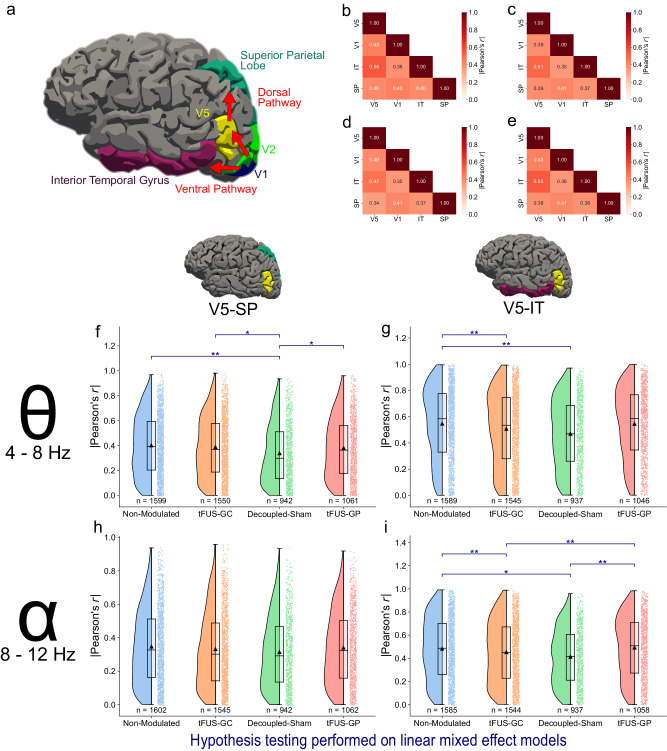
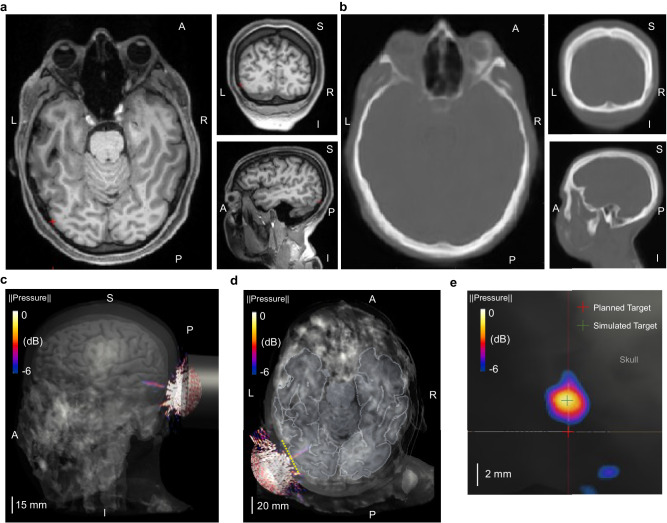
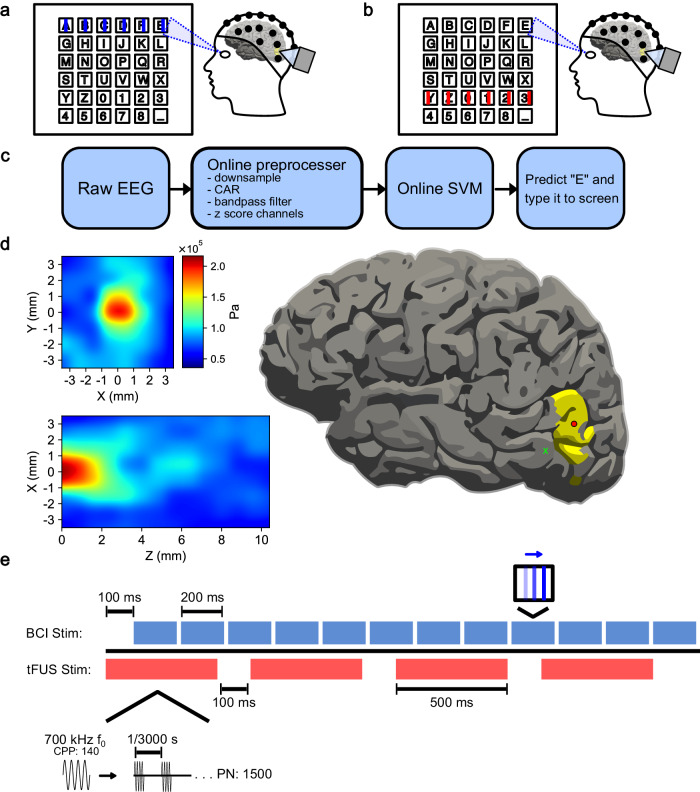
A brain-computer interface (BCI) enables users to control devices with their minds. Despite advancements, non-invasive BCIs still exhibit high error rates, prompting investigation into the potential reduction through concurrent targeted neuromodulation. Transcranial focused ultrasound (tFUS) is an emerging non-invasive neuromodulation technology with high spatiotemporal precision. This study examines whether tFUS neuromodulation can improve BCI outcomes, and explores the underlying mechanism of action using high-density electroencephalography (EEG) source imaging (ESI). As a result, V5-targeted tFUS significantly reduced the error in a BCI speller task. Source analyses revealed a significantly increase in theta and alpha activities in the tFUS condition at both V5 and downstream in the dorsal visual processing pathway. Correlation analysis indicated that the connection within the dorsal processing pathway was preserved during tFUS stimulation, while the ventral connection was weakened. These findings suggest that V5-targeted tFUS enhances feature-based attention to visual motion.


Conflict of interest statement

B.H. and K.Y. are co-inventors of a pending US patent application (Applicant: Carnegie Mellon University; Inventors: Bin He and Kai Yu; Application No: 18/553,901; Status: Pending; Specific aspect: tFUS and electrophysiological source imaging). J.K. and C.L. have no competing interests to declare.

Figures

Fig. 1
Fig. 1. tFUS to V5 significantly improves mVEP BCI speller outcomes.
Data were fit to a linear mixed-effect model to account for repeated measures across subjects and additional fixed effects from learning and fatigue (Eq. 1). a A raincloud plot of the BCI Euclidean error. The left portion of each subplot is a violin plot highlighting the distribution of the data. A box plot is at the center, marking the data median (center line), 1st and 3rd quartiles (whiskers = 1.5 * quartile ranges), and means (black triangle). The raw datapoints are presented to the right. Data are analyzed with the results of the linear mixed-effect models. A one-tailed ANOVA and a one-tailed z-test with Bonferroni correction were performed on the model’s fit for each condition. The ANOVA test indicated significant differences (p < 0.001) in the mean Euclidean errors for each condition. tFUS sonication to the functional area located in the geometric center of V5 (“tFUS-GC”; N trials = 356 trials; mean error = 13.3 ± 18.4%; median error = 0.0%) led to a significantly lower Euclidean error for the mVEP BCI speller compared to non-modulated (N trials = 351; mean error = 15.5 ± 18.7%; median error = 11.8%), decoupled-sham (N trials = 268; mean error = 16.9 ± 20.8%; median error = 11.8%), and ultrasound steered to the geometric periphery of V5 (“tFUS-GP”; N trials = 214; mean error = 17.0 ± 18.2%; median error = 11.8%) conditions. No significant differences (significance level = 0.05) were found between the other three conditions. One-tailed z-test (with Bonferroni p adjustment) key: *padjusted < 0.05, **padjusted < 0.01, ***padjusted < 0.001. b The effect size was quantified using Cohen’s d (Eq. 9). tFUS-GC had moderate (d ≥ 0.5) effects on BCI outcomes compared to all three control conditions. c The effect of experimental conditions was also quantified using Bayes Factors (BF). To provide a more robust view of the effect, the median ± 95% confidence interval (over 1000 iterations) BF was plotted over a range of fixed effect scaling factors, which provides a high degree of confidence in that experimental condition having a moderate (BF > 3) to strong (BF > 10) effect on the Euclidean error. For the recommended default value (scaling factor = 0.5), the BF was calculated to have a median of 14.0 and a 95% confidence interval from 13.8 to 14.4, which constitutes a strong effect. Source data are provided within the Source Data file.
Fig. 2
Fig. 2. Significant differences are found between conditions in the EEG sensor domain.
a Averaged left posterior electrode responses for 1 to 40 Hz (graph column 1), theta frequencies (graph column 2), alpha frequencies (graph column 3), beta frequencies (graph column 4), and gamma frequencies (graph column 5) for tFUS-GC (top), decoupled-sham (second row), non-modulated condition (third row), and tFUS-GP (bottom). Yellow and purple highlight the approximate N200 and P300 waveform responses within the 100 to 250 ms and 250 to 400 ms windows, respectively. b Topographic maps of the trial’s averaged activity for 0 to 100 ms (left), 100 to 250 ms (middle) and 250 to 400 ms (right) post stimulus filtered between 1 to 40 Hz for tFUS-GC (top), decoupled-sham (“DS”; second row), non-modulated (“NM”; third row), and tFUS-GP (bottom) conditions. The topo colormap is scaled to the relative max/min response for each. c A significant spatiotemporal cluster (p < 0.05) between the 1 to 40 Hz filtered conditions using MNE Python’s non-parametric spatiotemporal cluster test with 1000 permutations (test: one-tailed repeated measures ANOVA) when comparing all four conditions. (left) The F-statistics of a significant spatial cluster denoted by white circles over the electrodes. (right) The mean activity across channels and trials of the four trial conditions (±1 standard deviation). Gray shaded regions indicate a significant (p < 0.05) temporal cluster corresponding to the spatial cluster.
Fig. 3
Fig. 3. tFUS-GC N200 modulation is conveyed through the dorsal pathway in theta and alpha frequencies.
Raincloud plots of the N200 power are presented at various frequencies and locations. The left portion of each subplot is a violin plot highlighting the distribution of the data. A box plot is at the center, marking the data median (center line), 1st and 3rd quartiles (whiskers = 1.5 * quartile ranges), and means (black triangle). The raw datapoints are presented to the right. Data are analyzed with the results of the linear mixed-effect models. EEG source imaging of V5 reveals a significant amplification of the N200 theta and alpha power for tFUS-GC modulation compared to decoupled-sham, non-modulated, and tFUS-GP control conditions. There is also significant damping of the decoupled-sham compared to the non-modulated condition. In beta and gamma frequencies, tFUS-GC exhibits amplified power compared to the non-modulated and decoupled-sham conditions, but not tFUS-GP. EEG source imaging of the superior parietal lobe shows significant N200 theta and alpha amplification in the tFUS-GC condition compared with the non-modulated, decoupled-sham, and tFUS-GP conditions. In beta and gamma frequency ranges, this amplification is only observed compared to the non-modulated. tFUS-GC is not significantly amplified compared to any of the control conditions in IT across any of the frequency ranges. One-tailed z-test key false-discovery rate adjustment: *padjusted < 0.05, **padjusted < 0.01, ***padjusted < 0.001, **** padjusted < 0.0001. Source data are provided within the Source Data file.
Fig. 4
Fig. 4. tFUS-GC’s effects are conveyed through the theta frequency of the dorsal pathway.
a The canonical dorsal and ventral visual processing pathways with their FreeSurfer associated labels. be Grand-average |Pearson’s r| values for theta frequency absolute correlation for b non-modulated, c tFUS-GC, d decoupled-sham, and e tFUS-GP of the mVEP BCI epochs. fi Raincloud plots of the correlation coefficient in theta-alpha frequencies for dorsal and ventral pathways. The left portion of each subplot is a violin plot highlighting the distribution of the data. A box plot is at the center, marking the data median (center line), 1st and 3rd quartiles (whiskers = 1.5 * quartile ranges) and means (black triangle). The raw datapoints are presented to the right. Data are analyzed with the results of the linear mixed-effect models. f The dorsal pathway (V5-SP) theta frequency band correlation is significantly reduced for the decoupled-sham condition compared to the others. g The ventral pathway (V5-IT) theta frequency band is significantly decorrelated for both the tFUS-GC and decoupled-sham compared to the non-modulated condition. h There is no significant difference across alpha frequency correlations for any of the conditions in the dorsal pathway. i tFUS-GC and the decoupled-sham alpha frequency bands are significantly decorrelated compared to the non-modulated and tFUS-GP conditions, but not from each other. One-tailed z-test with false-discovery rate correction key: *padjusted < 0.05, **padjusted < 0.01. Source data are provided within the Source Data file.
Fig. 5
Fig. 5. Computer simulations of tFUS generated by the 128-element random array ultrasound transducer in a representative individual (Subject #5).
a The subject-specific T1-weighted structural magnetic resonance images in horizontal, coronal and sagittal planes, with the red cross indicating the geometrical center of the V5 area. b Pseudo-CT images generated from the MRI in the same imaging planes as illustrated in a. c, d The transcranial pressure field and focused ultrasound beam (−6dB focal pressure volume) co-registered with the subject skull and brain models. e A lateral view of the transcranial ultrasound focus (−6dB focal pressure volume) on the surface of V5 along the yellow dashed line in d. The center of planned target used for optical-based brain navigation is depicted using a red cross, while the center of simulated ultrasound target is at the location marked with a green cross. The deflection of ultrasound focal spot is quantified with the spatial distance between these two crosses, which is measured as 2.84 mm for this subject. Extensive subject-wise characterizations of transcranial ultrasound focus are depicted and listed in Supplemental Fig. S3 and Supplemental Table S1.
Fig. 6
Fig. 6. Experimental paradigm for mVEP speller.
a Example of “on-target” visual stimuli. The lines flash across the row or column of the letter the subject is looking at. b Example of “off-target” visual stimuli. The lines flash on a row or column not associated with the letter of interest. c The online BCI decoder pipeline. The raw EEG is down-sampled to 100 Hz, bandpass filtered between 1 and 20 Hz, common average referenced (CAR), and z-scored across channels. The processed data is fed to a Support Vector Machine (SVM) classifier, predicting the letter of intent based on neural activity for on and off-target stimuli. d (left) The 128-element 700 kHz fundamental frequency (f0) tFUS pressure wave profile measured through a skull fragment in a water tank. (right) A visualization of the profiled 2 mm focal point scaled to a 93 mm brain and centered on V5 (red circle), as well as at an example tFUS-GP area 1.41 cm away (green x). e A typical trial epoch consists of 12 row/column 200 ms line flashes and four 500-ms tFUS sonications. The first sonication begins 100 ms prior to the first BCI stimulation. The ultrasound parameters used for this experiment were as follows: a customized 128-element 700 kHz f0, pulsed for 140 cycles (cycles-per-pulse, CPP). Each sonication consists of 1500 pulses (pulse number, PN), repeated at a pulse-repetition frequency (PRF) of 3 kHz.

Update of

Similar articles

Cited by

References

    1. Harvey EN. The effect of high frequency sound waves on heart muscle and other irritable tissues. Am. J. Physiol. Leg. Content. 1929;91:284–290. doi: 10.1152/ajplegacy.1929.91.1.284. - DOI
    1. Fry FJ, Ades HW, Fry WJ. Production of reversible changes in the central nervous system by ultrasound. Science. 1958;127:83–84. doi: 10.1126/science.127.3289.83. - DOI - PubMed
    1. Hameroff S, et al. Transcranial ultrasound (TUS) effects on mental states: a pilot study. Brain Stimul. 2013;6:409–415. doi: 10.1016/j.brs.2012.05.002. - DOI - PubMed
    1. Yoo S, Mittelstein DR, Hurt RC, Lacroix J, Shapiro MG. Focused ultrasound excites cortical neurons via mechanosensitive calcium accumulation and ion channel amplification. Nat. Commun. 2022;13:493. doi: 10.1038/s41467-022-28040-1. - DOI - PMC - PubMed
    1. Lee J, et al. A MEMS ultrasound stimulation system for modulation of neural circuits with high spatial resolution in vitro. Microsyst. Nanoeng. 2019;5:1–11. doi: 10.1038/s41378-019-0070-5. - DOI - PMC - PubMed