. 2024 Jun 11;10(1):278.
doi: 10.1038/s41420-024-02040-0.

CHK1 inhibitor induced PARylation by targeting PARG causes excessive replication and metabolic stress and overcomes chemoresistance in ovarian cancer

Affiliations

CHK1 inhibitor induced PARylation by targeting PARG causes excessive replication and metabolic stress and overcomes chemoresistance in ovarian cancer

Ganesh Acharya et al. Cell Death Discov. .

Abstract

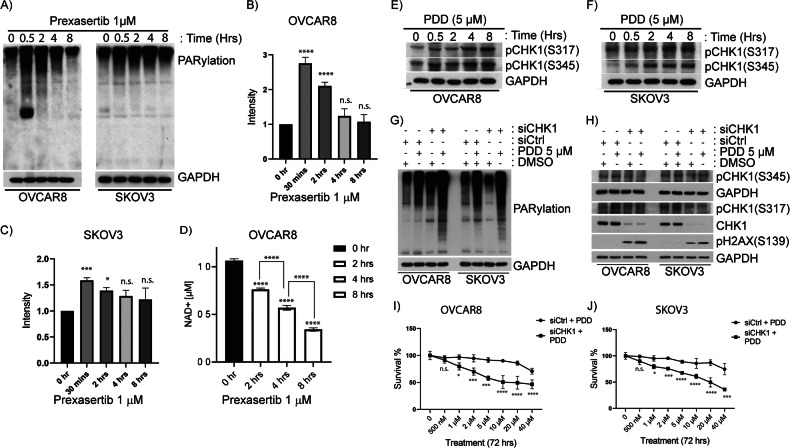
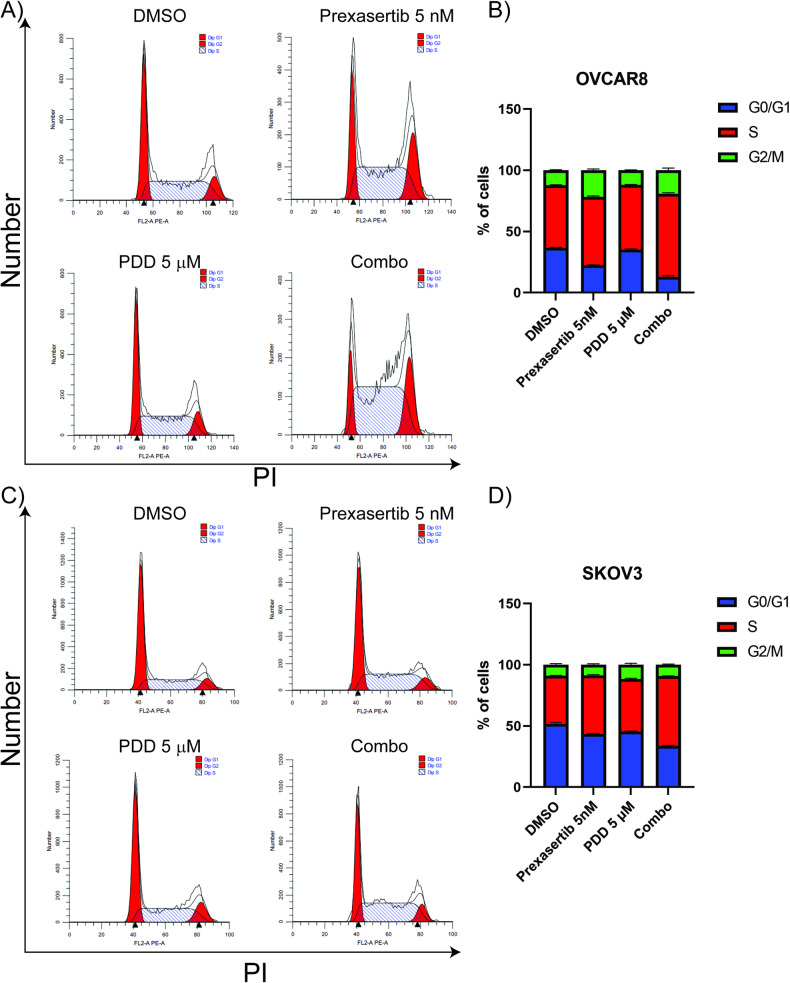
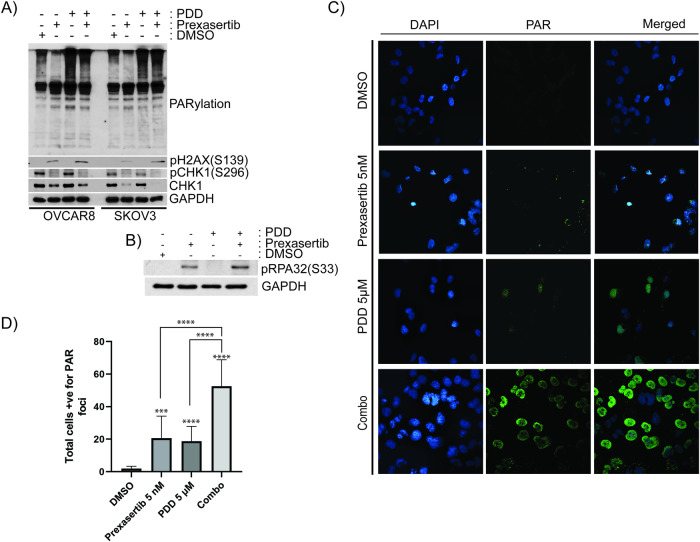
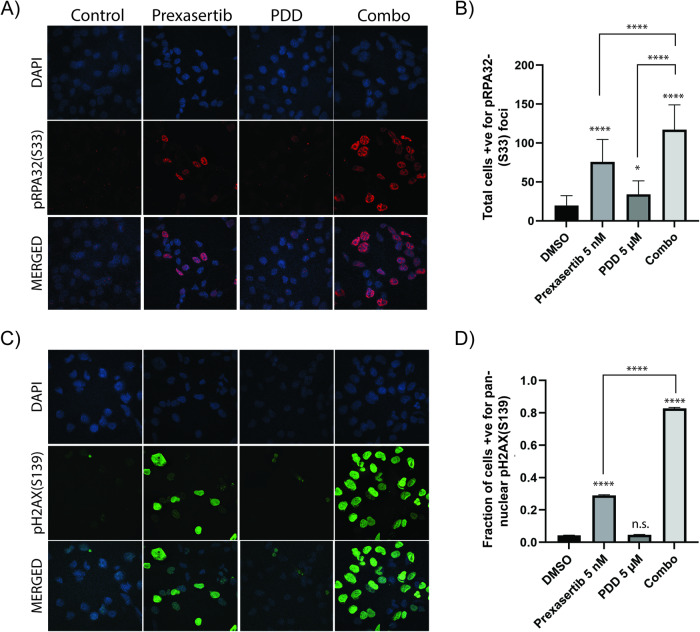
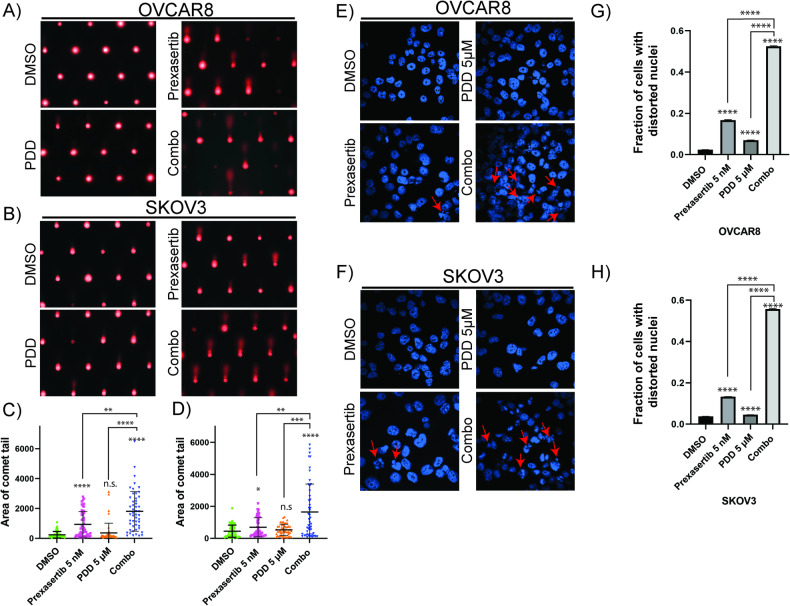
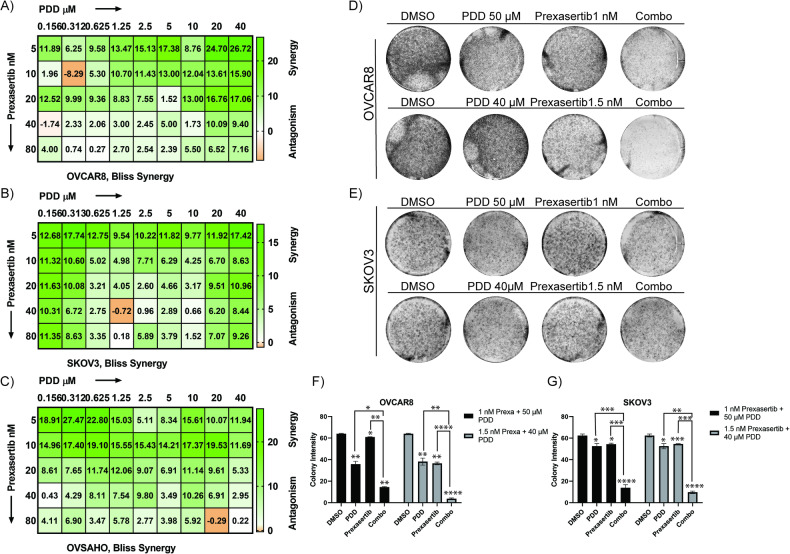
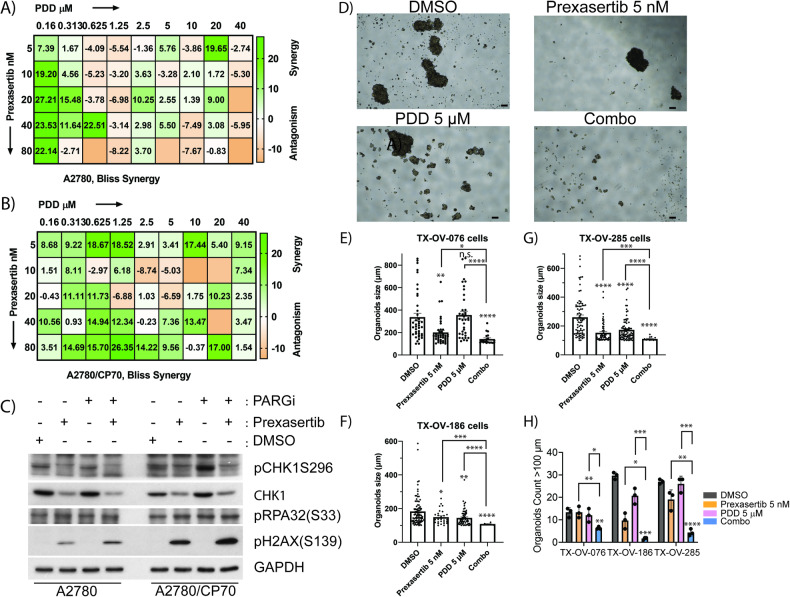
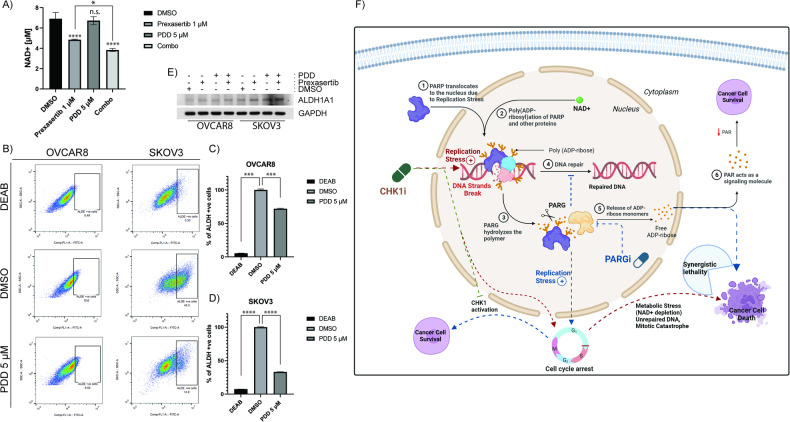
Chemoresistance contributes to the majority of deaths in women with ovarian cancer (OC). Altered DNA repair and metabolic signaling is implicated in mediating therapeutic resistance. DNA damage checkpoint kinase 1 (CHK1) integrates cell cycle and DNA repair in replicating cells, and its inhibition causes replication stress, repair deficiency and cell cycle dysregulation. We observed elevated Poly-ADP-ribosylation (PAR) of proteins (PARylation) and subsequent decrease in cellular NAD+ levels in OC cells treated with the CHK1 inhibitor prexasertib, indicating activation of NAD+ dependent DNA repair enzymes poly-ADP-ribose polymerases (PARP1/2). While multiple PARP inhibitors are in clinical use in treating OC, tumor resistance to these drugs is highly imminent. We reasoned that inhibition of dePARylation by targeting Poly (ADP-ribose) glycohydrolase (PARG) would disrupt metabolic and DNA repair crosstalk to overcome chemoresistance. Although PARG inhibition (PARGi) trapped PARylation of the proteins and activated CHK1, it did not cause any significant OC cell death. However, OC cells deficient in CHK1 were hypersensitive to PARGi, suggesting a role for metabolic and DNA repair crosstalk in protection of OC cells. Correspondingly, OC cells treated with a combination of CHK1 and PARG inhibitors exhibited excessive replication stress-mediated DNA lesions, cell cycle dysregulation, and mitotic catastrophe compared to individual drugs. Interestingly, increased PARylation observed in combination treatment resulted in depletion of NAD+ levels. These decreased NAD+ levels were also paralleled with reduced aldehyde dehydrogenase (ALDH) activity, which requires NAD+ to maintain cancer stem cells. Furthermore, prexasertib and PARGi combinations exhibited synergistic cell death in OC cells, including an isogenic chemoresistant cell line and 3D organoid models of primary patient-derived OC cell lines. Collectively, our data highlight a novel crosstalk between metabolism and DNA repair involving replication stress and NAD+-dependent PARylation, and suggest a novel combination therapy of CHK1 and PARG inhibitors to overcome chemoresistance in OC.


Conflict of interest statement

The authors declare no competing interests.

Figures

Fig. 1
Fig. 1. CHK1 inhibition activates PARP and induces PARylation of proteins and replication stress-induced CHK1 phosphorylation in OC cells.
A Immunoblot analysis shows PARP1 mediated/activated PARylation of proteins induced by the treatment of CHK1 inhibitor, prexasertib at 1 µM concentration in OC cells- OVCAR8 and SKOV3 cells in time dependent manner. B, C Quantification of elevated levels of PARylated proteins induced by the treatment of 1 µM prexasertib in OVCAR8 and SKOV3 cells, respectively. ImageJ was used to quantify the intensity of the proteins. D NAD+ assay shows reduced levels of cellular NAD+ upon prexasertib treatment at 1 µM concentration in OVCAR8 cells. Immunoblot analysis depicting activation of ATR-mediated phosphorylation of CHK1 at S317 and S345 in OC cells E OVACR8 and F SKOV3 cells after treatment with 5 µM of PARG inhibitor, PDD00017273 for 24 h. G Immunoblot analysis showing downregulation of CHK1 along with 5 µM of PDD treatment for 24 h showed increased levels of PARylation of proteins and similarly, H increased levels of a DNA damage marker-pH2AX(S139) in OC cells. I, J Survival curve showing downregulation of CHK1 along with 5 µM of PDD treatment for 24 h showed decreased survival percentage of cells in OVCAR8 and SKOV3 cells, respectively. All the experiments were performed in triplicates and the bar graph denotes their standard deviation. Two-way ANOVA using Bonferroni’s multiple comparison tests were performed to analyze the statistical significance. n.s. not significant; *p < 0.05; ***p < 0.001; ****p < 0.0001.
Fig. 2
Fig. 2. PDD in combination with prexasertib causes cell cycle dysregulation in OC cells.
A, C Cell cycle profile of OC cells treated with 5 nM prexasertib, 5 µM PDD and their combination for 24 h in OVCAR8 and SKOV3 cells, respectively. B, D Histogram representation of cell cycle profile in OC cells treated with 5 nM prexasertib, 5 µM PDD and their combination for 24 h in OVCAR8 and SKOV3 cells, respectively. Error bars represent standard deviation from three independent experiments.
Fig. 3
Fig. 3. PDD traps prexasertib-induced PARylated proteins on chromatin.
A Immunoblot analysis showing PARylation of proteins, pH2AX(S139), pCHK1(S296), and CHK1 basally as well as after treatment with 5 nM prexasertib, 5 µM PDD and their combination in OC cells. B Immunoblotting showing pRPA32(S33) in SKOV3 cells treated with DMSO, 5 nM prexasertib, 5 µM PDD and their combination. C Immunofluorescence study showing PAR foci staining in SKOV3 cells treated with DMSO, 5 nM prexasertib, 5 µM PDD and their combination. D Histogram representation of PAR foci staining in SKOV3 cells treated with DMSO, 5 nM prexasertib, 5 µM PDD and their combination. 50 cells were counted for each group for an experiment, and the data presented are an average of 3 different experiments. All the experiments were repeated three times, and the bar graph denotes their standard deviation. One-way ANOVA using Dunnett’s T3 multiple comparison tests were performed to analyze the statistical significance. ***p < 0.001; ****p < 0.0001.
Fig. 4
Fig. 4. Combination of prexasertib and PDD treatment causes replication stress and DNA damage.
A Immunofluorescence study showing pRPA32(S33) foci in SKOV3 cells treated with DMSO, 5 nM prexasertib, 5 µM PDD and their combination. B Histogram representation of total cells positive for pRPA32(S33) foci in SKOV3 cells treated with DMSO, 5 nM prexasertib, 5 µM PDD and their combination. A total of 50 cells from each of the three different experiments were counted for our histogram. C Immunofluorescence study showing pH2AX(S139) foci in SKOV3 cells treated with DMSO, 5 nM prexasertib, 5 µM PDD and their combination. D Histogram representation of percentage of cells with total pan-nuclear pH2AX(S139) staining in SKOV3 cells treated with DMSO, 5 nM prexasertib, 5 µM PDD and their combination. A total of 50 cells from each of the three different experiments were counted for our histogram. Error bars represent the mean ± standard deviation in case of pRPA32(S33) foci and mean ± standard error of mean (SEM) in case of pH2AX(S139). One-way ANOVA using Tukey’s multiple comparison tests were performed to analyze the statistical significance. n.s. not significant; *p < 0.05; ****p < 0.0001.
Fig. 5
Fig. 5. PDD sensitizes prexasertib-induced DNA damage and increases nuclear distortion.
A, B Comet assay representative images treated with DMSO, 5 nM prexasertib, 5 µM PDD and their combination for 24 h in OVCAR8 and SKOV3, respectively. C, D Analysis of comet tail area in more than 50 cells from three independent experiments with their standard deviation as the error bars in OVCAR8 and SKOV3, respectively. E, F Distorted nuclei representative images in DAPI-stained nucleus of OVCAR8 and SKOV3, respectively treated with DMSO, 5 nM prexasertib, 5 µM PDD and their combination for 24 h. G, H Percentage of cells with distorted nuclei analyzed more than 200 cells from three different experiments with their standard error of mean as the error bars. One-way ANOVA using Dunnett’s T3 multiple comparison test for comet assay and Tukey’s multiple comparison tests for nuclear distortion assay were performed to analyze the statistical significance. n.s. not significant; *p < 0.05; **p < 0.01; ***p < 0.001; ****p < 0.0001.
Fig. 6
Fig. 6. Prexasertib in combination with PDD causes synergistic lethality in OC cells.
AC Representative Bliss synergy plots of indicated OC cell lines concurrently treated with serial dilutions of prexasertib, PDD and prexasertib plus PDD in OVCAR8, SKOV3 and OVSAHO, respectively. D, E Colony assay plate wells of OC cells treated with DMSO, 1 nM prexasertib, 50 µM PDD and their combination as well as DMSO, 1.5 nM prexasertib, 40 µM PDD and their combination in both OVCAR8 and SKOV3, respectively. F, G Histogram representation of colony intensity in OC cells treated with two different concentrations of both prexasertib and PDD as well as their combinations in OVCAR8 and SKOV3, respectively. Error bars represent the standard deviation from three independent experiments in both OC cells. Two-way ANOVA with Tukey’s multiple comparison tests were performed to analyze the statistical significance. n.s. not significant; *p < 0.05; **p < 0.01; ***p < 0.001; ****p < 0.0001.
Fig. 7
Fig. 7. Prexasertib and PDD combination showed synergy in platinum drug resistance cell line as well as 3D organoids models of patient-derived ovarian tumor cells.
A, B Representative Bliss synergy plots of indicated OC cell lines concurrently treated with serial dilutions of prexasertib, PDD and prexasertib plus PDD in A2780 cells and its isogenic platinum resistant model A2780/CP70, respectively. C Immunoblot study showing activation of DNA damage protein pH2AX(S139), activation of replication stress marker pRPA32(S33) and phosphorylation of DNA damage response maker CHK11 at S317 in both A2780 cells and its isogenic platinum resistant model A2780/CP70 cells. D Representative OC patient-derived primary 3D tumor organoids (TX-OV-285 cells) treated with DMSO, 5 nM prexasertib, 5 µM PDD and their combination. Scale bar represents 100 µm. EG Histogram representative of organoids sizes more than 100 µm treated with DMSO, 5 nM prexasertib, 5 µM PDD and their combination for 7-10 days in TX-OV-076, TX-OV-186, and TX-OV-285 cells, respectively. H Histogram representative of number of organoids with size more than 100 µm treated with DMSO, 5 nM prexasertib, 5 µM PDD and their combination for 7–10 days in TX-OV-076, TX-OV-186, and TX-OV-285 cells. The organoids size (length) of >100 µm from fifteen images taken from three independent experiments were quantified and error bars represent the standard error of mean. One-way ANOVA with Games-Howell’s multiple comparison tests were performed to analyze statistical significance. n.s. not significant; *p < 0.05; **p < 0.01; ***p < 0.001; ****p < 0.0001.
Fig. 8
Fig. 8. PDD treatment induces prexasertib-induced NAD+ depletion and reduces cancer cell stemness in OC cells.
A NAD+ assay shows PDD treatment together with 1 µM prexasertib showed more reduced levels of cellular NAD+ compared to prexasertib individual treatment in OVCAR8 cells. B Represeantative AldeFluor assay shows depleted ALDH positive cells while treated 5 µM PDD compared to DMSO treated control in OC cells. DEAB was used here is an ALDH negative control. C, D Histogram representation of percentage of ALDH-positive cells treated with DEAB, DMSO, and 5 µM PDD in OVCAR8 and SKOV3, respectively. E Immunoblot study showing the protein expression level of ALDH1A1 while OC cells were treated with DMSO, 5 nM prexasertib, 5 µM PDD, and their combination. All the experiments were done in triplicates and the error bars represent the standard deviation from three independent experiments. F Hypothetical/working model illustrating the synergetic lethality with CHK1 and PARG inhibition in ovarian cancer (OC) cells. One-way ANOVA with Tukey’s multiple comparison test for NAD+ assay and Dunnett’s T3 multiple comparison test for AldeFluor assay were performed to analyze the statistical significance. n.s. not significant; *p < 0.05; ***p < 0.001; ****p < 0.0001.

References

    1. Siegel RL, Miller KD, Wagle NS, Jemal A. Cancer statistics, 2023. CA Cancer J Clin. 2023;73:17–48. doi: 10.3322/caac.21763. - DOI - PubMed
    1. Gubbels JA, Claussen N, Kapur AK, Connor JP, Patankar MS. The detection, treatment, and biology of epithelial ovarian cancer. J Ovarian Res. 2010;3:8. doi: 10.1186/1757-2215-3-8. - DOI - PMC - PubMed
    1. Wang Q, Wei X, Hu L, Zhuang L, Zhang H, Chen Q. Hedgehog-Gli2 signaling promotes chemoresistance in ovarian cancer cells by regulating MDR1. Front Oncol. 2021;11:794959. doi: 10.3389/fonc.2021.794959. - DOI - PMC - PubMed
    1. Nirmaladevi R. Epigenetic alterations in cancer. Front Biosci. 2020;25:1058–109. doi: 10.2741/4847. - DOI - PubMed
    1. Morand S, Devanaboyina M, Staats H, Stanbery L, Nemunaitis J. Ovarian cancer immunotherapy and personalized medicine. Int J Mol Sci. 2021;22:6532. doi: 10.3390/ijms22126532. - DOI - PMC - PubMed

Grants and funding