. 2024 Jun 11;15(1):4969.
doi: 10.1038/s41467-024-49221-0.

MYG1 drives glycolysis and colorectal cancer development through nuclear-mitochondrial collaboration

Affiliations

MYG1 drives glycolysis and colorectal cancer development through nuclear-mitochondrial collaboration

Jianxiong Chen et al. Nat Commun. .

Abstract

Metabolic remodeling is a strategy for tumor survival under stress. However, the molecular mechanisms during the metabolic remodeling of colorectal cancer (CRC) remain unclear. Melanocyte proliferating gene 1 (MYG1) is a 3'-5' RNA exonuclease and plays a key role in mitochondrial functions. Here, we uncover that MYG1 expression is upregulated in CRC progression and highly expressed MYG1 promotes glycolysis and CRC progression independent of its exonuclease activity. Mechanistically, nuclear MYG1 recruits HSP90/GSK3β complex to promote PKM2 phosphorylation, increasing its stability. PKM2 transcriptionally activates MYC and promotes MYC-medicated glycolysis. Conversely, c-Myc also transcriptionally upregulates MYG1, driving the progression of CRC. Meanwhile, mitochondrial MYG1 on the one hand inhibits oxidative phosphorylation (OXPHOS), and on the other hand blocks the release of Cyt c from mitochondria and inhibits cell apoptosis. Clinically, patients with KRAS mutation show high expression of MYG1, indicating a high level of glycolysis and a poor prognosis. Targeting MYG1 may disturb metabolic balance of CRC and serve as a potential target for the diagnosis and treatment of CRC.


Conflict of interest statement

The authors declare no competing interests.

Figures

Fig. 1
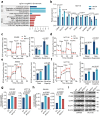
Fig. 1. MYG1 is an oncogenic gene associated with CRC progression and poor clinical outcomes.
a Enriched KEGG pathways of GSEA in TCGA COADREAD cohort (n = 433). Top 10 metabolic pathways were labeled. Red: metabolic pathways. FDR: False Discovery Rate. b MYG1 expression in normal mucosa and paired tumor samples were tested by western blot (n = 8) followed by quantification. Quantification is for the presented representative blot from n = 3 independent experiments. c Representative image and quantification of MYG1 IHC analysis of CRC tumor and adjacent normal mucosal in NF-CRC1 cohort (n = 149 pairs). Scale bar, 200 μm (main macrophages) and 50 μm (insets). d Kaplan–Meier analysis of overall survival and progression free survival of patients in NF-CRC1 cohort (n = 149 pairs) based on MYG1 expression evaluated in c. e The number of MYG1 CNV events in TCGA COADREAD cohort (n = 611). f The level of MYG1 protein was detected in normal colon mucosa cell line FHC and CRC cell lines by western blot (bottom) and followed by quantification (top). KRAS and APC status of cell lines were labeled below. W, wild type; M, mutation. The samples derive from the same experiment but different gels for MYG1, and another for β-Tubulin were processed in parallel. n = 3 independent experiments. g Transcription levels (log2 (x + 1) transformed RSEM normalized count) of MYG1 in TCGA COADREAD cohort with KRAS wild type (WT, n = 194) and mutation (MUT, n = 163). h Representative images and quantification of MYG1 IHC analysis in NF-KRAS cohort with KRAS wild type (WT, n = 41) and mutation (MUT, n = 27). Scale bar, 100 μm. Two-sided permutation test for GSEA and two-sided hypergeometric test for KEGG pathway enrichment analysis (a). Paired two-sided Student’s t-test (b). Two-sided Pearson Chi-square test (c). Log-rank test (d). One-way ANOVA, Dunnett’s multiple comparisons test, comparison with FHC (f). Unpaired two-sided Student’s t-test (g). Two-sided Mann–Whitney test (h). p and r values were provided in the figure. Error bars, mean ± SD. See also Supplementary Fig. 1. Source data are provided as a Source Data file.
Fig. 2
Fig. 2. MYG1 accelerates CRC proliferation and metastasis in vitro and in vivo.
al RKO and LoVo cells were infected with lentivirus expressing control shRNA (shNC) and two targeting shRNAs (shMYG1#1, shMYG1#2). SW480 and HCT116 cells were infected with lentivirus expressing empty vector (EV), MYG1, and MYG1ALL. LoVo cells were transfected with control sgRNA (sgCtrl) and sgMYG1. Tumor biological behaviors of CRC cells as indicated were examined by proliferation assay (a, e, i) (n = 3 technical replicates, representative data from n = 3 independent experiments), colony formation assay (b, f, j), transwell invasion assay (c, g, k) and wound healing assay (d, h, l), respectively. p value represents comparison with shNC group (b, c, and d). n = 3 independent experiments (bd, fh, and jl). mo RKO and SW480 cells treated as indicated were utilized to establish subcutaneously xenograft tumor model and liver metastasis model of CRC in BALB/c nude mice (xenograft tumor model: n = 6 in RKO and n = 5 in SW480; liver metastasis model: n = 5 in each group). The photograph (left) and weight (right) of subcutaneously xenograft tumors (m). Representative images of H&E staining in mouse liver from a CRC liver metastasis model (n). Scale bar, 3 mm. The number of liver metastatic lesions was counted in CRC liver metastasis models (o). pq Fluorescence intensity quantification of E-cadherin and Fibronectin in SW480 (p) and RKO (q) cells (n = 3 independent experiments). Two-way ANOVA, Tukey’s multiple comparisons test (a, e, and i). Unpaired two-sided Student’s t-test (jm and op). One-way ANOVA, Dunnett’s multiple comparisons test (bd, fh, m, and q). p value was provided in the figure. Error bars, mean ± SD. See also Supplementary Figs. 2 and 3. Source data are provided as a Source Data file.
Fig. 3
Fig. 3. MYG1 promotes aerobic glycolysis of CRC in vitro.
a Bar plot of Disease Ontology (GO), Gene Ontology (GO), and KEGG analysis results based on RNA-seq data of control and MYG1 knockout LoVo cells. n = 3 samples generated after independent generation of cells and processed on different days. b Relative mRNA expression of glycolysis-related genes in control and stable MYG1 overexpressed HCT116 cells detected by RT-qPCR (n = 3 technical replicates, representative data from n = 3 independent experiments). OCR was determined in control and stably MYG1 overexpressed SW480 (c) and HCT116 (d) cells (left). Basal respiration and max respiration were analyzed (right). ECAR was determined in control and MYG1 overexpressed SW480 (e) and HCT116 (f) cells (left). Glycolysis rate and glycolysis capacity were analyzed (right). Norm.Unit represents the normalized OCR and ECAR. Glucose uptake (g) and lactate secretion (h) of control, stable MYG1 and MYG1ALL overexpressed SW480 and HCT116 cells. i Protein expressions of PKM2, LDHA, and GLUT1 in control, stable MYG1 and MYG1ALL overexpressed SW480 and HCT116 cells were tested by western blot. The samples derive from the same experiment but different gels for Flag, another for PKM2, another for LDHA and GLUT1, and another for β-Actin were processed in parallel. The quantification provided under the blots is for the representative blot from n = 3 independent experiments. n = 3 independent experiments (ch). Two-sided Hypergeometric test (a). Unpaired two-sided Student’s t-test (bf). One-way ANOVA, Dunnett’s multiple comparisons test (gh). p value was provided in the figure. Error bars, mean ± SD. See also Supplementary Fig. 4. Source data are provided as a Source Data file.
Fig. 4
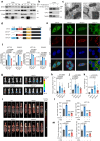
Fig. 4. Nuclear MYG1 plays a more critical role in promoting CRC progression through glycolysis.
a MYG1 expression in the subcellular compartments of cells were determined by western blot. W, whole cell lysis. C, cytoplasm. N, nucleus. M, mitochondria. CM, cytoplasm with mitochondria removed. The samples derive from the same experiment but different gels for MYG1 and COX4, and another for GAPDH and H3 were processed in parallel. b Mitochondrial fractions were analyzed by protease K shaving assay. VDAC1 was sensitive to protease K treatment, whereas TIMM23 was resistant. Proteins were digested by protease K in the presence of 1% Triton X-100. The samples derive from the same experiment but different gels for MYG1 and VDAC1, and another for TIMM23 were processed in parallel. c Images of Flag-tagged MYG1 in mitochondria of 293 T cells as detected by immunoelectron microscopy. Scale bar, 200 nm (left) and 500 nm (right). Representative of 25 images from n = 2 independent experiments. d Schematic of MYG1 domain and variant constructs. e Cellular location of Flag-tagged MYG1 variants was confirmed by IF in HCT116 cells. Scale bar, 10 μm. Representative images from n = 2 independent experiments. f The levels of glucose uptake and lactate secretion were detected. gk Luciferase-labeled HCT116 were utilized to establish orthotopic CRC mouse models (n = 5 in each group). Bioluminescence imaging of mice was detected on the 30th day (g) and the signals were quantified (h). PET/CT images with the signals indicated SUV normalized to body weight (SUVbw) of mice. The maximum 18F-FDG uptake value (SUVmax) was obtained by browsing different layers of PET imaging (i, dashed cycle marked) and quantified (j). Tumors were separated and weighted (k) after sacrificing the mice. The invasion (l) and colony formation ability (m) were detected. n = 3 independent experiments (ab, f, and lm). Kruskal–Wallis test, Dunn’s multiple comparisons test (h and k). One-way ANOVA, Tukey’s multiple comparisons test (f and j). Two-way ANOVA, Tukey’s multiple comparisons test (lm). p value was provided in the figure. Error bars, mean ± SD. See also Supplementary Fig. 5. Source data are provided as a Source Data file.
Fig. 5
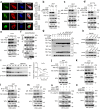
Fig. 5. Nuclear MYG1 recruits HSP90 to phosphorylate PKM2 and increase its stability.
a Representative images of the co-localization of MYG1 and PKM2 in 293 T, HCT116, and SW480 cells (left, scale bar, 10 μm), and Pearson’s correlation coefficient (PCC) was analyzed in the ROI marked with dashed lines. 293 T and HCT116 cells were treated with EGF (100 ng/mL) for 10 h before fixing. Representative of 24 images from n = 3 independent experiments (left), and each point represents the average PCC of each experiment (right). 293 T (b) and HCT116 (d) cells were treated with EGF (100 ng/mL) for 10 h and lysed for immunoprecipitation. 293 T (c) and LoVo (e) cells were treated with EGF (100 ng/mL) for 10 h and lysed for immunoprecipitation. f 293 T cells treated with EGF (100 ng/mL) for 10 h were fractioned into cytosol and nucleus and then subjected to immunoprecipitation. g 293 T cells transfected with different MYG1 constructs were treated with EGF (100 ng/mL) for 10 h and lysed for immunoprecipitation. h SW480 and HCT116 cells expressing MYG1 variants were detected for PKM2 protein level. i MYG1 KO LoVo cells treated with CHX (50 μg/mL) were harvested at 0, 2, 4, 6 h followed by detecting MYG1 and PKM2 protein levels by western blot (left) and quantified (right). jm 293 T and LoVo cells treated as indicated were collected to detect the interaction of MYG1 with HSP90 (j), PKM2 with HSP90 (k), MYG1 with GSK3β (l), and PKM2 with GSK3β (m). n HCT116 cells transfected with MYG1 or MYG1 treated with EGF (100 ng/mL) or GSK3 inhibitor IX (10 μM) for 10 h were subjected to immunoprecipitation. o LoVo cells transfected with siRNAs of HSP90 (#1, #2) were treated and detected as in n. n = 3 independent experiments (bo). See also Supplementary Fig. 6. Source data are provided as a Source Data file.
Fig. 6
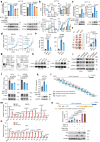
Fig. 6. Nuclear MYG1 accelerates glycolysis through the PKM2/c-Myc signaling pathway.
The PKM2 expression (a, bottom), glucose uptake and lactate secretion (a, top), OCR and ECAR (b) were detected. Norm.Unit represents the normalized OCR and ECAR (b). c Glucose uptake and lactate secretion was detected. d, e Proliferation and invasion ability were examined by proliferation assay (d, n = 3 technical replicates, representative data from n = 3 independent experiments) and transwell invasion assay (e). f Tumor growth was examined using subcutaneous xenograft tumor model (n = 6 in each group). The photograph (left) and weight (right) of tumors. g MYC TARGETS pathways were enriched in MYG1 highly expressed CRC patients (TCGA COADREAD cohort). h c-Myc expression was detected by western blot. The samples derive from the same experiment but different gels for c-Myc, and another for GAPDH were processed in parallel. i The expression of PKM2, c-Myc, MYG1, and GAPDH were detected by western blot. The samples derive from the same experiment but different gels for PKM2 and GAPDH, and another for c-Myc and MYG1 were processed in parallel. MYG1 mRNA was detected in cells with MYC koncked down (j) and MYC or TP53 overexpressed (k, the samples derive from the same experiment but different gels for Flag, and another for GAPDH were processed in parallel). ln SW620 (m) and LoVo (n) cell lysate were subjected to ChIP-qPCR. Schematic of primer pairs for qPCR (l). P13 was designed as a negative control and SOX2 was set as the positive control. o Schematic of fragments used for double luciferase report assay (top). Transcriptional activity of luciferase was detected and normalized by Renilla luciferase activity in 293 T cells (bottom). n = 3 independent experiments (ac, e, hk, m–o). Unpaired two-sided Student’s t-test (mn). One-way ANOVA, Tukey’s multiple comparisons test (ac, f, and o), Dunnett’s multiple comparisons test (e, and jk). Two-way ANOVA, Tukey’s multiple comparisons test (d). Kolmogorov–Smirnov test (g). p value was provided in the figure. Error bars, mean ± SD. See also Supplementary Figs. 7 and 8. Source data are provided as a Source Data file.
Fig. 7
Fig. 7. Mitochondrial MYG1 inhibits OXPHOS and apoptosis in CRC cells.
a Co-localization of MYG1 and Cyt c in 293 T and HCT116 cells was detected by IF. Mitotracker was used as an indicator of mitochondria. Scale bar, 10 μm (293 T) and 5 μm (HCT116). Representative of 13 images for 293 T and 9 images for HCT116 from n = 3 independent experiments. PCC of at least two ROIs from each image were analyzed and averaged. Dashed box displayed the selected ROI in the images (left). Graphs represent PCC of pairwise co-localization analysis of n = 3 independent experiments (right). b, c SW480 cells stably overexpressing MYG1 were used for immunoprecipitation in total cell lysates (b), cytoplasm (Cyto) and mitochondrial (Mito) (c, the lysis samples derive from the same experiment but different gels for Cyt c and GAPDH, and another for MYG1 and COX4 were processed in parallel). d Representative images of tumor tissues from n = 3 CRC patients and graphs represent PCC of MYG1 and Cyt c co-localization analysis from n = 3 patients (right). Scale bar, 50 μm. e The expression of Cyt c was detected by western blot. f OCR were detected in control and MYG1M expressed SW480 and HCT116 cells. g Distribution of Cyt c was detected in cytoplasm (Cyto) and mitochondrial (Mito) lysate by western blot. The samples derive from the same experiment but different gels for Cyt c, and another for COX4 and GAPDH were processed in parallel. h Cleaved Caspase 3 and Cleaved Caspase 9 expression were detected by western blot after treatment of 5-Fu (50 μM for 72 h). The samples derive from the same experiment but different gels for Cleaved Caspase 9 and GAPDH, and another for Cleaved Caspase 3 were processed in parallel. i Apoptosis was analyzed by flow cytometry after treatment of 5-Fu (50 μM for 72 h). n = 3 independent experiments (bc and ei). Unpaired two-sided Student’s t-test (f). One-way ANOVA, Dunnett’s multiple comparisons test (i). p value was provided in the figure. Error bars, mean ± SD. Source data are provided as a Source Data file.
Fig. 8
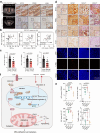
Fig. 8. MYG1 correlates with an active glycolysis pathway in CRC patients and tumor model.
ac MYG1, PKM2 and c-Myc protein levels were evaluated by IHC staining in specimens of CRC patients from NF-PET cohort (n = 43) and followed by quantification. Representative images of PET/CT and IHC staining (a). The areas marked by squares were magnified. Scale bar, 100 μm (insets). The correlations between the level of MYG1 and SUVmax, the level of PKM2 and c-Myc were analyzed (b). The protein levels of MYG1, PKM2, c-Myc in tumor and normal mucosa (c). d, e Expression of MYG1, PKM2, c-Myc, Ki-67 in tumor tissues from orthotopic CRC models were evaluated by IHC and apoptosis evaluated by TUNEL staining (d), and quantified (e) (n = 5 per group). The areas marked by squares were magnified. Scale bar, 200 μm (in IHC), and 100 μm (in IF). f Work model for MYG1 driving glycolysis and CRC development. Two-sided Pearson correlation (b). Unpaired two-sided Student’s t-test (c). One-way ANOVA, Dunnett’s multiple comparisons test (e). p value was provided in the figure. Representative results were shown (a and d). Error bars, mean ± SD. Source data are provided as a Source Data file.

Similar articles

Cited by

References

    1. International Agency for Research on Cancer. Globocan 2020: Cancer Fact Sheets—Colorectal Cancer. IARC [Internet]. Available from: http://gco.iarc.fr/today/data/factsheets/cancers/10_8_9-Colorectum-fact-....
    1. Hanahan D. Hallmarks of cancer: new dimensions. Cancer Discov. 2022;12:31–46. doi: 10.1158/2159-8290.CD-21-1059. - DOI - PubMed
    1. Philips M-A, et al. Characterization of MYG1 gene and protein: subcellular distribution and function. Biol. Cell. 2009;101:361–377. doi: 10.1042/BC20080086. - DOI - PubMed
    1. Aravind L, Koonin EV. A novel family of predicted phosphoesterases includes Drosophila prune protein and bacterial RecJ exonuclease. Trends Biochem Sci. 1998;23:17–19. doi: 10.1016/S0968-0004(97)01162-6. - DOI - PubMed
    1. Grover R, et al. Myg1 exonuclease couples the nuclear and mitochondrial translational programs through RNA processing. Nucleic Acids Res. 2019;47:5852–5866. doi: 10.1093/nar/gkz371. - DOI - PMC - PubMed

MeSH terms