. 2024 Jun 11;15(1):4950.
doi: 10.1038/s41467-024-48929-3.

Direct RNA sequencing of astronaut blood reveals spaceflight-associated m6A increases and hematopoietic transcriptional responses

Affiliations

Direct RNA sequencing of astronaut blood reveals spaceflight-associated m6A increases and hematopoietic transcriptional responses

Kirill Grigorev et al. Nat Commun. .

Abstract

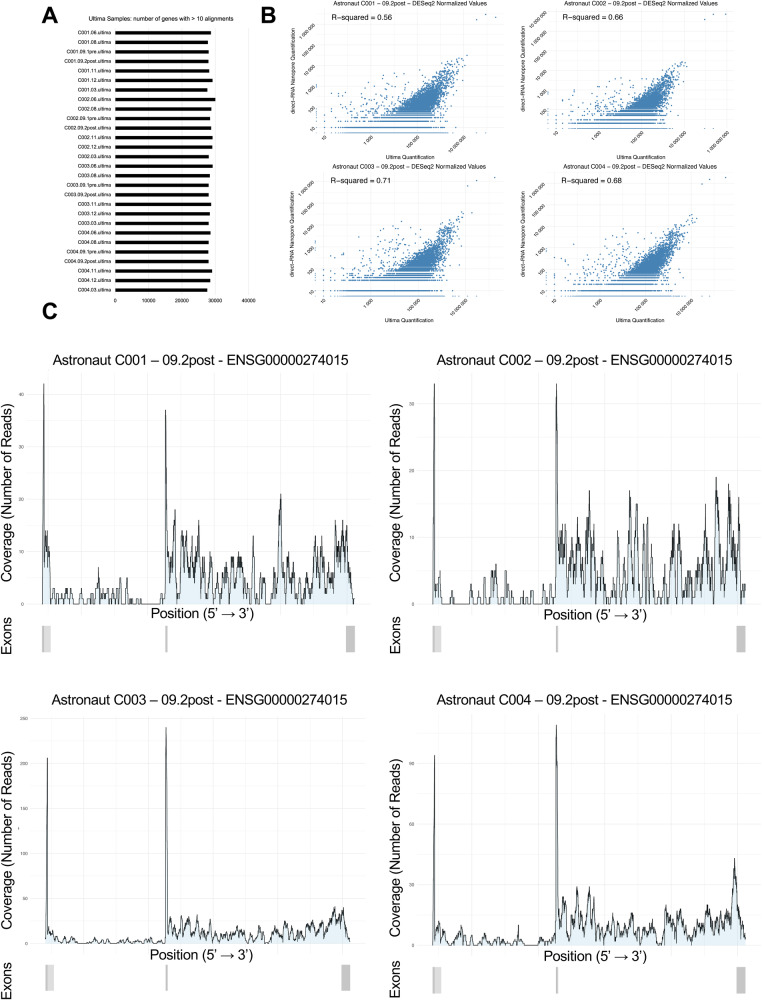
The advent of civilian spaceflight challenges scientists to precisely describe the effects of spaceflight on human physiology, particularly at the molecular and cellular level. Newer, nanopore-based sequencing technologies can quantitatively map changes in chemical structure and expression at single molecule resolution across entire isoforms. We perform long-read, direct RNA nanopore sequencing, as well as Ultima high-coverage RNA-sequencing, of whole blood sampled longitudinally from four SpaceX Inspiration4 astronauts at seven timepoints, spanning pre-flight, day of return, and post-flight recovery. We report key genetic pathways, including changes in erythrocyte regulation, stress induction, and immune changes affected by spaceflight. We also present the first m6A methylation profiles for a human space mission, suggesting a significant spike in m6A levels immediately post-flight. These data and results represent the first longitudinal long-read RNA profiles and RNA modification maps for each gene for astronauts, improving our understanding of the human transcriptome's dynamic response to spaceflight.


Conflict of interest statement

C.E.M. is a co-founder of Cosmica Biosciences. The remaining authors declare no competing interests.

Figures

Fig. 1
Fig. 1. Comparison of DGE pipelines.
Correlation of (a) per-gene counts obtained from featureCounts and salmon, and of (b) log2(FoldChange) values obtained from SARTools and pipeline-transcriptome-de. p values are obtained from a Wald test (DESeq2) and a generalized linear model test (edgeR), respectively, and plotted following FDR adjustment; in green, significant (p value < 0.05) as reported by both pipelines, in red, only reported as significant by pipeline-transcriptome-de, and in blue, only reported as significant by SARTools.
Fig. 2
Fig. 2. Patterns of gene expression in the top variable pathways.
a z-scored expression values of genes from the top 10 pathways most variable across all timepoints, as reported by featureCounts and salmon. b The top 10 pathways; dark rectangles denote the genes belonging to each pathway. Gene sets can be explored further at: https://www.gsea-msigdb.org/gsea/msigdb. c An example of the difference in the attribution of read counts to homologous genes when discarding secondary mappings (featureCounts) and when partially accounting for them (salmon); Pearson’s r between the counts reported by the two tools is annotated to the right of the heatmap.
Fig. 3
Fig. 3. Patterns of pathway co-regulation in the course of pre-flight, return, and recovery.
a Top 30 pathways most disrupted after return from space. Gene sets can be explored further at: https://www.gsea-msigdb.org/gsea/msigdb. b Top 30 pathways most consistent in expression during both pre-flight and return from space. On the right: examples of calculation of dz, the deviation of the z-score from the value expected under the assumption that the pathway is not disrupted.
Fig. 4
Fig. 4. Pathways with most differentially methylated genes.
a Correlation of the number of differentially methylated sites per gene, and expressional variability of each pathway. b Top 30 pathways with the most differentially methylated sites per gene, ranked by median differential methylation. Each dot in the box plot represents the value of differential methylation percentage of a site on any gene in the given pathway; the site’s location in the exon or the UTR is color-coded. Boxes represent the range between Q1 and Q3 (the first and the third quartile) of the distribution, thick lines within the boxes annotate the median value, and the whiskers extend by 1.5×(Q3 − Q1) in each direction. Pathways that are also significantly variable by expression (GESECA adjusted p value < 0.05; obtained from a permutation test) are annotated in red. Gene sets can be explored further at: https://www.gsea-msigdb.org/gsea/msigdb.
Fig. 5
Fig. 5. Validation of transcript variants utilizing Ultima Genomics deep RNA-sequencing.
A Number of genes detected by each Ultima sample, defined to have more than 10 alignments within the genomic locus. B Correlation between normalized DESeq2 gene expression profiles of R + 1 samples produced by either Nanopore direct-RNA Promethion or Ultima Genomics UG100 platform. C Coverage visualization for ENSG00000274015 for R + 1 samples. The gene structure is described by a single panel beneath the coverage plot, where darker shades of gray represent multiple merged transcript variants.

Similar articles

Cited by

  • A second space age spanning omics, platforms and medicine across orbits.
    Mason CE, Green J, Adamopoulos KI, Afshin EE, Baechle JJ, Basner M, Bailey SM, Bielski L, Borg J, Borg J, Broddrick JT, Burke M, Caicedo A, Castañeda V, Chatterjee S, Chin CR, Church G, Costes SV, De Vlaminck I, Desai RI, Dhir R, Diaz JE, Etlin SM, Feinstein Z, Furman D, Garcia-Medina JS, Garrett-Bakelman F, Giacomello S, Gupta A, Hassanin A, Houerbi N, Irby I, Javorsky E, Jirak P, Jones CW, Kamal KY, Kangas BD, Karouia F, Kim J, Kim JH, Kleinman AS, Lam T, Lawler JM, Lee JA, Limoli CL, Lucaci A, MacKay M, McDonald JT, Melnick AM, Meydan C, Mieczkowski J, Muratani M, Najjar D, Othman MA, Overbey EG, Paar V, Park J, Paul AM, Perdyan A, Proszynski J, Reynolds RJ, Ronca AE, Rubins K, Ryon KA, Sanders LM, Glowe PS, Shevde Y, Schmidt MA, Scott RT, Shirah B, Sienkiewicz K, Sierra MA, Siew K, Theriot CA, Tierney BT, Venkateswaran K, Hirschberg JW, Walsh SB, Walter C, Winer DA, Yu M, Zea L, Mateus J, Beheshti A. Mason CE, et al. Nature. 2024 Aug;632(8027):995-1008. doi: 10.1038/s41586-024-07586-8. Epub 2024 Jun 11. Nature. 2024. PMID: 38862027 Free PMC article. Review.
  • Protective alleles and precision healthcare in crewed spaceflight.
    Rutter LA, MacKay MJ, Cope H, Szewczyk NJ, Kim J, Overbey E, Tierney BT, Muratani M, Lamm B, Bezdan D, Paul AM, Schmidt MA, Church GM, Giacomello S, Mason CE. Rutter LA, et al. Nat Commun. 2024 Jul 22;15(1):6158. doi: 10.1038/s41467-024-49423-6. Nat Commun. 2024. PMID: 39039045 Free PMC article. Review.
  • Genome and clonal hematopoiesis stability contrasts with immune, cfDNA, mitochondrial, and telomere length changes during short duration spaceflight.
    Garcia-Medina JS, Sienkiewicz K, Narayanan SA, Overbey EG, Grigorev K, Ryon KA, Burke M, Proszynski J, Tierney B, Schmidt CM, Mencia-Trinchant N, Klotz R, Ortiz V, Foox J, Chin C, Najjar D, Matei I, Chan I, Cruchaga C, Kleinman A, Kim J, Lucaci A, Loy C, Mzava O, De Vlaminck I, Singaraju A, Taylor LE, Schmidt JC, Schmidt MA, Blease K, Moreno J, Boddicker A, Zhao J, Lajoie B, Altomare A, Kruglyak S, Levy S, Yu M, Hassane DC, Bailey SM, Bolton K, Mateus J, Mason CE. Garcia-Medina JS, et al. Precis Clin Med. 2024 Apr 8;7(1):pbae007. doi: 10.1093/pcmedi/pbae007. eCollection 2024 Mar. Precis Clin Med. 2024. PMID: 38634106 Free PMC article.
  • Telomeric RNA (TERRA) increases in response to spaceflight and high-altitude climbing.
    Al-Turki TM, Maranon DG, Nelson CB, Lewis AM, Luxton JJ, Taylor LE, Altina N, Wu F, Du H, Kim J, Damle N, Overbey E, Meydan C, Grigorev K, Winer DA, Furman D, Mason CE, Bailey SM. Al-Turki TM, et al. Commun Biol. 2024 Jun 11;7(1):698. doi: 10.1038/s42003-024-06014-x. Commun Biol. 2024. PMID: 38862827 Free PMC article.
  • Collection of biospecimens from the inspiration4 mission establishes the standards for the space omics and medical atlas (SOMA).
    Overbey EG, Ryon K, Kim J, Tierney BT, Klotz R, Ortiz V, Mullane S, Schmidt JC, MacKay M, Damle N, Najjar D, Matei I, Patras L, Garcia Medina JS, Kleinman AS, Wain Hirschberg J, Proszynski J, Narayanan SA, Schmidt CM, Afshin EE, Innes L, Saldarriaga MM, Schmidt MA, Granstein RD, Shirah B, Yu M, Lyden D, Mateus J, Mason CE. Overbey EG, et al. Nat Commun. 2024 Jun 11;15(1):4964. doi: 10.1038/s41467-024-48806-z. Nat Commun. 2024. PMID: 38862509 Free PMC article.

References

    1. Farkas Á, Farkas G. Effects of spaceflight on human skin. Ski. Pharm. Physiol. 2021;34:239–245. doi: 10.1159/000515963. - DOI - PubMed
    1. Roy-O’Reilly M, Mulavara A, Williams T. A review of alterations to the brain during spaceflight and the potential relevance to crew in long-duration space exploration. npj Microgravity. 2021;7:5. doi: 10.1038/s41526-021-00133-z. - DOI - PMC - PubMed
    1. Shen M, Frishman WH. Effects of spaceflight on cardiovascular physiology and health. Cardiol. Rev. 2019;27:122–126. doi: 10.1097/CRD.0000000000000236. - DOI - PubMed
    1. Petersen N, et al. Postflight reconditioning for European astronauts—a case report of recovery after six months in space. Musculoskelet. Sci. Pract. 2017;27:S23–S31. doi: 10.1016/j.msksp.2016.12.010. - DOI - PubMed
    1. Baran R, et al. The cardiovascular system in space: focus on in vivo and in vitro studies. Biomedicines. 2021;10:59. doi: 10.3390/biomedicines10010059. - DOI - PMC - PubMed