. 2024 Jun 11;15(6):407.
doi: 10.1038/s41419-024-06765-9.

ER-mitochondria association negatively affects wound healing by regulating NLRP3 activation

Affiliations

ER-mitochondria association negatively affects wound healing by regulating NLRP3 activation

Caterina Licini et al. Cell Death Dis. .

Abstract

Methicillin-resistant Staphylococcus aureus (MRSA) is the most common causative agent of acute bacterial skin and skin-structure infections (ABSSSI), one of the major challenges to the health system worldwide. Although the use of antibiotics as the first line of intervention for MRSA-infected wounds is recommended, important side effects could occur, including cytotoxicity or immune dysregulation, thus affecting the repair process. Here, we show that the oxazolidinone antibiotic linezolid (LZD) impairs wound healing by aberrantly increasing interleukin 1 β (IL-1β) production in keratinocytes. Mechanistically, LZD triggers a reactive oxygen species (ROS)-independent mitochondrial damage that culminates in increased tethering between the endoplasmic reticulum (ER) and mitochondria, which in turn activates the NLR family pyrin domain-containing 3 (NLRP3) inflammasome complex by promoting its assembly to the mitochondrial surface. Downregulation of ER-mitochondria contact formation is sufficient to inhibit the LZD-driven NLRP3 inflammasome activation and IL-1β production, restoring wound closure. These results identify the ER-mitochondria association as a key factor for NLRP3 activation and reveal a new mechanism in the regulation of the wound healing process that might be clinically relevant.


Conflict of interest statement

The authors declare no competing interests.

Figures

Fig. 1
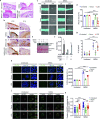
Fig. 1. LZD inhibits healing in a murine model of MRSA-infected wound.
a Representative images of wound closure in mice, treated as indicated, at day 10. b Representative histology of the wound healing in mice, treated as indicated, at day 10 (skin sections; H&E staining). Scale bars; 100 µm; inserts: 40 µm. c Evaluation of wound healing by different histological parameters (One-way ANOVA: *P = 0.0109 [Inflammatory infiltrate: uninfected/untreated vs MRSA/LZD]; *P = 0.0497 [Inflammatory infiltrate: MRSA/Vanco vs MRSA/LZD]; **P = 0.0018; ****P < 0.0001). d Representative Sirius Red staining of collagen organization in wounded skin sections of mice, treated as indicated, at day 10 (scale bars: 40 µm). Fluorescent images on the right. e Representative immunohistochemistry staining images of different wound healing markers, taken from skin sections of mice, treated as indicated. Scale bars: 40 µm; inserts: 20 µm.
Fig. 2
Fig. 2. LZD promotes IL-1β secretion via NLRP3 activation.
a Representative histology of the wound healing in mice, treated as indicated, at day 10 (skin sections; H&E staining). Scale bars; 100 µm; inserts: 40 µm. b Representative immunohistochemistry staining images of wounded skin sections, taken from mice, treated as indicated. Scale bars: 40 µm; inserts: 20 µm. c Representative images at times 0 and 24 h from wound opening in HaCaT cells, treated as indicated. d HaCaT cells were treated as indicated. Quantification of wound closure (showed as percentage) has been performed 24 h after wound opening (n = 3 independent experiments; Two-way ANOVA: ***P = 0.0008; ****P < 0.0001). e Representative immunoblot for Caspase 1 p20 secreted into the culture medium of HaCaT cells, treated as indicated. f Densitometric analysis of immunoblots for Caspase p20 in HaCaT culture media, normalized on Ponceau Red staining (n = 3 independent experiments; Two-way ANOVA: *P = 0.0197 [uninfected/untreated vs MRSA/untreated]; *P = 0.0472 [uninfected/LZD vs MRSA/LZD]). g Quantification of IL-1β secreted into supernatants from HaCaT cells, treated as indicated, performed by ELISA assay (n = 3 independent experiments; Two-way ANOVA: **P = 0.0015; ***P = 0.0002; ****P < 0.0001). h Representative images of Caspase 1 activation (green) in HaCaT cells treated as indicated, detected by FAM-FLICA (scale bars: 10 μm). Magnifications of Caspase 1 activation (white arrows) have been reported. i Quantification of the FLICA intensity in HaCaT cells, treated as indicated (n = 3 independent experiments; Two-way ANOVA: ****P < 0.0001). j Representative confocal immunofluorescence staining images of NLRP3 (red) and TOM20 (used as a mitochondrial marker, green) in HaCaT cells, treated as indicated (scale bars: 5 μm). Merged images are shown. Magnification of TOM20, NLRP3, and merged images in insets. k Quantification of NLRP3/mitochondria association in HaCaT cells, treated as indicated, by Manders’ coefficient calculation (n = 3 independent experiments; Two-way ANOVA: ***P = 0.0003; ****P < 0.0001).
Fig. 3
Fig. 3. LZD induces mitochondrial damage.
a Evaluation of glycolytic activity by the extracellular acidification rate (ECAR) in uninfected HaCaT cells, with or without addiction of Vancomycin or LZD. The additions of glucose, oligomycin (Oligo.), and deoxyglucose (2-DG) are indicated as dotted, vertical lines. b Evaluation of glycolytic activity by the extracellular acidification rate (ECAR) in MRSA-infected HaCaT cells, with or without addiction of Vancomycin or LZD. The additions of glucose, oligomycin (Oligo.), and deoxyglucose (2-DG) are indicated as dotted, vertical lines. c Quantification of glycolysis in HaCaT cells, treated as indicated (n = 3 independent experiments; Two-way ANOVA: *P = 0.0193; **P = 0.0042; ****P < 0.0001). d Representative immunoblot for AMPK and phosphorylated AMPK (p-AMPK; Thr172) in HaCaT cells, treated as indicated e Representative immunohistochemistry staining of p-AMPK in wounded skin sections, taken from mice treated as indicated. f Representative confocal images of mitochondrial morphology (TOM20) in HaCaT cells, treated as indicated (scale bars: 5 µm). Magnifications in insets. g Morphometric analysis of the mitochondrial network in HaCaT cells, treated as indicated, by calculation of the parameter “form factor” (n = 3 independent experiments; Two-way ANOVA: ****P < 0.0001). h Analysis of mitochondrial network connectivity in HaCaT cells, treated as indicated, by calculation of the parameter “branch length” (n = 3 independent experiments; Two-way ANOVA: ***P = 0.0002; ****P < 0.0001).
Fig. 4
Fig. 4. LZD increases ER-mitochondria association.
a Mitochondrial Superoxide levels in HaCaT cells, treated as indicated, were detected by Mitosox probe (n = 3 independent experiments; Two-way ANOVA: ****P < 0.0001). b Cytosolic mtDNA evaluation by the analysis of mt-CO1 and mt-Dloop levels, in HaCaT cells, treated as indicated (n = 3 independent experiments; Two-way ANOVA: **P = 0.0014 [uninfected/untreated vs MRSA/untreated]; **P = 0.0016 [MRSA/untreated vs MRSA/Vanco]; **P = 0.0023 [MRSA/untreated vs MRSA/LZD]; **** P < 0.0001). c Representative confocal images of ER-mitochondria association in HaCaT cells, transiently transfected with SEC61-GFP (ER marker) and mitochondrial-targeted cherry (mt-cherry, mitochondrial marker), and then treated as indicated (scale bars: 5 µm). Merged images are shown. Magnification of SEC61-GFP, mt-cherry, and merged images in insets. d Quantification of ER-mitochondria associations by Manders’ coefficients calculation in HaCaT cells, treated as indicated (n = 3 independent experiments; Two-way ANOVA: **P = 0.0024 [M1: uninfected/untreated vs MRSA/untreated]; **P = 0.0080 [M1: uninfected/untreated vs uninfected/LZD]; **P = 0.0092 [M1: uninfected/Vanco vs uninfected/LZD]; ***P = 0.0005 [M1: MRSA/untreated vs MRSA/Vanco]; ***P = 0.0005 [M1: MRSA/Vanco vs MRSA/LZD]; ***P = 0.0009 [M2: MRSA/untreated vs MRSA/Vanco]; **P = 0.0012 [M2: MRSA/Vanco vs MRSA/LZD]; ****P < 0.0001). e Schematic drawing representing principles of the BRET method. Bioluminescence is developed as a consequence of the proximity of R-Luc (mitochondria) and mVenus (ER). f Quantification of bioluminescence intensity detected by BRET assay, in HaCaT cells, treated as indicated (n = 3 independent experiments; Two-way ANOVA: *P = 0.0383; ***P = 0.0008; ****P < 0.0001).
Fig. 5
Fig. 5. LZD-mediated NLRP3 activation depends on ER-mitochondria contact increase.
a Representative confocal images of ER-mitochondria association in control (negative siRNA) and PDZD8-silenced HaCaT cells, transiently transfected with SEC61-GFP (ER marker) and mitochondrial-targeted cherry (mt-cherry, mitochondrial marker), and then treated as indicated (scale bars: 5 µm). Merged images are shown. Magnification of SEC61-GFP, mt-cherry, and merged images in insets. b Quantification of ER-mitochondria associations by Manders’ coefficients calculation in control (negative siRNA) and PDZD8-silenced HaCaT cells, treated as indicated (n = 3 independent experiments; Two-way ANOVA: **P = 0.0011 [M1: CTRL siRNA uninfected/LZD vs PDZD8 sirna uninfected/LZD]; ***P = 0.0008 [M1: CTRL siRNA uninfected/untreated vs CTRL siRNA uninfected/LZD]; ***P = 0.0010 [M1: CTRL siRNA uninfected/untreated vs CTRL siRNA MRSA/untreated]; ***P = 0.0004 [M1: CTRL siRNA MRSA/LZD vs PDZD8 siRNA MRSA/LZD]; ***P = 0.0001 [M2: CTRL siRNA uninfected/untreated vs CTRL siRNA uninfected/LZD]; ****P < 0.0001). c Representative confocal immunofluorescence staining images of NLRP3 (green) and TOM20 (used as a mitochondrial marker, red) in control (negative siRNA) and PDZD8-silenced HaCaT cells, treated as indicated (scale bars: 5 µm). Merged images are shown. Magnification of TOM20, NLRP3, and merged images in insets. d Quantification of NLRP3/mitochondria association in control (negative siRNA) and PDZD8-silenced HaCaT cells, treated as indicated, by Manders’ coefficient calculation (n = 3 independent experiments; Two-way ANOVA: ***P = 0.0008; ****P < 0.0001.
Fig. 6
Fig. 6. Downregulation of ER-mitochondria tethering improves closure of LZD-treated wounds.
a Quantification of the FLICA intensity in control (negative siRNA) and PDZD8-silenced HaCaT cells, treated as indicated (n = 3 independent experiments; Two-way ANOVA; **P = 0.0081; ****P < 0.0001). b Quantification of IL-1β secreted into supernatants from control (negative siRNA) and PDZD8-silenced HaCaT cells, treated as indicated, performed by ELISA assay (n = 3 independent experiments; Two-way ANOVA: ***P = 0.0004; ****P < 0.0001). c Control (negative siRNA) and PDZD8-silenced HaCaT cells were treated as indicated. Quantification of wound closure (showed as percentage) has been performed 24 h after wound opening (n = 3 independent experiments; Two-way ANOVA: ****P < 0.0001). d Wound healing in the 3D-wound model. The colored parts represent pLKO-transfected (CTRL shRNA) and PDZD8 shRNA-transfected stable HaCaT cells. Colors from blue to yellow denote low to higher cell density, respectively. Scale bar: 100 µm. e Quantification of wound closure (showed as percentage) in the 3D-wound healing assay (n = 3 independent experiments; Two-way ANOVA: *P = 0.0202 [CTRL shRNA MRSA-S/LZD vs PDZD8 shRNA MRSA-S/LZD]; *P = 0.0356 [PDZD8 shRNA MRSA-S vs PDZD8 shRNA MRSA-S/LZD]).

Similar articles

Cited by

References

    1. Russo A, Vena A, Bassetti M. Antibiotic treatment of acute bacterial skin and skin structure infections. Curr Opin Infect Dis. 2022;35:120–7. doi: 10.1097/QCO.0000000000000822. - DOI - PubMed
    1. Kaye KS, Petty LA, Shorr AF, Zilberberg MD. Current epidemiology, etiology, and burden of acute skin infections in the United States. Clin Infect Dis. 2019;68:S193–S199. doi: 10.1093/cid/ciz002. - DOI - PMC - PubMed
    1. Golan Y. Current treatment options for acute skin and skin-structure infections. Clin Infect Dis. 2019;68:S206–S212. doi: 10.1093/cid/ciz004. - DOI - PMC - PubMed
    1. Giacobbe DR, Dettori S, Corcione S, Vena A, Sepulcri C, Maraolo AE, et al. Emerging treatment options for acute bacterial skin and skin structure infections and bloodstream infections caused by staphylococcus aureus: a comprehensive review of the evidence. Infect Drug Resistance. 2022;15:2137–57. doi: 10.2147/IDR.S318322. - DOI - PMC - PubMed
    1. Kalghatgi S, Spina CS, Costello JC, Liesa M, Morones-Ramirez JR, Slomovic S, et al. Bactericidal antibiotics induce mitochondrial dysfunction and oxidative damage in Mammalian cells. Sci Transl Med. 2013;5:192ra185. doi: 10.1126/scitranslmed.3006055. - DOI - PMC - PubMed

Publication types

MeSH terms