. 2024 Jun 11;15(1):4976.
doi: 10.1038/s41467-024-49065-8.

Molecular mechanism of BMP signal control by Twisted gastrulation

Affiliations

Molecular mechanism of BMP signal control by Twisted gastrulation

Tomas Malinauskas et al. Nat Commun. .

Abstract

Twisted gastrulation (TWSG1) is an evolutionarily conserved secreted glycoprotein which controls signaling by Bone Morphogenetic Proteins (BMPs). TWSG1 binds BMPs and their antagonist Chordin to control BMP signaling during embryonic development, kidney regeneration and cancer. We report crystal structures of TWSG1 alone and in complex with a BMP ligand, Growth Differentiation Factor 5. TWSG1 is composed of two distinct, disulfide-rich domains. The TWSG1 N-terminal domain occupies the BMP type 1 receptor binding site on BMPs, whereas the C-terminal domain binds to a Chordin family member. We show that TWSG1 inhibits BMP function in cellular signaling assays and mouse colon organoids. This inhibitory function is abolished in a TWSG1 mutant that cannot bind BMPs. The same mutation in the Drosophila TWSG1 ortholog Tsg fails to mediate BMP gradient formation required for dorsal-ventral axis patterning of the early embryo. Our studies reveal the evolutionarily conserved mechanism of BMP signaling inhibition by TWSG1.


Conflict of interest statement

The authors declare no competing interests.

Figures

Fig. 1
Fig. 1. Crystal structure of human twisted gastrulation (TWSG1).
A Domain organization of human TWSG1. Predicted glycosylated asparagine residues (52, 81, and 147) are marked with gray hexagons. B SEC-MALS analysis of TWSG1. The experimentally determined molecular mass of TWSG1 varies from 26,332 to 61,937 Da. Theoretical molecular mass of the TWSG1 monomer is 23,541 Da protein plus 5648 Da Asn-linked glycans (three Man9GlcNAc2 moieties, 1.88264 kDa each). Traces of absorbance at 280 nm and calculated molecular mass are colored in black and red, respectively. C Crystal structure of the human TWSG1 dimer with one protomer colored as rainbow (N-terminus, blue; C-terminus, red) and one in gray. The two views differ by a 180° rotation around a vertical axis. D, E Architecture of the TWSG1 N- and C-terminal domains (NTD and CTD). Disulfide bonds are numbered in Roman numerals and shown as yellow spheres and sticks. FI SPR-based equilibrium binding experiments. Different concentrations of TWSG1 NTD (black circles), CTD (pink squares), and BSA (aquamarine triangles) were injected over surfaces coated with BMP7 (F), GDF5 (G), BMP2 (H), or CHRDL2 (I). Equilibrium binding dissociation constants (Kds) are indicated. RU response units.
Fig. 2
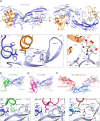
Fig. 2. Crystal structure of human TWSG1 in complex with Growth differentiation factor 5 (GDF5).
A Crystal structure of the TWSG1–GDF5 complex. The two views of the dimer differ by a 90° rotation around a horizontal axis. The disulfide-linked GDF5 dimer is colored in dark and light blue. The two TWSG1 NTDs are colored in orange and wheat. Calcium ions are shown as green spheres. B The side chain of TWSG1 Ile40 inserts into the hydrophobic pocket formed by two GDF5 protomers. Side chains of key residues are shown as sticks with oxygen and nitrogen atoms colored in red and blue, respectively. C Calcium-binding site forming interface contacts between TWSG1 and GDF5. Water molecules are shown as red spheres. Distances (Å) between selected atoms and GDF5 Trp414-Trp417 rings (T-shaped π-π stacking) are indicated with gray dashed lines. DF Structures of GDF5 in complex with the BMPR1B ectodomain (D; PDB ID 3EVS), the co-receptor RGMB (E; PDB ID 6Z3J), and BMP9 in complex with its pro-domain (F; PDB ID 4YCG). GDF5 and BMP9 are shown in the same orientation as in A. GI Close-up views of the interfaces for the complexes shown in DF. In all cases, interactions are mediated by a hydrophobic side chain exposed on the α-helix of the GDF5/BMP9-binding partner and a hydrophobic pocket formed by the two GDF5/BMP9 protomers. This mode of interaction is also observed in the TWSG1–GDF5 complex (shown in B).
Fig. 3
Fig. 3. TWSG1 inhibits BMP signaling in cellular assays and mouse intestinal organoids.
A GDF5 activates SMAD-dependent BMP signaling in a concentration-dependent manner in C2C12 myoblasts with a half-maximal effective concentration (EC50) of 26.63 nM (blue circles). TWSG1 (1 μM) inhibited GDF5 signaling (red circles). B TWSG1 inhibits GDF5 (40 nM) signaling in a concentration-dependent manner in C2C12 myoblasts with a half-maximal inhibitory concentration (IC50) of 67.11 nM. AC, Activation of a luciferase reporter assay as a readout of GDF5 signaling was measured eight times at each GDF5 concentration (n = 8, indicated by open circles). CI, Confidence Interval. XY signaling data were fitted to a non-linear, sigmoidal, four-parameter logistic model. C Comparison of TWSG1 and Gremlin-1 (GREM1), a BMP signaling inhibitor. Both TWSG1 (1 μM) and GREM1 (1 μM) inhibited GDF5 signaling (0, 10, 20, and 40 nM), but TWSG1 seemed to be a stronger inhibitor than GREM1. D, E Wild-type TWSG1 (but not TWSG1 Ile40Glu) inhibits GDF5 (D) and BMP7 (E) signaling. F Neither wild-type TWSG1 nor TWSG1 Ile40Glu inhibits BMP2 signaling. CF Each column represents the average signaling, measured eight times (n = 8, indicated by open circles). Standard deviations are indicated by vertical T-shaped bars on each column. P values were calculated using Student’s two-sample, two-tailed t test, assuming unequal variance: n.s., not significant, P > 0.05; *P ≤ 0.05; **P ≤ 0.01; ***P ≤ 0.001. Exact P values are presented in the Source Data file. G Overview of the preparation of mouse intestinal organoids, their growth in the presence of BMP signaling antagonists, and image analysis. G was created with BioRender.com released under a Creative Commons Attribution-NonCommercial-NoDerivs 4.0 International license https://creativecommons.org/licenses/by-nc-nd/4.0/deed.enH qPCR data shows that Bmp7 and Bmp2 are predominantly expressed by intestinal organoids, while Bmp4 is expressed at a lower level (n = 6, number of wells). CT value lower than 30 indicates notable protein expression. Data are presented in the form of a box plot, where: outer bounds (whiskers) indicate minima and maxima with 1.5 times the interquartile range, inner bounds indicate interquartile range (25th–75th percentile), and central line indicates 50th percentile (median) of data. Each qPCR reaction was carried out in duplicate and mean value is plotted. I Intestinal organoids grow poorly in the presence of Epidermal Growth Factor (EGF) plus R-Spondin-1 (agonist of the Wnt signaling pathway) (negative control, ER media), but (J) demonstrate enhanced growth, survival, and budding when EGF and R-Spondin-1 are supplemented with a BMP signaling antagonist Noggin (positive control, ENR medium). K Noggin could be replaced with TWSG1, suggesting that TWSG1 can function as a BMP antagonist in intestinal organoid cultures. L TWSG1 Ile40Glu does not bind to BMP ligands, does not act as a BMP antagonist, and does not support the growth of organoids. M Quantification of organoid number post third passage (n = 9, 11, 12, 12, 12; n = number of wells per condition). P values were calculated using Student’s t test, two-sample, two-tailed assuming unequal variance. ENR versus ER, ***P = 2.18 × 10−4; ER versus ER plus TWSG1, ***P = 1.39 × 10−4; ER versus ER plus TWSG1 Ile40Glu, n.s., P = 0.15; ER versus ER plus TWSG1 Ile40Ala, n.s., P = 0.067. n.s., not significant, P > 0.05. Data are presented in the form of a box plot, where: outer bounds (whiskers) indicate minima and maxima with 1.5 time the interquartile range, inner bounds indicate interquartile range (25th–75th percentile), and central line indicates 50th percentile (median) of data. N Macroscopic imaging of Matrigel domes indicated gross rescue of compromised organoid survival as a result of Bmp antagonist withdrawal across consecutive passages with TWSG1 supplementation, which was not recapitulated by mutant variants. Counts of imaged organoids are presented in M.
Fig. 4
Fig. 4. The mutation of Tsg Ile40 leads to a loss of BMP gradient formation in the Drosophila embryo.
A Cartoon of a lateral Drosophila embryo showing that dpp, tsg and tld genes are expressed in the dorsal ectoderm, whereas sog is expressed in the neuroectoderm. scw is ubiquitously expressed in the embryo. These extracellular proteins lead to a steep BMP activity gradient in the dorsal ectoderm in a wild-type embryo that activates the Race and ush target genes (middle cartoon: lateral view; bottom cartoon: dorsal view). In tsg mutants, BMP gradient formation is disrupted resulting in the loss of midline Race expression, and expansion of the ush expression domain (right hand cartoons). B (Top) Western blot showing the amount of Sog:Myc, Tsg:His and TsgI40E:His proteins co-immunoprecipitated with Dpp:HA–Scw:Flag heterodimers immobilized on anti-Flag matrix. Protein combinations are indicated in the key, Dpp:HA detection on the Flag matrix confirms immobilization of Dpp:HA–Scw:Flag heterodimers. (Bottom) Western blot shows the relative expression levels of wild-type and mutant Tsg proteins in the inputs. C Schematic of the CRISPR-Cas9 and homology-directed recombination strategy used to replace the tsg locus with an attP landing site and ΦC31-mediated reintegration of tsg rescue sequences. Dark blue regions indicate genomic sequences excised along with tsg coding sequences (light blue). An ALFA epitope tag is added to the Tsg C-terminus. D smFISH analysis of the Race and ush expression domains in wild-type and tsg mutant embryos at the onset of gastrulation (dorsal views). Nuclei are stained with DAPI in blue. Scale bars: 50 μm. E Race and ush smFISH staining in wild-type, tsg:ALFA and tsgI40:ALFA mutant embryos at the onset of gastrulation. Nuclei are stained with DAPI (blue), scale bars: 50 μm. F, G Graphs show quantification of the number of nuclei from the dorsal midline in the center of the embryo expressing Race (F) or ush (G) based on the data shown in D, E. n = 5, biologically independent animals/embryos. Error bars represent standard deviations. F One-way ANOVA, Šídák’s multiple comparisons test: ns, P > 0.05; ****, P ≤ 0.0001 (wild-type vs. tsg2 P = 2.9 × 10−14; wild-type vs tsgattP P = 2.9 × 10−14; wild-type vs tsg:ALFA P > 0.999; tsg:ALFA vs tsgI40A:ALFA P = 2.9 × 10−14; tsg:ALFA vs tsgI40E:ALFA P = 2.9 × 10−14). G One-way ANOVA, Šídák’s multiple comparisons test: ns, P > 0.05; ****, P ≤ 0.0001 (wild-type vs. tsg2 P < 1.0 × 10−15; wild-type vs tsgattP P < 1.0 × 10−15; wild type vs tsg:ALFA P > 0.999; tsg:ALFA vs tsgI40A:ALFA P = 1.0 × 10−15; tsg:ALFA vs tsgI40E:ALFA P = 2.0 × 10−15).
Fig. 5
Fig. 5. Model illustrating the inhibition of BMP signaling by TWSG1.
Dimeric BMP ligands assemble a complex that comprises two BMPR1 and two BMPR2 receptors to activate downstream signaling. The TWSG1 NTD occupies the BMPR1-binding site on BMP ligands and inhibits signaling by competing with BMPR1 for binding. The TWSG1 CTD interacts with members of the Chordin family, adding another layer to BMP–TWSG1 regulation. The dimeric nature of both the BMP ligand and TWSG1 (observed in structures and in solution) could lead to the oligomerization and clustering of the BMP–TWSG1 complex. Ternary signaling complexes were modeled based on the BMPR1A–BMP2–ActR2b structure (PDB ID 2H62), as well as the TWSG1 apo and TWSG1–GDF5 structures (this study).

References

    1. Wrana JL, Attisano L, Wieser R, Ventura F, Massagué J. Mechanism of activation of the TGF-β receptor. Nature. 1994;370:341–347. doi: 10.1038/370341a0. - DOI - PubMed
    1. Feng XH, Derynck R. Specificity and versatility in tgf-beta signaling through Smads. Annu Rev. Cell Dev. Biol. 2005;21:659–693. doi: 10.1146/annurev.cellbio.21.022404.142018. - DOI - PubMed
    1. Correns A, Zimmermann LA, Baldock C, Sengle G. BMP antagonists in tissue development and disease. Matrix Biol. 2021;11:100071. doi: 10.1016/j.mbplus.2021.100071. - DOI - PMC - PubMed
    1. Nolan K, et al. Structure of gremlin-2 in complex with GDF5 gives insight into DAN-family-mediated BMP antagonism. Cell Rep. 2016;16:2077–2086. doi: 10.1016/j.celrep.2016.07.046. - DOI - PMC - PubMed
    1. Groppe J, et al. Structural basis of BMP signalling inhibition by the cystine knot protein Noggin. Nature. 2002;420:636–642. doi: 10.1038/nature01245. - DOI - PubMed

MeSH terms

LinkOut - more resources