. 2024 Jun 11;15(1):4988.
doi: 10.1038/s41467-024-49282-1.

Immunological synapse formation between T regulatory cells and cancer-associated fibroblasts promotes tumour development

Affiliations

Immunological synapse formation between T regulatory cells and cancer-associated fibroblasts promotes tumour development

Athina Varveri et al. Nat Commun. .

Abstract

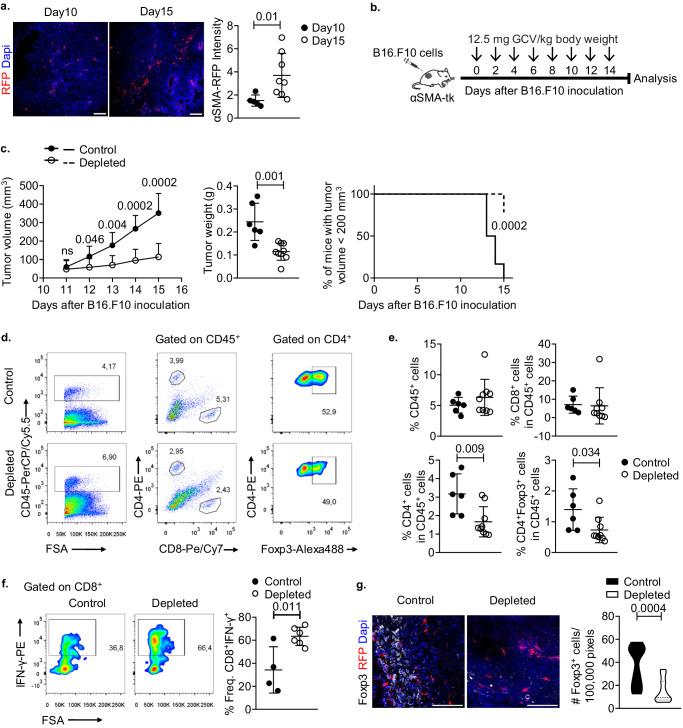
Cancer-associated fibroblasts (CAFs) have emerged as a dominant non-hematopoietic cell population in the tumour microenvironment, serving diverse functions in tumour progression. However, the mechanisms via which CAFs influence the anti-tumour immunity remain poorly understood. Here, using multiple tumour models and biopsies from cancer patients, we report that α-SMA+ CAFs can form immunological synapses with Foxp3+ regulatory T cells (Tregs) in tumours. Notably, α-SMA+ CAFs can phagocytose and process tumour antigens and exhibit a tolerogenic phenotype which instructs movement arrest, activation and proliferation in Tregs in an antigen-specific manner. Moreover, α-SMA+ CAFs display double-membrane structures resembling autophagosomes in their cytoplasm. Single-cell transcriptomic data showed an enrichment in autophagy and antigen processing/presentation pathways in α-SMA-expressing CAF clusters. Conditional knockout of Atg5 in α-SMA+ CAFs promoted inflammatory re-programming in CAFs, reduced Treg cell infiltration and attenuated tumour development. Overall, our findings reveal an immunosuppressive mechanism entailing the formation of synapses between α-SMA+ CAFs and Tregs in an autophagy-dependent manner.


Conflict of interest statement

The authors declare no competing interests.

Figures

Fig. 1
Fig. 1. Tumour regression upon partial depletion of α-SMA+ CAFs.
a Representative images of αSMARFP immunofluorescence and quantification plot of α-SMA intensity from Day10 (n = 2) and Day15 (n = 2) B16.F10 tumour cryosections. At least five fields per tumour were quantified. Scale bar: 100 μm. b Outline of Ganciclovir (GCV) treatment in tumour-bearing αSMA-tk+ mice. c Tumour volume (mm3), tumour weight (g) and percentage of mice bearing tumours <200 mm3 of B16.F10 inoculated PBS-treated (control, n = 6) and GCV-treated (depleted, n = 8) αSMA-tk+ mice. d and e Gating strategy (d), percentages (e) of intra-tumoral CD45+ cells, CD4+, CD8+ and CD4+Foxp3+ T cells on Day15 after B16.F10 inoculation of PBS-treated (control, n = 6) and GCV-treated (depleted, n = 9) αSMA-tk+ mice. f Representative FACS plots and percentages of IFN-γ+ cells of intra-tumoral CD8+ cells isolated on Day15 after B16.F10 inoculation of PBS-treated (control, n = 4) and GCV-treated (depleted, n = 6) αSMA-tk+ mice. g Representative images of αSMA-RFP, Foxp3 immunofluorescence from Day15 B16.F10 tumour cryosections derived from αSMA-tk;RFP mice. At least 5 fields per tumour were captured. Scale bar: 200 μm. Quantitation plots depicting number of Foxp3+ cells infiltrating Day15 B16.F10 tumours of PBS-treated (control, n = 3) and GCV-treated (depleted, n = 3) αSMA-tk;RFP mice. Data are shown as mean ± SD. Representative data from four (ce), three (f) and two (g) independent experiments are shown; 6–9 mice/group were used in each experiment for (ce) and 2–3 mice/group were used in each experiment for (g). Unpaired two-tailed t-test (c, eg), Mann-Whitney two-tailed U-test (a), two-tailed Log-rank test (c). n = biologically independent mouse samples. P values are as indicated in the respective graph. Source data are provided as a Source Data file.
Fig. 2
Fig. 2. Treg cells accumulate in α-SMA+ CAF-rich areas.
a Representative images of αSMA-RFP, Foxp3 immunofluorescence from Day15 B16.F10 (n = 3) or Lewis lung carcinoma (LLC) (n = 3) or MB49 (n = 3) tumour cryosections derived from αSMA-RFP mice. Violin plots depicting the number of Foxp3+ cells in CAF-rich and CAF-poor regions. Six fields or more per tumour were captured. Scale bars: 100, 25 μm (inset). b Representative images of α-SMA, Foxp3 immunohistochemistry in melanoma (n = 3) and colorectal cancer (CRC) (n = 15) sections, showing tumour areas and areas enriched in α-SMA+ CAFs. Violin plots depicting the number of Foxp3+ cells in tumour areas and areas enriched in α-SMA+ CAFs. Scale bars: 60.7, 20.3 μm (inset). Paired two-tailed t-test (a, b). n = biologically independent mouse samples (a); n = biologically independent donor samples (b). P values are as indicated in the respective graph. Source data are provided as a Source Data file.
Fig. 3
Fig. 3. α-SMA+ CAFs form synapses with Treg cells in an antigen-specific manner.
a Transmission electron microscopy image of isolated CAFs. Scale bar: 0.5 μm. b Violin plots representing contact duration between OTII Treg cells and CAFs in the absence or presence of OVA 323–339. c Representative trajectories of individual OTII Treg cells under co-culture conditions in the absence (left) or presence (right) of OVA 323–339. Scale bar: 0.65 µm. d Flow cytometry plots (left), percentages (right) of Ki-67+, CD25+Ki-67+, and CD44+Ki-67+ OTII Treg cells following co-culture with isolated CAFs and IL-2 in the absence (n = 4) or presence (n = 4) of OVA 323–339. e and f Representative maximum projections of 3D fluorescent confocal microscopic image stacks of CD45-CD31-EpCAM-α-SMA+ CAFs and OTII Tregs stained for actin, TCR and LFA-1α, in the presence of OVA 323–339 or stained for actin, TCR, and PD-1, in presence and absence of OVA323-339 after 15 min of co-culture. Scale bar: 1 µm. Quantification plots of TCR and PD-1 (mean fluorescence intensity, MFI) near the interface between Treg and CAF-extending actin-rich filopodia; interface MFI was normalized to mean intensity of each respective channel in the cell of interest (MFI percentage). Data are shown as mean ± SD. Representative data from four (bd) and one (e, f) independent experiments are shown; CAFs isolated from Day 15 tumours of 1 mouse were used in each experiment for (b, c) and CAFs from 2 to 4 mice were used in each experiment for (df). Unpaired two-tailed t-test (b, d), Mann–Whitney two-tailed U-test (f), n = biologically independent mouse samples. P values are as indicated in the respective graph. Source data are provided as a Source Data file.
Fig. 4
Fig. 4. Enrichment of autophagy and antigen processing/presentation pathways in α-SMA+ CAFs.
a Graph-based clustering of cells with uniform manifold approximation and projection (UMAP) was performed; 8 clusters were identified. b and c Violin plots demonstrating genes associated with GO: Antigen processing and presentation of peptide or polysaccharide antigen via MHC class II (b) and GO: Autophagy (c) for clusters 1, 2, 3, 5 identified from Grauel et al., Elyada et al. and Davidson et al. data. The width of the violin plot represents the frequency of cells. Values on the y-axis indicate normalized gene expression.
Fig. 5
Fig. 5. Conditional ablation of autophagy in α-SMA+ CAFs promotes tumour regression.
a Transmission electron microscopy images of CAFs isolated from Day15 B16.F10 melanomas. Scale bar: 500 or 200 nm, as indicated in the figure. b Autophagic flux assay. Representative images of immunofluorescence confocal microscopy for LC3 (red), LAMP-1 (green), p62 (silver white), and DAPI (blue) in NH4Cl-treated CAFs (n = 28) and vehicle-treated CAFs (n = 26). CAFs were isolated from Day15 B16.F10 melanomas. Scale bar: 12; 20 μm (inset). p62 puncta/cell and LC3 puncta/cell and are depicted. c Tumour volume (mm3), tumour weight (g) and percentage of mice bearing tumours <500 mm3 of B16.F10 inoculated Atg5fl/fl (n = 4) and αSMAcreAtg5fl/fl (n = 5). d Percentages of intra-tumoral CD4+ T cells and CD4+Foxp3+ T cells on Day15 after B16.F10 inoculation of Atg5fl/fl (n = 4) and αSMAcreAtg5fl/fl (n = 5) mice. e αSMA, Foxp3 immunofluorescence from Day15 B16.F10 tumour cryosections derived from control (n = 2) and αSMAcreAtg5fl/fl (n = 2) mice. At least 5 fields per tumour were captured. Quantitation plots depicting a number of Foxp3+ cells infiltrating Day15 B16.F10 tumours in CAF-poor and CAF-rich regions of control (n = 2) and αSMAcreAtg5fl/fl (n = 2) mice. Data are shown as mean ± SD. Representative data from one (a), two (e), three (b), five (c, d) independent experiments are shown; CAFs isolated from Day15 tumours of 3 mice were used in each experiment for (b), 4–8 mice/group were used in each experiment for (c, d) and 2 mice/group were used in each experiment for (e). Unpaired two-tailed t-test (bd), paired two-tailed t-test (e). ns = non-significant. n = number of CAFs counted (b); n = biologically independent mouse samples (ce). P values are as indicated in the respective graph. Source data are provided as a Source Data file.
Fig. 6
Fig. 6. Deficiency of autophagy reprograms α-SMA+ CAFs towards an “inflammatory” phenotype.
a Volcano plot showing distribution p-value (−log10 p-value) and fold change (log2 fold change) distribution of genes identified in CAFs isolated from αSMAcre (n = 2) and αSMAcreAtg5fl/fl (n = 2) mice. b Heatmap with scaled expression values (row z-score) of selected differentially expressed genes (DEGs) between αSMAcre (n = 2) and αSMAcreAtg5fl/fl (n = 2) mice. Gene names are depicted on the heatmap. For DEG analysis, the thresholds FDR < 0.05 and −1.5 < log2FC < 1.5 were used. c Bubble plot of enriched pathways determined from transcriptomic data. The size of the dot represents gene count, and the colour represents the p-value. d Gene set enrichment analysis (GSEA) plots showing the enrichment of “Phagocytosis” (NES 1.305275675, FDR 0.517387464), “mTOR signalling” (NES 1.372658556, FDR 0.288520886), “Cytokine production” (NES 1.279629696, FDR 0.000037360), “Positive regulation of MHC II biosynthetic process” (NES −0.816304866, FDR 0.028912909) gene sets. e Bubble plots of enriched pathways determined from proteomic data of CAFs lysates (left) and CAF supernatants (right, SNs). The size of the dot represents protein count, and the colour represents the −log10(p-value).
Fig. 7
Fig. 7. Autophagy deficiency in α-SMA+ CAFs potentiates ICI immunotherapy.
a Timeline of tumour progression following combinational administration of anti-PD-1 and anti-CTLA-4 in B16.F10 melanoma bearing C57BL/6 (control) and αSMAcreAtg5fl/fl mice. Mice were administered with dual ICI every 3 days after B16.F10 inoculation and were sacrificed on Day15. b Tumour volume (mm3), tumour weight (g) and percentage of mice bearing tumours <500 mm3 of B16.F10 inoculated PBS-treated C57BL/6 mice (n = 5), PBS-treated αSMAcreAtg5fl/fl mice (n = 6), anti-PD-1/anti-CTLA-4-treated C57BL/6 mice (n = 5), anti-PD-1/anti-CTLA-4-treated αSMAcreAtg5fl/fl mice (n = 6). Values in the table represent P-values between groups in Kaplan–Meier curves. c Percentages of intra-tumoral CD45+ cells, CD8+ T cells, CD4+Foxp3 T cells, CD4+Foxp3+ T cells, CD11c+ DCs and CD11b+GR-1+ MDSCs on Day15 after B16.F10 inoculation of PBS-treated C57BL/6 mice (n = 5), PBS-treated αSMAcreAtg5fl/fl mice (n = 6), anti-PD-1/anti-CTLA-4-treated C57BL/6 mice (n = 5), anti-PD-1/anti-CTLA-4-treated αSMAcreAtg5fl/fl mice (n = 6). Data are shown as mean ± SD. Representative data from three independent experiments are shown; 4–9 mice/group were used in each experiment. One-way ANOVA with Tukey’s multiple comparison tests (b, c); two-tailed Log-rank test (b). n = biologically independent mouse samples. P values are as indicated in the respective graph. Source data are provided as a Source Data file.

References

    1. Waldman AD, Fritz JM, Lenardo MJ. A guide to cancer immunotherapy: from T cell basic science to clinical practice. Nat. Rev. Immunol. 2020;20:651–668. doi: 10.1038/s41577-020-0306-5. - DOI - PMC - PubMed
    1. Bai R, et al. Mechanisms of cancer resistance to immunotherapy. Front. Oncol. 2020;10:1290. doi: 10.3389/fonc.2020.01290. - DOI - PMC - PubMed
    1. Hatziioannou A, Alissafi T, Verginis P. Myeloid-derived suppressor cells and T regulatory cells in tumors: unraveling the dark side of the force. J. Leukoc. Biol. 2017;102:407–421. doi: 10.1189/jlb.5VMR1116-493R. - DOI - PubMed
    1. Öhlund D, Elyada E, Tuveson D. Fibroblast heterogeneity in the cancer wound. J. Exp. Med. 2014;211:1503–1523. doi: 10.1084/jem.20140692. - DOI - PMC - PubMed
    1. Kalluri R. The biology and function of fibroblasts in cancer. Nat. Rev. Cancer. 2016;16:582–598. doi: 10.1038/nrc.2016.73. - DOI - PubMed

MeSH terms