. 2024 Jun 11;15(1):4963.
doi: 10.1038/s41467-024-49382-y.

Red2Flpe-SCON: a versatile, multicolor strategy for generating mosaic conditional knockout mice

Affiliations

Red2Flpe-SCON: a versatile, multicolor strategy for generating mosaic conditional knockout mice

Szu-Hsien Sam Wu et al. Nat Commun. .

Abstract

Image-based lineage tracing enables tissue turnover kinetics and lineage potentials of different adult cell populations to be investigated. Previously, we reported a genetic mouse model system, Red2Onco, which ectopically expressed mutated oncogenes together with red fluorescent proteins (RFP). This system enabled the expansion kinetics and neighboring effects of oncogenic clones to be dissected. We now report Red2Flpe-SCON: a mosaic knockout system that uses multicolor reporters to label both mutant and wild-type cells. We develop the Red2Flpe mouse line for red clone-specific Flpe expression, as well as the FRT-based SCON (Short Conditional IntrON) method to facilitate tunable conditional mosaic knockouts in mice. We use the Red2Flpe-SCON method to study Sox2 mutant clonal analysis in the esophageal epithelium of adult mice which reveal that the stem cell gene, Sox2, is less essential for adult stem cell maintenance itself, but rather for stem cell proliferation and differentiation.


Conflict of interest statement

S.W. and B.K.K. are inventors of a patent application on the SCON technology used in this study which was submitted by the Institute of Molecular Biotechnology to the European patent office (EP21172761) followed by a PCT application (WO2022/234086A1), entitled “Controlled gene expression methods and means”. The remaining authors declare no competing interests.

Figures

Fig. 1
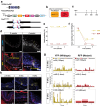
Fig. 1. Design of the Red2Flpe system: a mosaic knockout multicolor reporter allele.
a Upon Cre induction, each cell (unless it is polyploid) is adapted to express one fluorescent protein color. The cells labeled with red fluorescent protein (RFP) express the Flpe recombinase, while all the other fluorescent protein colors (green/yellow/cyan) correspond to wild-type cells. b Schematic showing the interactions between YFP+ wild-type cells (GeneXWT/WT) and RFP+ mutant cells (GeneX∆/∆) through paracrine signaling. As a result, the clonal competition between wild-type and mutant cells can be quantified. c Wholemount intestines of Tg(Vil-CreERT2); Red2Flpe; ApcFRT/FRT mice from 2 and 15 weeks after tamoxifen administration. The mutant RFP cells, through the secretion of paracrine factors, outcompete the surrounding wild-type cells. The experiment in c was performed in 3 separate Tg(Vil-CreERT2); Red2Flpe; ApcFRT/FRT mice for each time point and the representative images were taken. Scale bar, 50 μm.
Fig. 2
Fig. 2. Red2Flpe enables efficient red clone-specific recombination in vivo.
ad Small intestine samples harvested one week after treatment with tamoxifen (2 mg tamoxifen per 20 g body weight) from a Tg(Vil-CreERT2); Red2Flpe; ApcFRT/FRT mouse. The wild-type crypts labeled with either cyan (CFP), yellow (YFP), or no color show clear β-catenin staining in the membrane with less staining in the cytoplasm. The RFP-labeled (red) crypts display an increase in the cytoplasmic fraction of β-catenin staining — indicating successful knockout of Apc and malfunction of the β-catenin destruction complex. The RFP-labeled (red) crypts and the corresponding β-catenin staining are marked with dotted lines. The experiment in ad was performed in 3 separate Tg(Vil-CreERT2); Red2Flpe; ApcFRT/FRT mice the representative images were taken after antibody staining. Scale bar, 50 μm. eh, Small intestine samples harvested one week after treatment with tamoxifen (2 mg per 20 g body weight) from a Tg(Vil-CreERT2); Red2Flpe; Gt(ROSA)26Sortm1.2(CAG-EGFP)Fsh mouse. The expression of RFP (red) coincides with GFP (green) but does not coincide with Confetti YFP (yellow). RFP-GFP double positive cells are marked by the triangles and the YFP cells are marked by the arrows. The experiment in h was performed in 2 separate Tg(Vil-CreERT2); Red2Flpe; Gt(ROSA)26Sortm1.2(CAG-EGFP)Fsh mice the representative images were taken. i Gating strategy of YFP, RFP and CFP cells in tamoxifen-induced Tg(Vil-CreERT2); Red2Flpe intestine. j GFP+ cells within the gated CFP+ population (top row) or the gated RFP+ population (bottom row) in an FRT-based reporter (Tg(Vil-CreERT2); Red2Flpe; Gt(ROSA)26Sortm1.2(CAG-EGFP)Fsh) mouse harvested 5, 7 or 10 days post tamoxifen administration. k GFP+ cells in the control mouse (Tg(Vil-CreERT2); Red2Flpe) after tamoxifen administration. For each time point in i and j, the intestines from 2 mice of Tg(Vil-CreERT2); Red2Flpe; Gt(ROSA)26Sortm1.2(CAG-EGFP)Fsh and one control mouse of Tg(Vil-CreERT2); Red2Flpe were profiled and showed similar results.
Fig. 3
Fig. 3. SCON-FRT is a Flpe/FRT-based conditional knockout system.
a Schematic diagram of SCON-FRT in an eGFP overexpression construct, including eGFP, eG-SCON-FRT-FP and recombined eG-SC-FRT-FP. SD (splice donor), BP (branch point), SA (splice acceptor). b Brightfield and fluorescent images of HEK293T cells 24 h after transfection. c GFP fluorescence level of HEK293T cells 48 h after transfection. Red: intact eGFP; Blue: eG-SCON-FRT-FP; Orange: recombined eG-SC-FRT-FP. d GFP fluorescence level of HEK293T cells with integrated eG-SCON-FRT-FP before (blue) and after (orange) transfection of a Flp-expressing plasmid. Experiments in c and d were performed twice and in two separate cell clones, which showed similar results. Violin and box plots indicate the distribution of data where minimum and maximum values are presented. The boxplot represents the central 50% of data points and the thickened line marks the median value. Source Data relevant to this Figure are provided with this paper in Source Data file.
Fig. 4
Fig. 4. Red2Flpe is compatible with the SCON-FRT system in vitro.
a Schematic of the experimental set up that involves in integration of a piggybac-eG-SCON-FP vector into the Confetti or Red2Flpe embryonic stem cells. Upon Cre recombination, the RFP + GFP+ cells are sorted and cultured in puromycin-containing media. To assess the recombination, and the loss of GFP signals, puromycin was omitted from the media. b Schematic of the piggybac vector carrying the overexpression cassette of eG-SCON-FRT-FP coupled with puromycin resistance. Both eGFP and puromycin expression are reduced following Flp/FRT recombination. c Brightfield and fluorescent images of RFP+ Confetti and Red2Flpe ESCs with integrated eG-SCON-FRT-FP. The uninduced clone that retains eGFP expression is marked by an arrow. d GFP fluorescence level of Red2Flpe ESCs with integrated eG-SCON-FRT-FP after puromycin withdrawal. Gray: uninduced Red2Flpe; eG-SCON-FRT-FP cells; Red: RFP+ cells. Experiment shown in c and d was performed twice in two separate cell clones, which showed similar results.
Fig. 5
Fig. 5. Mosaic knockout of Sox2 reveals its role in the adult esophagus.
a Experimental set up for mosaic Sox2 knockout in an adult mouse esophagus using the Rosa-CreERT2; Red2Flpe; Sox2scon/scon strain. b Schematic of the genotype of YFP and RFP cells after Cre administration. c A single dose of 3 mg tamoxifen was injected and the esophagus samples were then harvested on days 17, 28 and 63 after the injection. d Sox2 staining in esophageal sections at 2- and 4-weeks post-induction. The YFP and RFP clones are marked by dashed lines. Scale bar, 20 μm. e, f Quantification of Sox2+ cells and number of YFP+ and RFP+ cells per field of 100 μm at 2.4-, 4- and 9-weeks post-induction. g Quantification of spatial distribution of YFP+ and RFP+ clones at 2.4-, 4- and 9-weeks post-induction. h Representative images of YFP+ and RFP+ clones at 2.4-, 4- and 9-weeks post-induction. The YFP+ and RFP+ clones are marked by dashed lines. Experiments in ch were performed in two mice for each time point, in which multiple fields of sectioned esophagus were imaged and quantified. Scale bar, 20 μm. Source Data relevant to this Figure are provided with this paper in Source Data file.

Similar articles

Cited by

References

    1. Lee-Six H, et al. Population dynamics of normal human blood inferred from somatic mutations. Nature. 2018;561:473–478. doi: 10.1038/s41586-018-0497-0. - DOI - PMC - PubMed
    1. Martincorena I, et al. Somatic mutant clones colonize the human esophagus with age. Science. 2018;362:911–917. doi: 10.1126/science.aau3879. - DOI - PMC - PubMed
    1. Martincorena I, et al. Tumor evolution. High burden and pervasive positive selection of somatic mutations in normal human skin. Science. 2015;348:880–886. doi: 10.1126/science.aaa6806. - DOI - PMC - PubMed
    1. Colom B, et al. Mutant clones in normal epithelium outcompete and eliminate emerging tumours. Nature. 2021;598:510–514. doi: 10.1038/s41586-021-03965-7. - DOI - PMC - PubMed
    1. Colozza G, Park SY, Koo BK. Clone wars: From molecules to cell competition in intestinal stem cell homeostasis and disease. Exp. Mol. Med. 2022;54:1367–1378. doi: 10.1038/s12276-022-00854-5. - DOI - PMC - PubMed