. 2024 Jun 11;15(1):4962.
doi: 10.1038/s41467-024-49370-2.

Acetylation of histones and non-histone proteins is not a mere consequence of ongoing transcription

Affiliations

Acetylation of histones and non-histone proteins is not a mere consequence of ongoing transcription

Tim Liebner et al. Nat Commun. .

Abstract

In all eukaryotes, acetylation of histone lysine residues correlates with transcription activation. Whether histone acetylation is a cause or consequence of transcription is debated. One model suggests that transcription promotes the recruitment and/or activation of acetyltransferases, and histone acetylation occurs as a consequence of ongoing transcription. However, the extent to which transcription shapes the global protein acetylation landscapes is not known. Here, we show that global protein acetylation remains virtually unaltered after acute transcription inhibition. Transcription inhibition ablates the co-transcriptionally occurring ubiquitylation of H2BK120 but does not reduce histone acetylation. The combined inhibition of transcription and CBP/p300 further demonstrates that acetyltransferases remain active and continue to acetylate histones independently of transcription. Together, these results show that histone acetylation is not a mere consequence of transcription; acetyltransferase recruitment and activation are uncoupled from the act of transcription, and histone and non-histone protein acetylation are sustained in the absence of ongoing transcription.


Conflict of interest statement

The authors declare no competing interests.

Figures

Fig. 1
Fig. 1. The strategy and summary of global acetylome analysis after acute transcription inhibition.
a SILAC based proteomics workflow to quantify lysine acetylation sites. b Venn diagram showing the overlap between acetylation sites quantified in after treatment with ActD (1 µg/mL) and NVP-2 (100 nM). Cells were treated with the indicated inhibitors for 2 h and acetylation changes quantified as shown in schematic (a). c Shown is the number of biological replicates in which acetylation sites were quantified. A total of 6 biological replicates were performed.
Fig. 2
Fig. 2. Acetylation is not impaired by acute transcription inhibition but reduced after CBP/p300 inhibition.
a Shown is the change in acetylation site abundance after the treatment ActD and NVP-2 and MS intensity of the acetylated peptides. The cells were treated with ActD (1 µg/mL) and NVP-2 (100 nM) for 2 h, and change in acetylation was quantified by SILAC-based MS. The number (n) of acetylation sites quantified and the fraction of sites showing ≥ 2-fold down- or up-regulation is indicated. The dotted line indicates ≥ 2-fold up- or downregulation. b Correlation between acetylation site changes after treatment with ActD and NVP-2. The dotted line indicates ≥ 2-fold up- or downregulation. The number (n) of overlapping acetylation sites quantified in both conditions, Pearson’s correlation (r), the corresponding p-value (P) from a two-sided test and the fraction of sites showing ≥2-fold down- or up-regulation in both conditions is indicated. c Shown is the change in acetylation site abundance after the treatment with Trp (500 nM) and MS intensity of the acetylated peptides. d Correlation between acetylation site changes after treatment with ActD and Trp (left panel) and NVP-2 and Trp (right panel). The dotted line indicates ≥ 2-fold up- or downregulation. The number (n) of overlapping acetylation sites quantified in both conditions, Pearson’s correlation (r), the corresponding p-value (P) from a two-sided test and the fraction of sites showing ≥ 2-fold down- or up-regulation in the conditions is indicated. e Shown is the change in acetylation site abundance in mouse embryonic fibroblasts treated with CBP/p300 inhibitor A-485 for the indicated time. The number (n) of acetylation sites quantified and the fraction of sites showing ≥ 2-fold down- or up-regulation is indicated. The shown data are re-analyzed from Weinert et al..
Fig. 3
Fig. 3. Acetylation of core histones is site-selectively reduced after CBP/p300 inhibition, but remains unaltered after acute transcription inhibition.
a, b Acetylation sites on core-histones quantified in this study (a), and in A485-treated MEF cells from Weinert et al.. (b). Bar plots show distribution of the data. Bars show the mean log2 acetylation site ratio of sites occurring in the indicated core-histones. Data points for each replicate are shown and error bars indicate the standard error of the mean. For ActD and NVP-2 experiments six biological replicates (n = 6) were used. The study of Weinert et al. used three biological replicates (n = 3).
Fig. 4
Fig. 4. Transcription inhibition and CBP/p300 inhibition differently impair H2BK120ub and histone acetylation.
a Representative micrographs of mouse embryonic stem cells treated with CBP/p300 inhibitor A-485 or the indicated transcription inhibitors (concentrations: A-485 10 µM, ActD 1 µg/mL, Trp 5 µM, NVP-2 1 µM). Cells were treated with the indicated inhibitors for 2 h, stained with the indicated histone marks, and analyzed by immunofluorescence. Scale bar is 10 µm. b, c Quantification of change in H2BK120ub (b) and H3K27ac (c) after the indicated treatments, in 6000 automatically selected cells per condition and staining. Median nuclear staining intensity relative to the DMSO control for the different combinations of treatments and staining as determined from image-based cytometry analysis of 6000 cells per combination. The dotted line indicates the median intensity of the DMSO treated cells. Violin plots show the distribution of the data, and the box represent the 25th and 75th percentiles as lower and upper hinges, with the bar within box indicates median. The whiskers show 1.5 × IQR.
Fig. 5
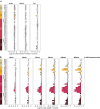
Fig. 5. Acute transcription inhibition leaves genes carrying H3K27ac mark unaltered.
a Percentage of active and inactive genes promoters marked by H3K27ac. Active promoters (±1 kb from the TSS) are defined as those mapping to genes expressed in mESCs (5-ethynyluridine (EU) RNA sequencing (RNA-seq) transcripts per million (TPM) > 2) and marked with H3K4me3, while inactive promoters are defined as promoters that do not meet the criteria for active promoters. b Shown are average profiles of H3K27ac spike-in normalized read counts in control and transcription inhibited mESCs at different genomic regions. Cells were treated for 2 h (ActD 1 µg/mL or NVP-2 1 µM). Active and inactive promoters are defined as described in Fig. 5a. Other genomic regions were classified as the following categories: all, all peaks; gene body, peaks occurring within gene bodies; gene bodies; intergenic, peaks occurring outside promoters and gene bodies. Promoter peaks are shown in dependence of the transcription-start-site (TSS). Gene body and intergenic peaks are shown relative to the proximal ATAC peak summit. c Relative fold change of H3K27ac site ChIP normalized read counts in mESC treated with NVP2 or ActD. Counts were either normalized to a spike-in or reads per kilobase million (RPKM). The dotted lines indicate a fold-change of 0. Violin plots show the distribution of the data, and the box represent the 25th and 75th percentiles as lower and upper hinges, with the bar within box indicates median. The whiskers show 1.5 × IQR. All the ChIP-seq experiments were performed with 2 biological replicates.

References

    1. Allfrey VG, Faulkner R, Mirsky AE. Acetylation and methylation of histones and their possible role in the regulation of Rna synthesis. Proc. Natl Acad. Sci. USA. 1964;51:786–794. doi: 10.1073/pnas.51.5.786. - DOI - PMC - PubMed
    1. Kim SC, et al. Substrate and functional diversity of lysine acetylation revealed by a proteomics survey. Mol. Cell. 2006;23:607–618. doi: 10.1016/j.molcel.2006.06.026. - DOI - PubMed
    1. Choudhary C, et al. Lysine acetylation targets protein complexes and co-regulates major cellular functions. Science. 2009;325:834–840. doi: 10.1126/science.1175371. - DOI - PubMed
    1. Choudhary C, Weinert BT, Nishida Y, Verdin E, Mann M. The growing landscape of lysine acetylation links metabolism and cell signalling. Nat. Rev. Mol. Cell Biol. 2014;15:536–550. doi: 10.1038/nrm3841. - DOI - PubMed
    1. Ali I, Conrad RJ, Verdin E, Ott M. Lysine acetylation goes global: from epigenetics to metabolism and therapeutics. Chem. Rev. 2018;118:1216–1252. doi: 10.1021/acs.chemrev.7b00181. - DOI - PMC - PubMed