

Near-field microwave sensing technology enhanced with machine learning for the non-destructive evaluation of packaged food and beverage products
- PMID: 38862556
- PMCID: PMC11167027
- DOI: 10.1038/s41598-024-62287-6
Near-field microwave sensing technology enhanced with machine learning for the non-destructive evaluation of packaged food and beverage products
Abstract
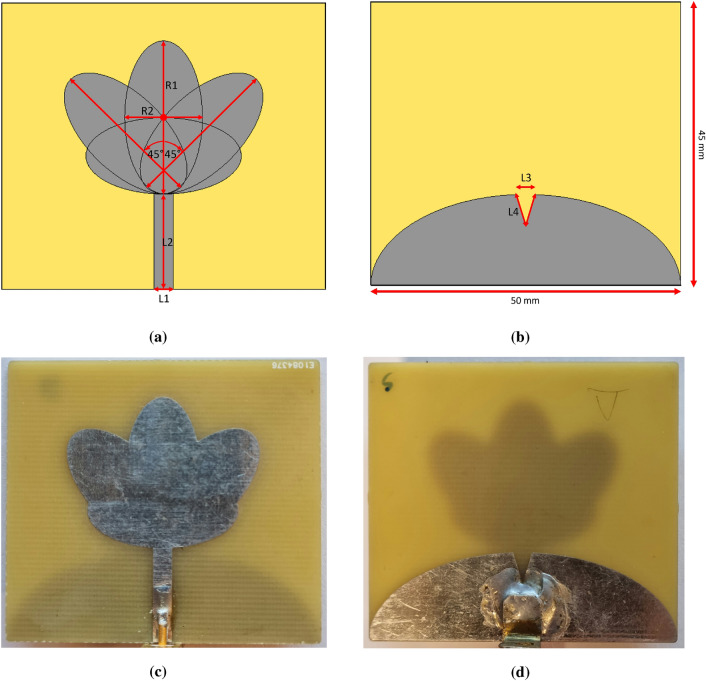
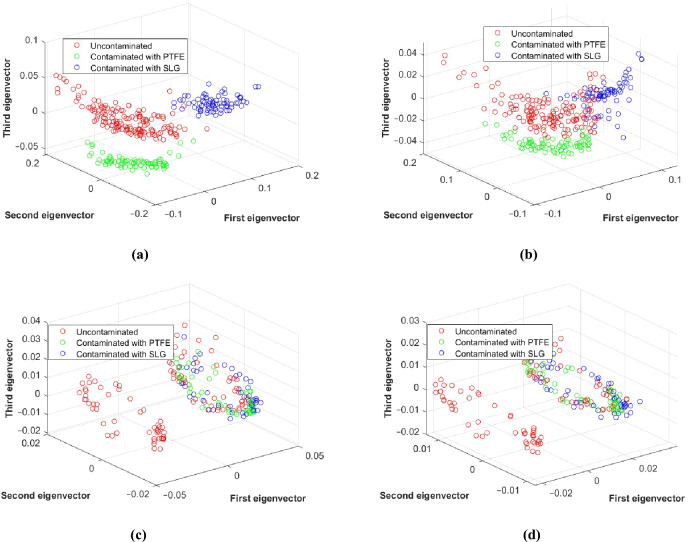
In the food industry, the increasing use of automatic processes in the production line is contributing to the higher probability of finding contaminants inside food packages. Detecting these contaminants before sending the products to market has become a critical necessity. This paper presents a pioneering real-time system for detecting contaminants within food and beverage products by integrating microwave (MW) sensing technology with machine learning (ML) tools. Considering the prevalence of water and oil as primary components in many food and beverage items, the proposed technique is applied to both media. The approach involves a thorough examination of the MW sensing system, from selecting appropriate frequency bands to characterizing the antenna in its near-field region. The process culminates in the collection of scattering parameters to create the datasets, followed by classification using the Support Vector Machine (SVM) learning algorithm. Binary and multiclass classifications are performed on two types of datasets, including those with complex numbers and amplitude data only. High accuracy is achieved for both water-based and oil-based products.
Keywords: Antenna; Electromagnetic modeling; Machine learning; Microwave sensing; Near-field sensing; Non-destructive technique.
© 2024. The Author(s).
Conflict of interest statement
The authors declare no competing interests.
Figures


Similar articles
-
An Innovative Machine Learning Approach to Predict the Dietary Fiber Content of Packaged Foods.Nutrients. 2021 Sep 14;13(9):3195. doi: 10.3390/nu13093195. Nutrients. 2021. PMID: 34579072 Free PMC article.
-
Food for Thought: Optical Sensor Arrays and Machine Learning for the Food and Beverage Industry.ACS Sens. 2024 Apr 26;9(4):1656-1665. doi: 10.1021/acssensors.4c00252. Epub 2024 Apr 10. ACS Sens. 2024. PMID: 38598846 Free PMC article. Review.
-
Microwave Digital Twin Prototype for Shoulder Injury Detection.Sensors (Basel). 2024 Oct 16;24(20):6663. doi: 10.3390/s24206663. Sensors (Basel). 2024. PMID: 39460143 Free PMC article.
-
Early Detection of Alzheimer's Disease via Machine Learning-Based Microwave Sensing: An Experimental Validation.Sensors (Basel). 2025 Apr 25;25(9):2718. doi: 10.3390/s25092718. Sensors (Basel). 2025. PMID: 40363158 Free PMC article.
-
Emerging non-invasive microwave and millimeter-wave imaging technologies for food inspection.Crit Rev Food Sci Nutr. 2025;65(17):3302-3313. doi: 10.1080/10408398.2024.2364225. Epub 2024 Jul 1. Crit Rev Food Sci Nutr. 2025. PMID: 38950576 Review.
References
-
- Haff R, Toyofuku N. X-ray detection of defects and contaminants in the food industry. Sens. Instrum. Food Qual. Saf. 2008 doi: 10.1007/s11694-008-9059-8. - DOI
-
- Liu, B. & Zhou, W. The research of metal detectors using in food industry. In Proceedings of 2011 International Conference on Electronics and Optoelectronics. 43–45 (2011).
-
- Wang W, Paliwal J. Near-infrared spectroscopy and imaging in food quality and safety. Sens. Instrum. Food Qual. Saf. 2007;1:193–207. doi: 10.1007/s11694-007-9022-0. - DOI
-
- Gowen AA, O’Sullivan C, O’Donnell C. Terahertz time domain spectroscopy and imaging: Emerging techniques for food process monitoring and quality control. Trends Food Sci. Technol. 2012;25:40–46. doi: 10.1016/j.tifs.2011.12.006. - DOI
MeSH terms
Grants and funding
LinkOut - more resources
Full Text Sources
