. 2024 Jun 11;14(1):13098.
doi: 10.1038/s41598-024-57948-5.

Aging and putative frailty biomarkers are altered by spaceflight

Affiliations

Aging and putative frailty biomarkers are altered by spaceflight

Andrea Camera et al. Sci Rep. .

Abstract

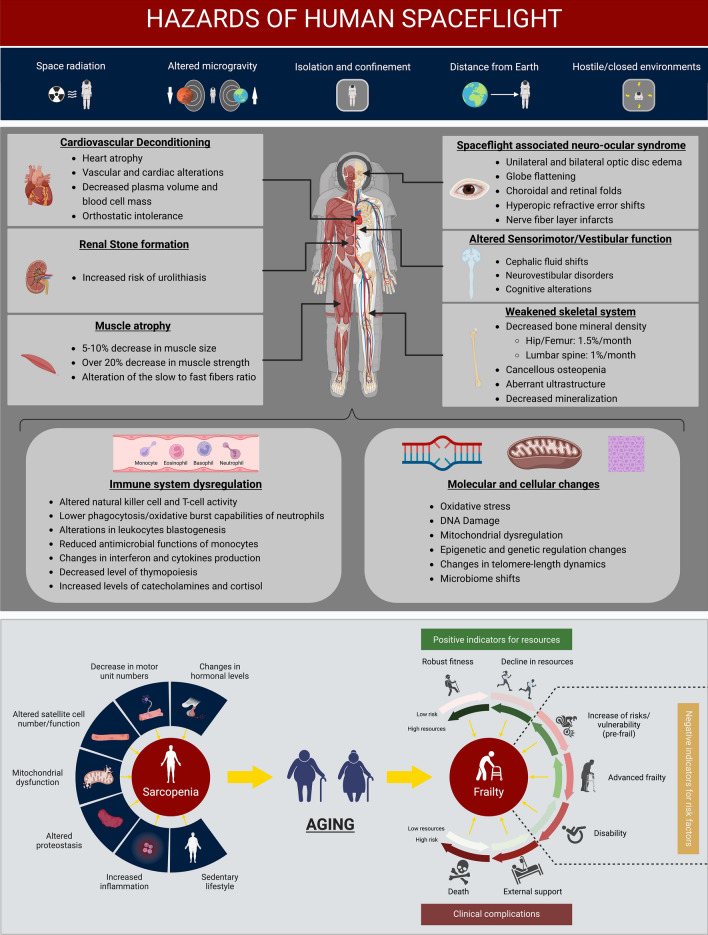
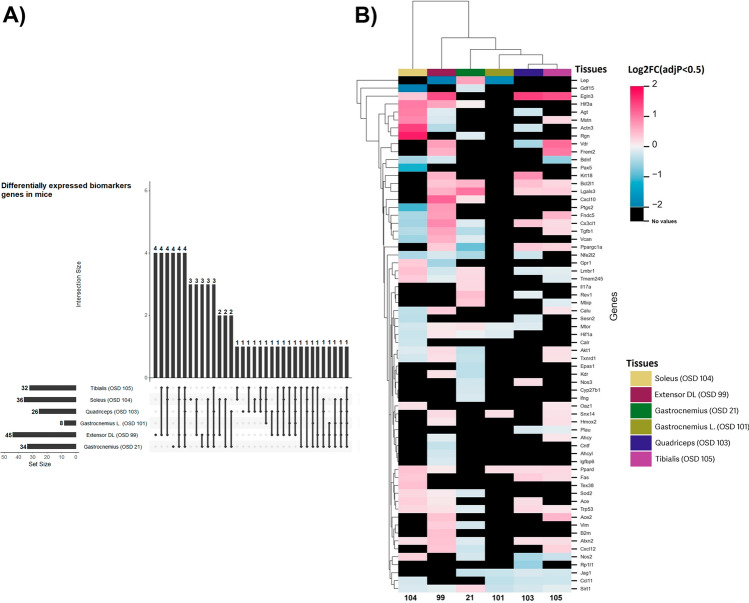
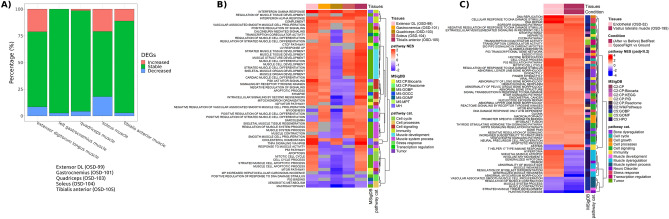
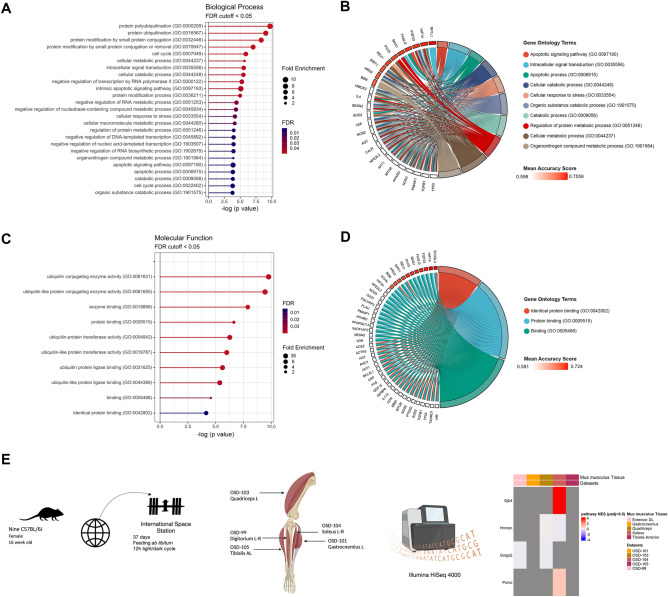
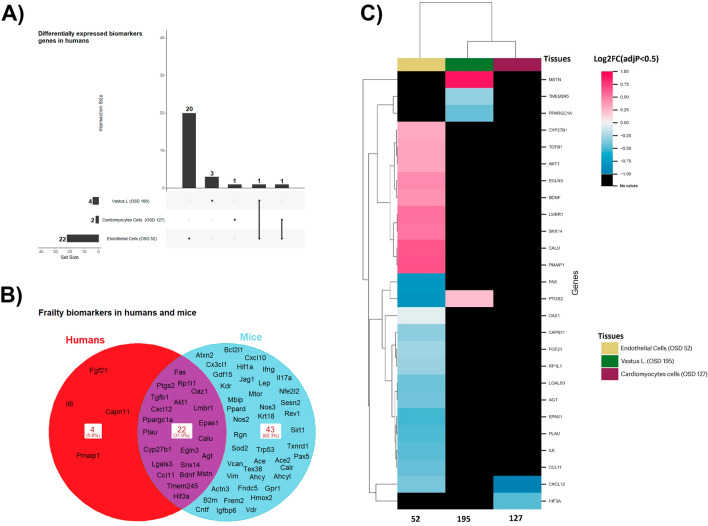
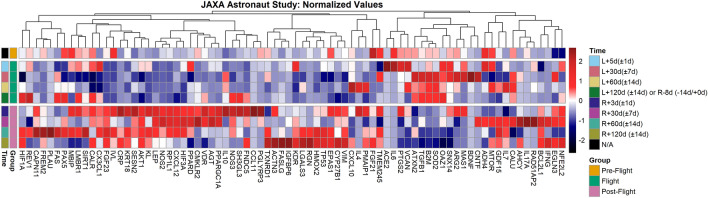
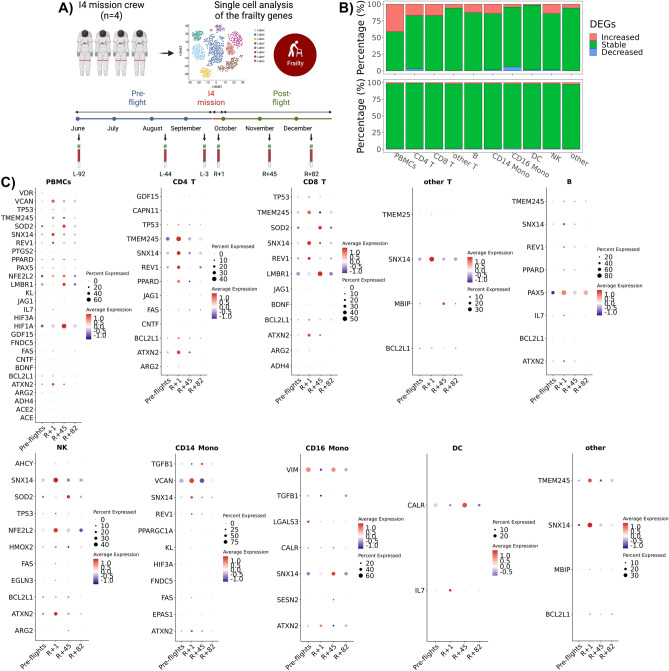
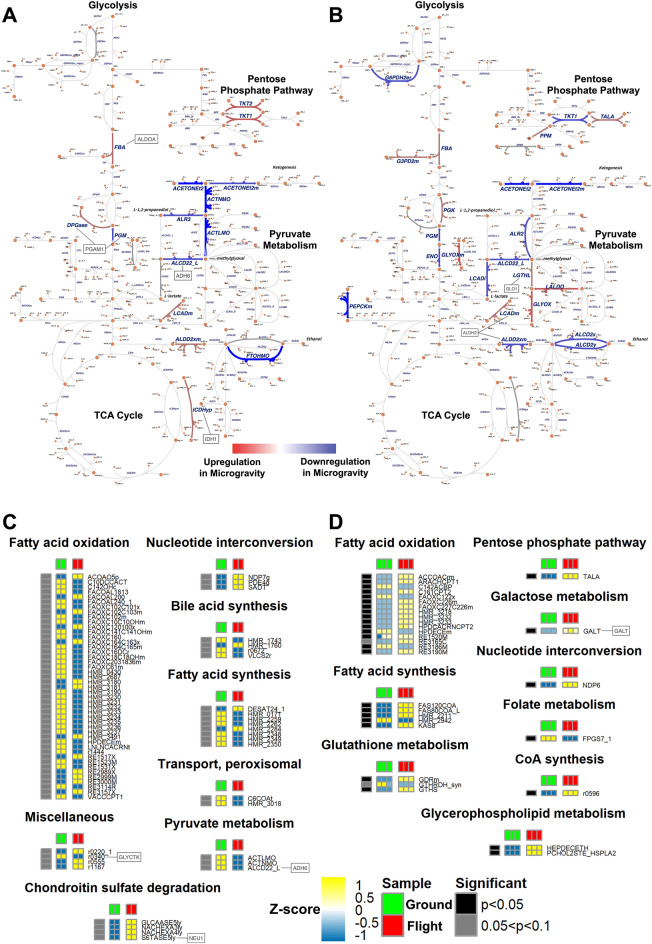
Human space exploration poses inherent risks to astronauts' health, leading to molecular changes that can significantly impact their well-being. These alterations encompass genomic instability, mitochondrial dysfunction, increased inflammation, homeostatic dysregulation, and various epigenomic changes. Remarkably, these changes bear similarities to those observed during the aging process on Earth. However, our understanding of the connection between these molecular shifts and disease development in space remains limited. Frailty syndrome, a clinical syndrome associated with biological aging, has not been comprehensively investigated during spaceflight. To bridge this knowledge gap, we leveraged murine data obtained from NASA's GeneLab, along with astronaut data gathered from the JAXA and Inspiration4 missions. Our objective was to assess the presence of biological markers and pathways related to frailty, aging, and sarcopenia within the spaceflight context. Through our analysis, we identified notable changes in gene expression patterns that may be indicative of the development of a frailty-like condition during space missions. These findings suggest that the parallels between spaceflight and the aging process may extend to encompass frailty as well. Consequently, further investigations exploring the utility of a frailty index in monitoring astronaut health appear to be warranted.


Conflict of interest statement

The authors declare no competing interests.

Figures

Figure 1
Figure 1
Effects of spaceflight and a model of aging. Human spaceflight presents five major challenges: space radiation, altered gravity, isolation and confinement, distance from Earth, and hostile/closed environments are hazards for crewed spaceflight. These stressors support pathophysiological alterations and cellular and molecular changes which could be involved in the development of biological aging and frailty in astronauts. Muscle loss in astronauts has a similar pathophysiology as sarcopenia in the elderly. Created using BioRender.
Figure 2
Figure 2
Frailty-related biomarkers are differentially expressed in rodent muscles during spaceflight. Putative frailty linked genes from NASA Open Science Data Repository (former GeneLab). The transcriptomic signature of spaceflight is investigated with differential expression analysis in multiple tissues. (A) Upset plots of overlapping differentially expressed frailty genes in rodent and human samples. (B) Heatmap of differential expression analysis for the frailty gene in human and rodent samples. Rodent samples comprise spaceflight skeletal muscle. Heatmap considers only DEG with adjusted p-value < 0.5. Black color indicates no value.
Figure 3
Figure 3
Inflammatory response pathways are enriched in rodent muscles during spaceflight. The transcriptomic signature of spaceflight is investigated with gene set enrichment analysis (GSEA) for putative aging-related pathways in multiple tissues. (A) Percentage of the differentially expressed genes which are stable, increased or decreased in rodent samples. (B) and (C) Heatmap of the normalized enrichment score for the enriched aging-related pathways in rodents and human samples. The dark gray locations in the heatmap indicate missing values for the NES, resulting from off-range adjusted p-values (padj) of the analysis. The assumed range is padj < 0.3.
Figure 4
Figure 4
Evidence of shared catabolic pathways between sarcopenia and frailty markers and their differential expression in space-flown mice. (A) Significantly enriched Biological Processes using a curated biomarker gene list obtained by the overlap of three gene sets studying sarcopenia (superseries GSE111017: GSE111006, GSE111010, and GSE111016) defined through a Mann- Whitney analysis. (B) The frailty biomarkers found to be part of ten GO Biological Processes terms, from which R1PL1 had the highest Mean Accuracy Score (MAS) score. (C) Significantly enriched Molecular Functions using a curated biomarker gene list. (D) Similarly, three GO Molecular Function terms were found to be a shared pathway with the defined frailty biomarkers from which SH3GL3 had the highest MAS score. (E) Schematic of the data utilized for the heatmap showing the four genes out of the 21 sarcopenia frailty genes that were present in the murine data sets. Heatmap considers only DEG with p < 0.05.
Figure 5
Figure 5
Frailty-related biomarkers are differentially expressed in humans during spaceflight and ground-based spaceflight simulated conditions. Putative frailty linked genes from NASA Open Science Data Repository (former GeneLab). The transcriptomic signature of spaceflight is investigated with differential expression analysis in multiple tissues. (A) Upset plot of overlapping differentially expressed frailty genes in human samples. (B) Venn diagram of differentially expressed frailty genes in rodent and human samples shows the common differentially expressed genes between the two species. (C) Heatmap of differential expression analysis for the frailty gene in human samples. Human samples comprise spaceflight human umbilical vein endothelial cells, bed rest skeletal muscle cells and cardiac progenitors differentiated from human pluripotent stem cells in 3D culture under simulated microgravity. Heatmap considers only DEG with adjusted p-value < 0.5. Black color indicates no value.
Figure 6
Figure 6
Frailty-related biomarkers are differentially expressed in astronauts exposed to 120-days of Low Earth Orbit Spaceflight. Putative frailty linked genes from JAXA Cell-Free Epigenome (CFE). Heatmap of the normalized plasma cell-free RNA expression values for the frailty genes over time for the six astronauts over 120 days in space from JAXA study. The values shown are the averaged normalized expression values for all six astronauts for each time point during flight and post-flight. The three pre-flight time points were averaged together, since the changes for genes in the time leading up to flight are considered to be the same and part of the baseline values. For the time, L = Launch (i.e., meaning time after launch from Earth and the number indicates length in space) and R = Return to Earth.
Figure 7
Figure 7
Frailty-related biomarkers are differentially expressed in astronauts exposed to 3-days of Low Earth Orbit Spaceflight. Frailty linked genes from Inspiration4 (i4) human peripheral blood mononuclear cells (PBMCs). (A) Schematic of the i4 experiments and the samples utilized for this analysis. (B) The overall percentage of up (i.e., increased), down (i.e., decreased), and no change (i.e., stable) expressed frailty genes in the i4 data (top plot) compared the overall gene distribution (bottom plot). (C) Dot plot of the single cell RNA expression for the frailty genes over time for the 4 astronauts over 3 days in space from the i4 civilian crew mission. The image shows the differential expression values for each cell type in analysis. The values are based on expression for each time point before-flight and post-flight. However, data from samples collected just after reentry (R + 1) is considered spaceflight condition. For the time, L = Launch, R = Return to Earth, the number + n is the time (in days) after L or R.
Figure 8
Figure 8
Metabolic flux simulation analysis on OSD-91 and OSD-127. (A) and (B) Overview of carbohydrate metabolism illustrated by custom-made Escher [81] for OSD-91 and OSD-127, respectively. The associated pathways (i.e., TCA Cycle, Glycolysis, Pentose phosphate pathway, Pyruvate metabolism) whose metabolic reactions with relative activations are demonstrated. The red color presents the upregulated metabolic fluxes in flight and the blue color represents the downregulated fluxes. (C) and (D) Heatmaps showing relative metabolic flux rates (rows) versus human samples (columns) for OSD-91 and OSD-127, respectively. Only particular pathways demonstrating significant alteration of metabolic flux rates are listed, where the blue to yellow heatmap color scales indicate row-wise Z-scores for those flux rates. The leftmost bar represents differential testing results between Flight and Ground in p values < 0.05 (black) or p values between 0.05 and 0.1 (gray) through the Van Der Waerden test. Genes in the boxes are enzymes showing significantly different expressions for their corresponding reactions.

Similar articles

Cited by

References

    1. Patel ZS, Brunstetter TJ, Tarver WJ, et al. Red risks for a journey to the red planet: The highest priority human health risks for a mission to Mars. NPJ Microgravity. 2020;6(1):33. doi: 10.1038/s41526-020-00124-6. - DOI - PMC - PubMed
    1. Patel S. The effects of microgravity and space radiation on cardiovascular health: From low-Earth orbit and beyond. IJC Heart Vasc. 2020;30:100595. doi: 10.1016/j.ijcha.2020.100595. - DOI - PMC - PubMed
    1. Afshinnekoo E, Scott RT, MacKay MJ, et al. Fundamental biological features of spaceflight: Advancing the field to enable deep-space exploration. Cell. 2021;184(24):6002. doi: 10.1016/j.cell.2021.11.008. - DOI - PMC - PubMed
    1. Roy-O’Reilly M, Mulavara A, Williams T. A review of alterations to the brain during spaceflight and the potential relevance to crew in long-duration space exploration. NPJ Microgravity. 2021;7(1):5. doi: 10.1038/s41526-021-00133-z. - DOI - PMC - PubMed
    1. Deák P, Udvarhelyi P, Thiering G, Gali A. The kinetics of carbon pair formation in silicon prohibits reaching thermal equilibrium. Nat. Commun. 2023;14(1):361. doi: 10.1038/s41467-023-36090-2. - DOI - PMC - PubMed