

Agent-based modeling to estimate the impact of lockdown scenarios and events on a pandemic exemplified on SARS-CoV-2
- PMID: 38862580
- PMCID: PMC11167020
- DOI: 10.1038/s41598-024-63795-1
Agent-based modeling to estimate the impact of lockdown scenarios and events on a pandemic exemplified on SARS-CoV-2
Abstract
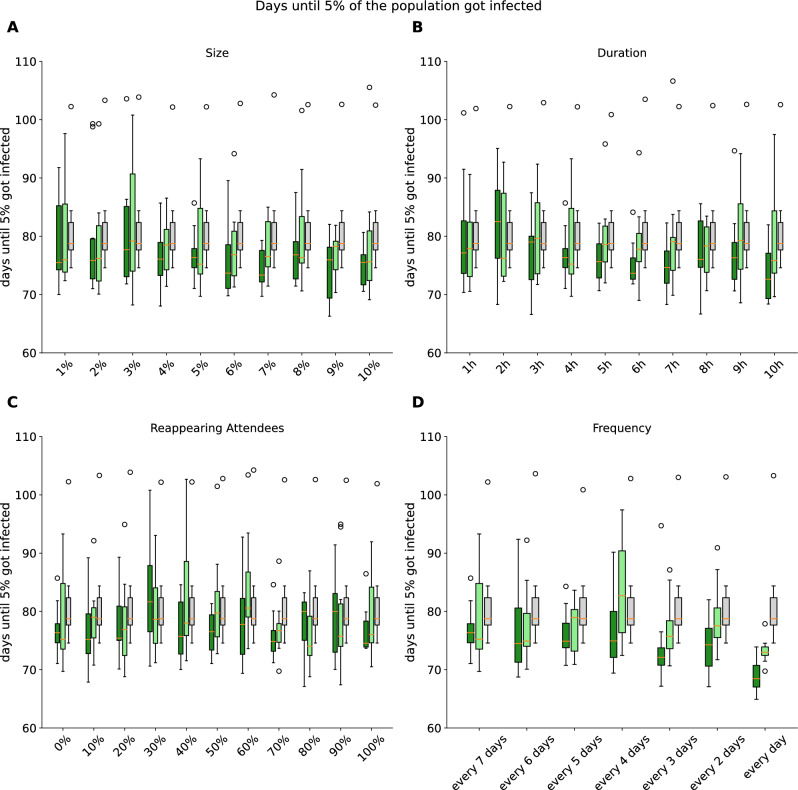
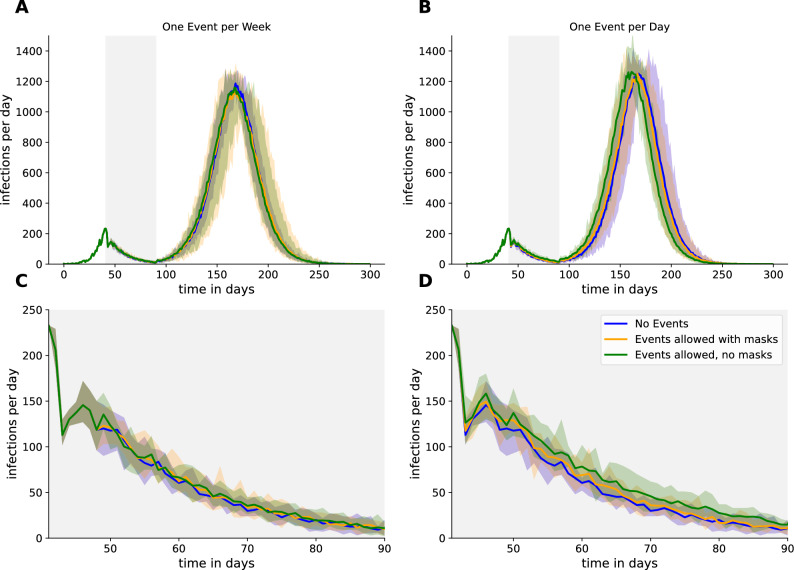
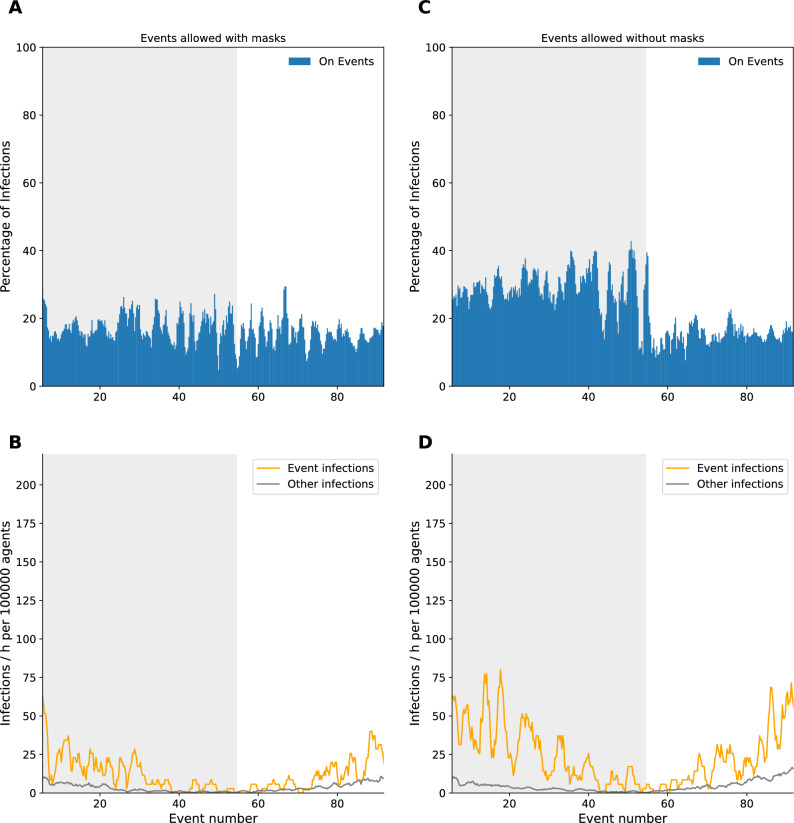
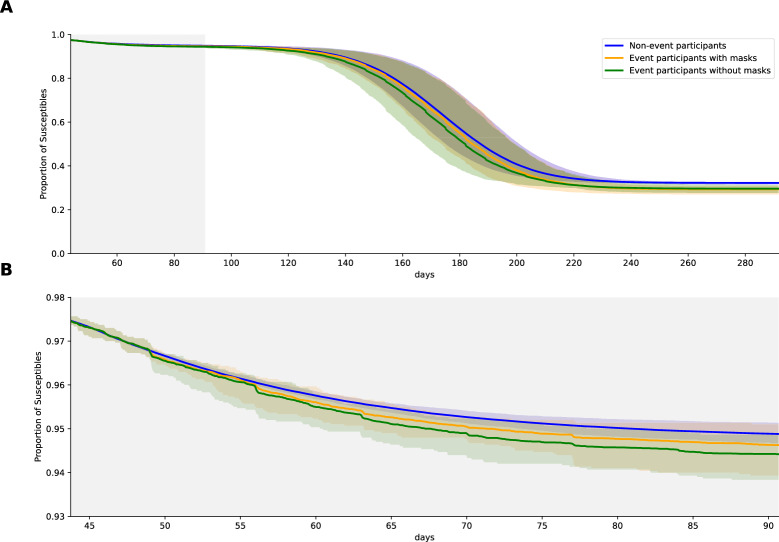
In actual pandemic situations like COVID-19, it is important to understand the influence of single mitigation measures as well as combinations to create most dynamic impact for lockdown scenarios. Therefore we created an agent-based model (ABM) to simulate the spread of SARS-CoV-2 in an abstract city model with several types of places and agents. In comparison to infection numbers in Germany our ABM could be shown to behave similarly during the first wave. In our model, we implemented the possibility to test the effectiveness of mitigation measures and lockdown scenarios on the course of the pandemic. In this context, we focused on parameters of local events as possible mitigation measures and ran simulations, including varying size, duration, frequency and the proportion of events. The majority of changes to single event parameters, with the exception of frequency, showed only a small influence on the overall course of the pandemic. By applying different lockdown scenarios in our simulations, we could observe drastic changes in the number of infections per day. Depending on the lockdown strategy, we even observed a delayed peak in infection numbers of the second wave. As an advantage of the developed ABM, it is possible to analyze the individual risk of single agents during the pandemic. In contrast to standard or adjusted ODEs, we observed a 21% (with masks) / 48% (without masks) increased risk for single reappearing participants on local events, with a linearly increasing risk based on the length of the events.
Keywords: Agent-based modeling; COVID-19; Individual transfection risk; Lockdown scenarios; Mitigation measure simulation; SARS-CoV-2.
© 2024. The Author(s).
Conflict of interest statement
The authors declare no competing interests.
Figures


Similar articles
-
Could masks curtail the post-lockdown resurgence of COVID-19 in the US?Math Biosci. 2020 Nov;329:108452. doi: 10.1016/j.mbs.2020.108452. Epub 2020 Aug 18. Math Biosci. 2020. PMID: 32818515 Free PMC article.
-
Evaluating the impact of stay-at-home and quarantine measures on COVID-19 spread.BMC Infect Dis. 2022 Jul 27;22(1):648. doi: 10.1186/s12879-022-07636-4. BMC Infect Dis. 2022. PMID: 35896977 Free PMC article.
-
Travel-related control measures to contain the COVID-19 pandemic: a rapid review.Cochrane Database Syst Rev. 2020 Oct 5;10:CD013717. doi: 10.1002/14651858.CD013717. Cochrane Database Syst Rev. 2020. Update in: Cochrane Database Syst Rev. 2021 Mar 25;3:CD013717. doi: 10.1002/14651858.CD013717.pub2. PMID: 33502002 Updated.
-
International travel-related control measures to contain the COVID-19 pandemic: a rapid review.Cochrane Database Syst Rev. 2021 Mar 25;3(3):CD013717. doi: 10.1002/14651858.CD013717.pub2. Cochrane Database Syst Rev. 2021. PMID: 33763851 Free PMC article.
-
Modelling the spreading of the SARS-CoV-2 in presence of the lockdown and quarantine measures by a kinetic-type reactions approach.Math Med Biol. 2022 Jun 11;39(2):105-125. doi: 10.1093/imammb/dqab017. Math Med Biol. 2022. PMID: 34875047 Free PMC article.
Cited by
-
Harnessing artificial intelligence for enhanced public health surveillance: a narrative review.Front Public Health. 2025 Jul 30;13:1601151. doi: 10.3389/fpubh.2025.1601151. eCollection 2025. Front Public Health. 2025. PMID: 40809756 Free PMC article. Review.
-
An analysis of spatial and temporal uncertainty propagation in agent-based models.Philos Trans A Math Phys Eng Sci. 2025 Apr 2;383(2293):20240229. doi: 10.1098/rsta.2024.0229. Epub 2025 Apr 2. Philos Trans A Math Phys Eng Sci. 2025. PMID: 40172560 Free PMC article.
References
-
- Hunter, E., Namee, B. M. & Kelleher, J. D. A comparison of agent-based models and equation based models for infectious disease epidemiology. In Irish Conference on Artificial Intelligence and Cognitive Science, 33–44, 10.21427/rtq2-hs52 (2018).
-
- Parunak HVD, Savit R, Riolo RL. Agent-based modeling vs. equation-based modeling: A case study and users’ guide. In: Parunak HVD, editor. International Workshop on Multi-Agent Systems and Agent-Based Simulation. Springer; 1998. pp. 10–25.
-
- Sukumar, S. R. & Nutaro, J. J. Agent-based vs. equation-based epidemiological models: A model selection case study. In 2012 IEEE International Conference on BioMedical Computing (BioMedCom), 74–79,10.1109/BioMedCom.2012.19 (2012).
-
- Pleyer J, Fleck C. Agent-based models in cellular systems. Front. Phys. 2023;10:968409. doi: 10.3389/fphy.2022.968409. - DOI
MeSH terms
LinkOut - more resources
Full Text Sources
Medical
Research Materials
Miscellaneous
