. 2024 Jul;9(7):1792-1811.
doi: 10.1038/s41564-024-01710-0. Epub 2024 Jun 11.

Klebsiella oxytoca inhibits Salmonella infection through multiple microbiota-context-dependent mechanisms

Affiliations

Klebsiella oxytoca inhibits Salmonella infection through multiple microbiota-context-dependent mechanisms

Lisa Osbelt et al. Nat Microbiol. 2024 Jul.

Abstract

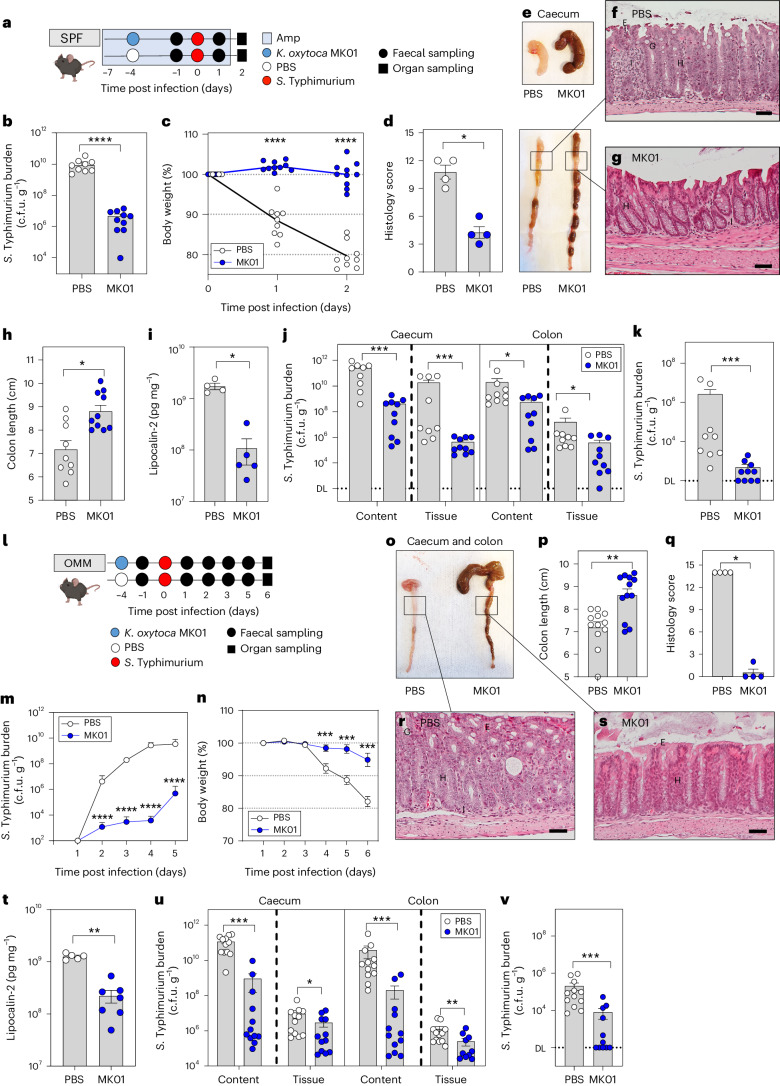
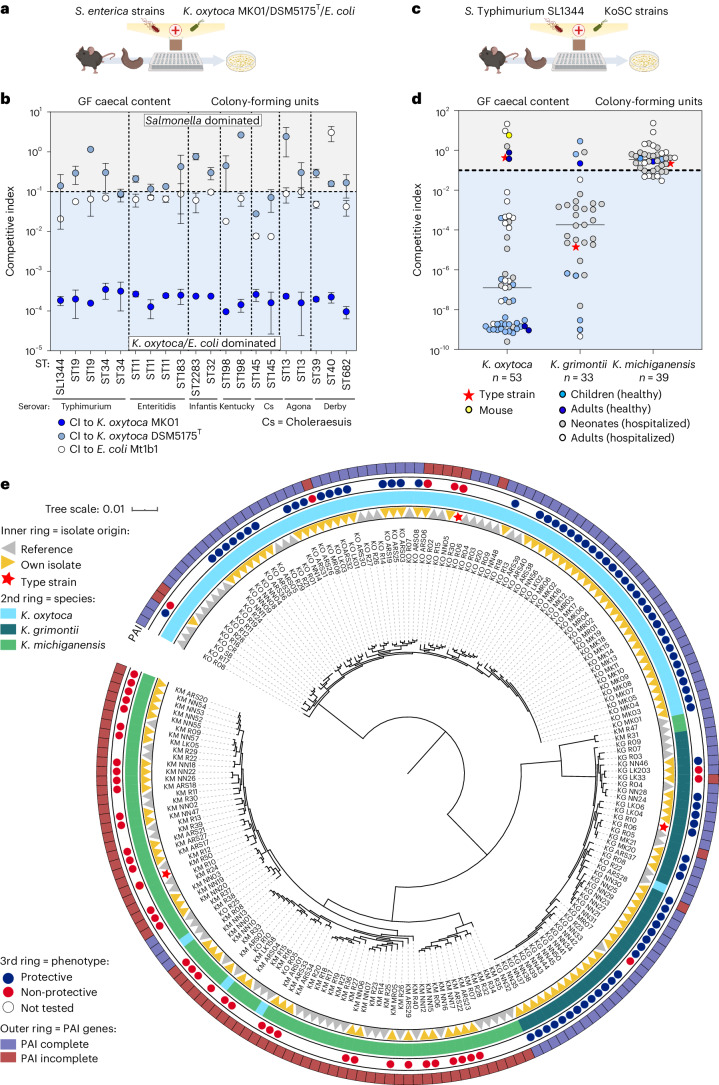
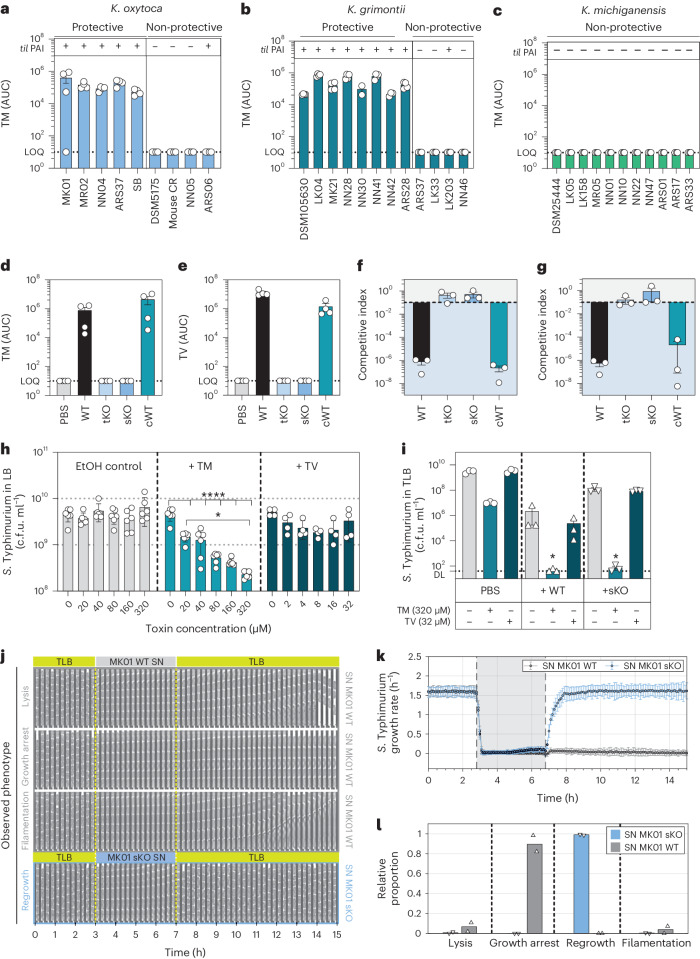
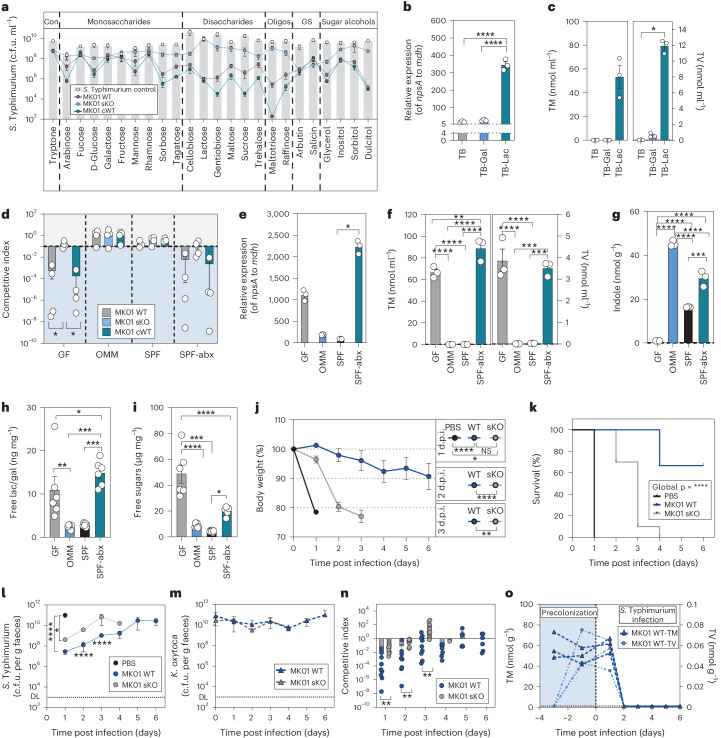
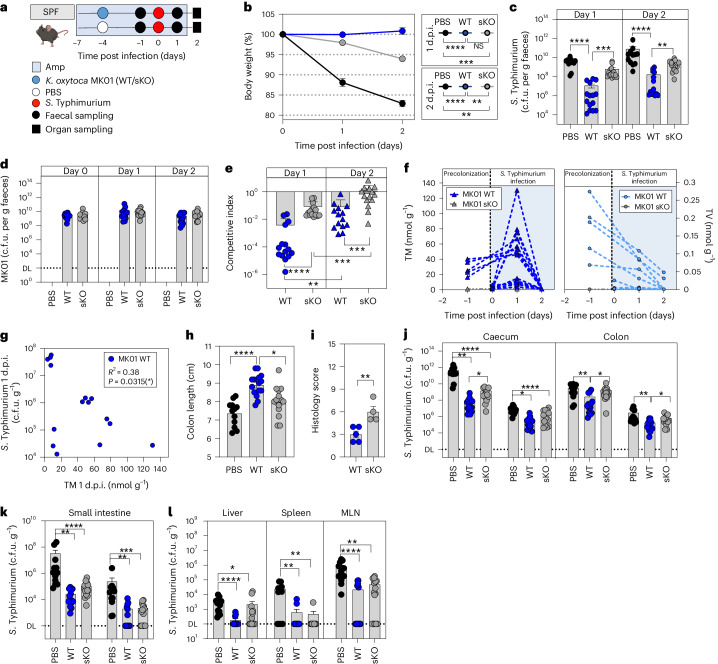
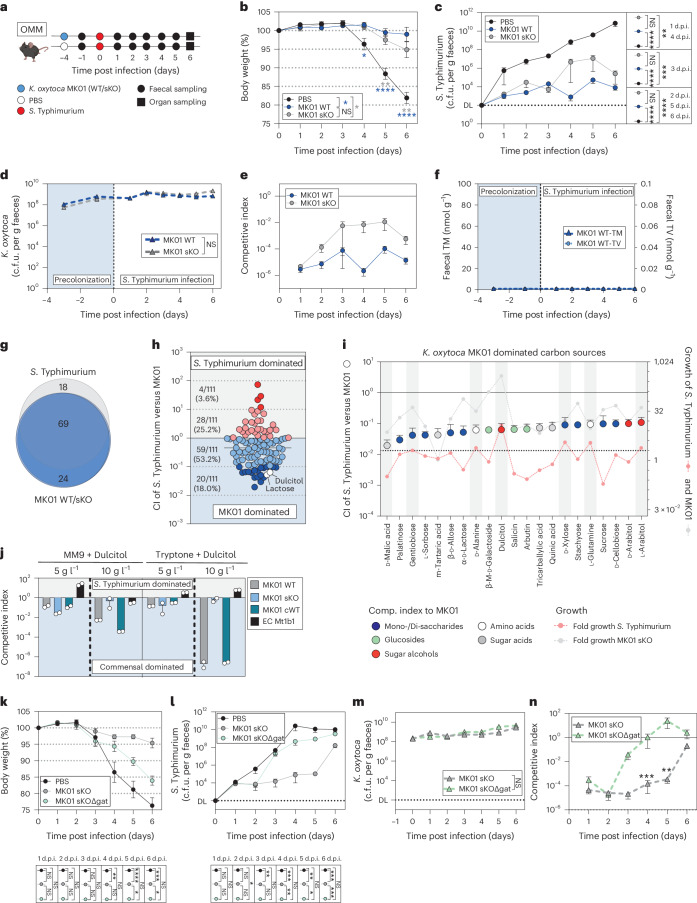
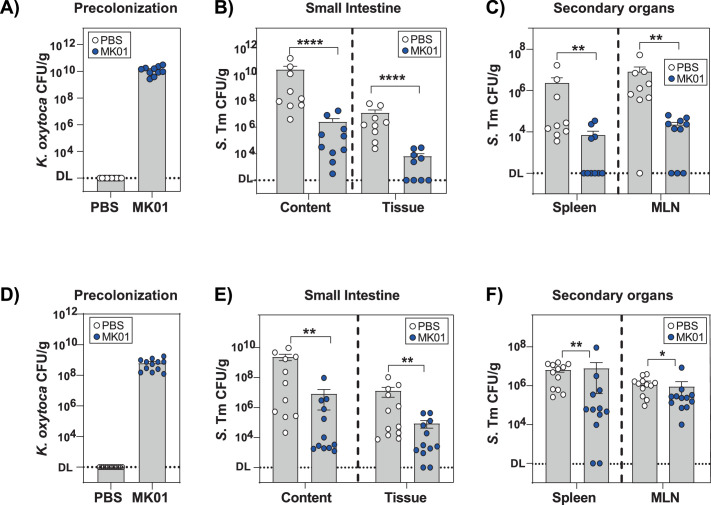
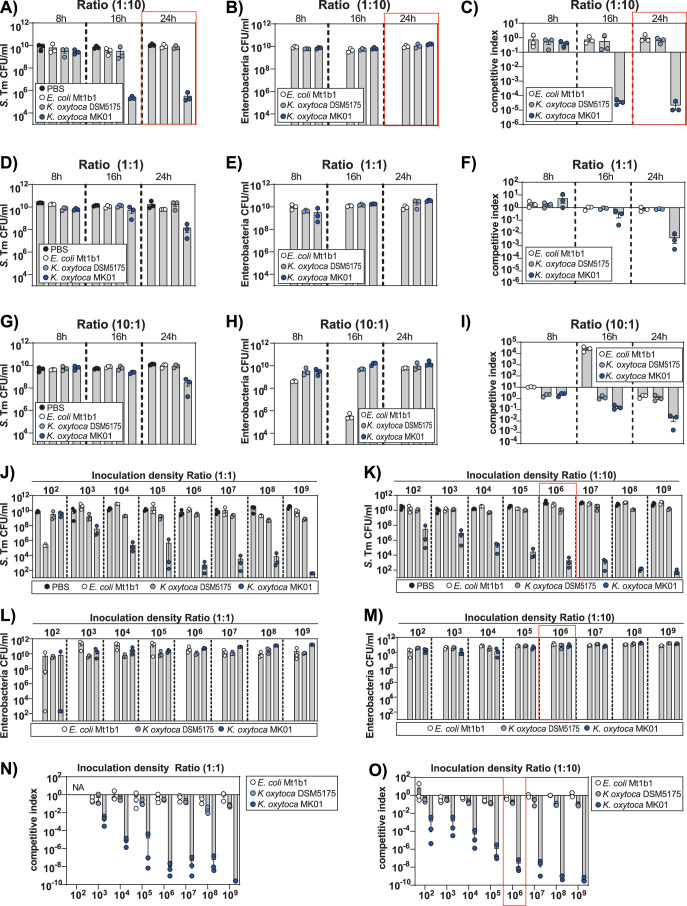
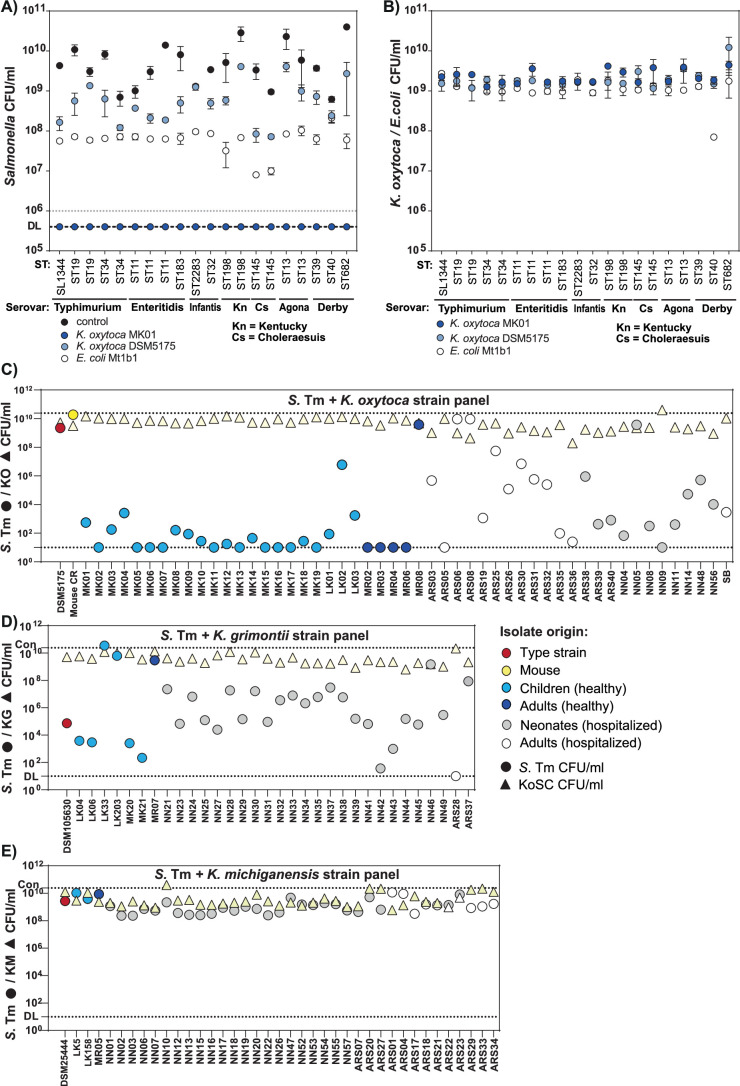
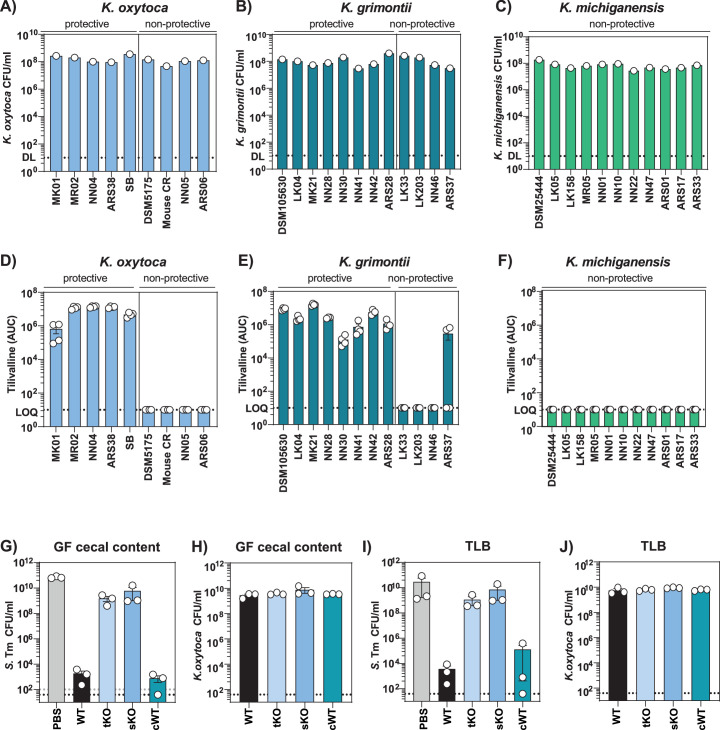
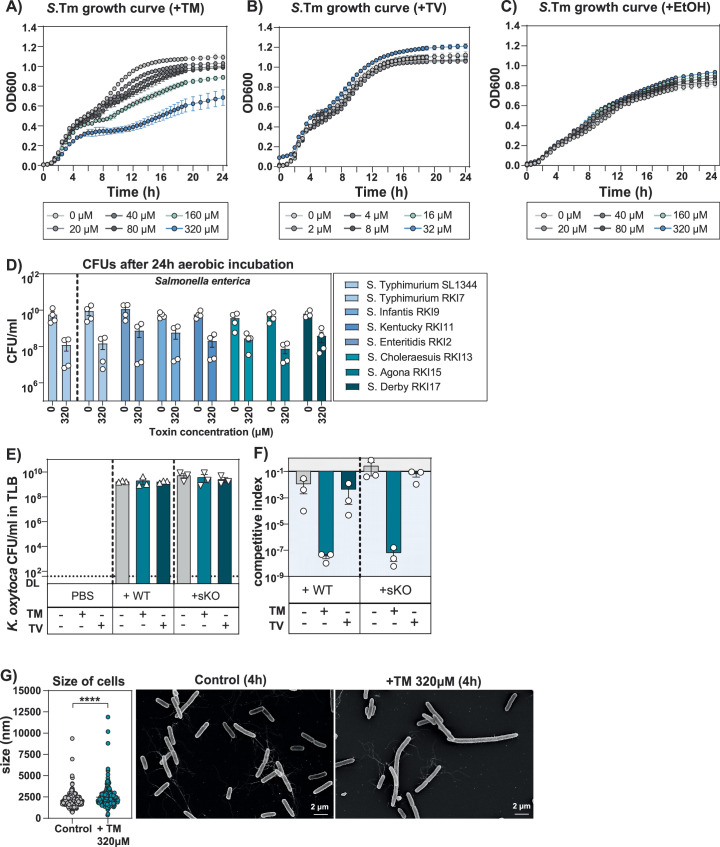
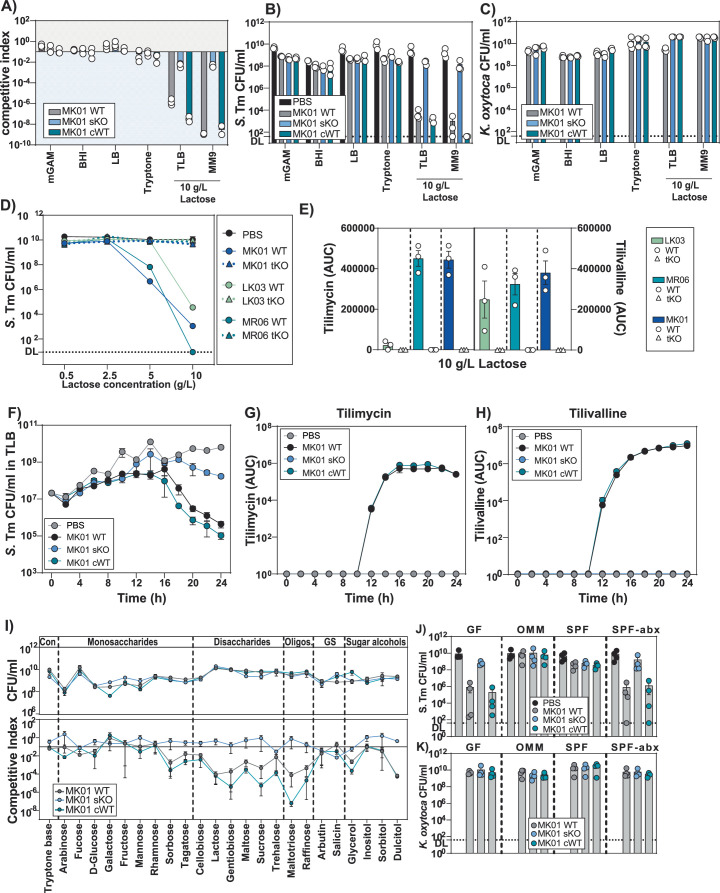
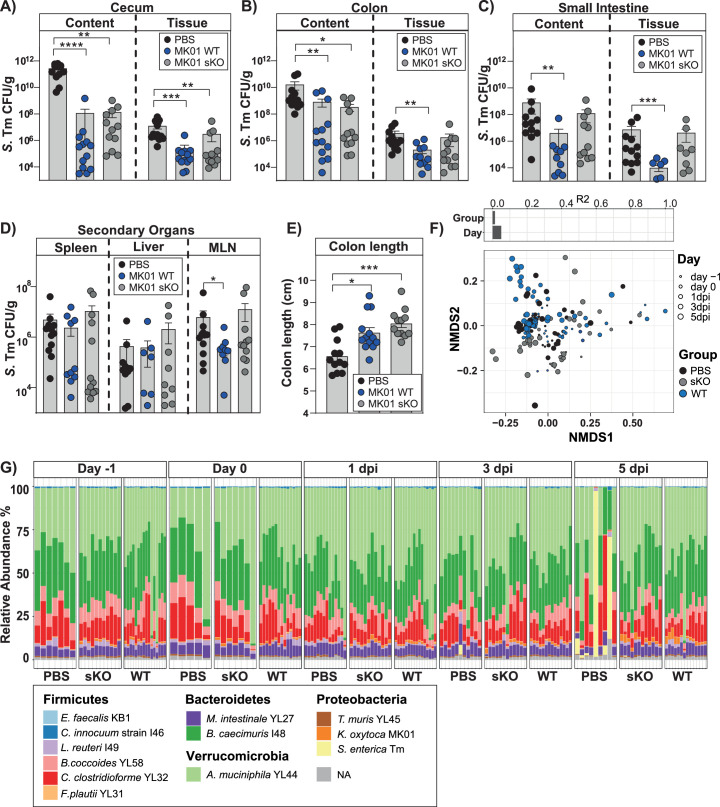
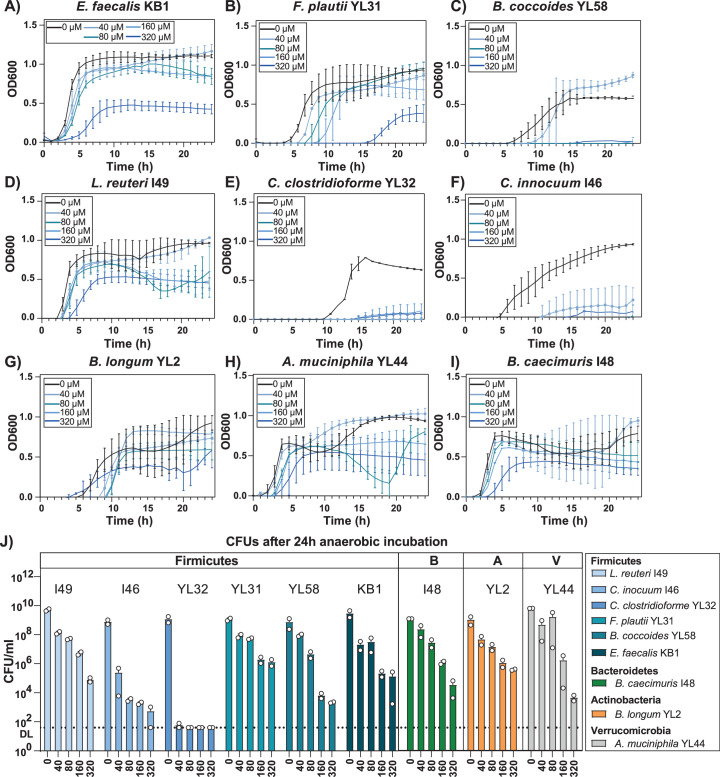
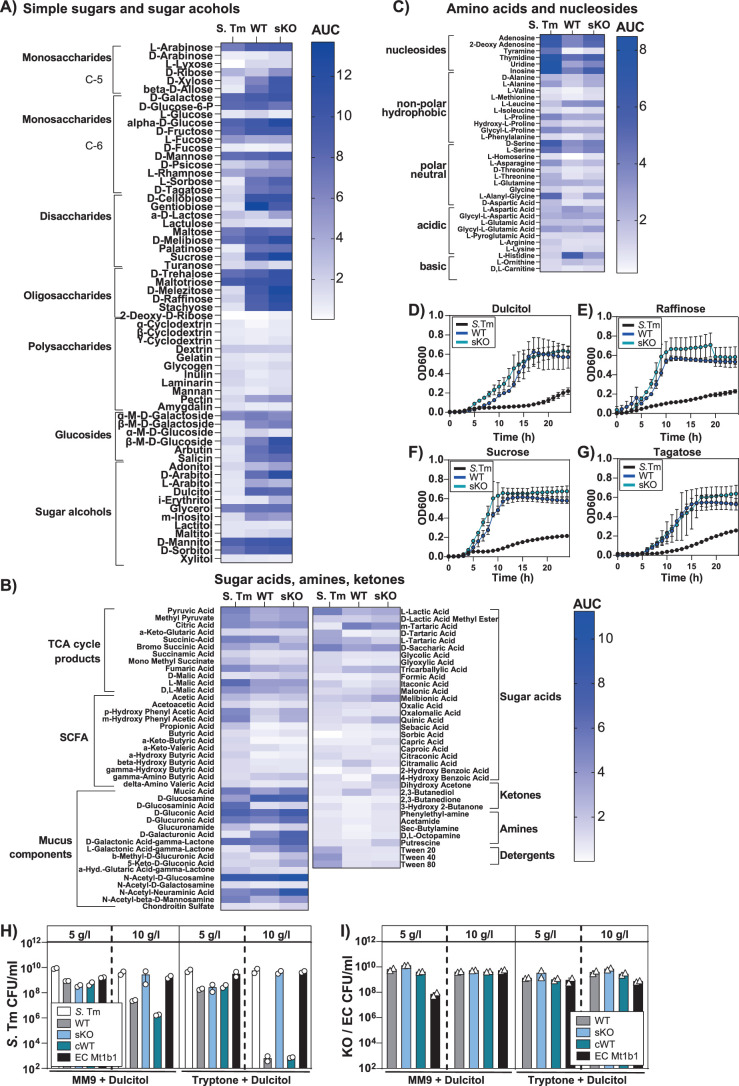
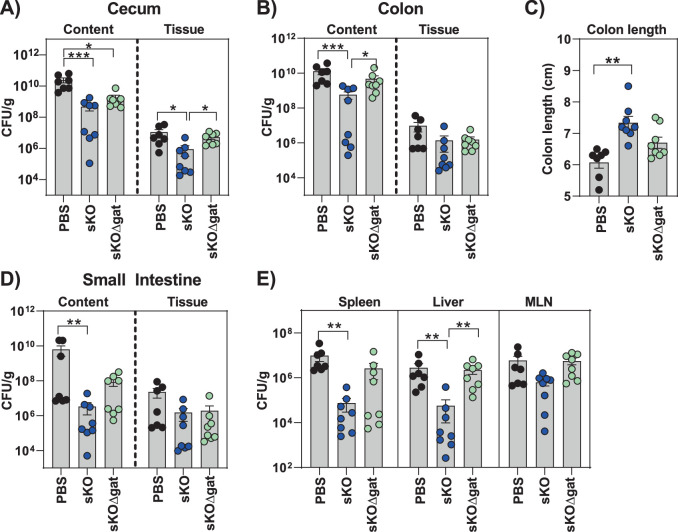
The Klebsiella oxytoca species complex is part of the human microbiome, especially during infancy and childhood. K. oxytoca species complex strains can produce enterotoxins, namely, tilimycin and tilivalline, while also contributing to colonization resistance (CR). The relationship between these seemingly contradictory roles is not well understood. Here, by coupling ex vivo assays with CRISPR-mutagenesis and various mouse models, we show that K. oxytoca provides CR against Salmonella Typhimurium. In vitro, the antimicrobial activity against various Salmonella strains depended on tilimycin production and was induced by various simple carbohydrates. In vivo, CR against Salmonella depended on toxin production in germ-free mice, while it was largely toxin-independent in mice with residual microbiota. This was linked to the relative levels of toxin-inducing carbohydrates in vivo. Finally, dulcitol utilization was essential for toxin-independent CR in gnotobiotic mice. Together, this demonstrates that nutrient availability is key to both toxin-dependent and substrate-driven competition between K. oxytoca and Salmonella.


Conflict of interest statement

L.O., M.W. and T.S. have filed a patent for the use of K. oxytoca to decolonize MDR Enterobacteriaceae from the gut (EP4259171A1, EP4011384A1, WO002022122825A1 and US020240041950A1). The other authors declare no competing interests.

Figures

Fig. 1
Fig. 1. K. oxytoca provides CR in different microbiota settings.
a, Ampicillin-treated SPF mice were colonized with K. oxytoca MK01 or left untreated 4 days before infection. On day 0, mice were orally infected with S. Typhimurium. BWL and faecal colonization were monitored until day 2 p.i. when organs were sampled for examination of S. Typhimurium burden. Amp, ampicillin. b,c, S. Typhimurium burden in the faeces on day 1 p.i. (b) and resulting BWL (c). d, Histological inflammation score of the proximal colon. e, Organ morphology of caecum and colon. f,g, Representative pictures of HE-stained sections of the proximal colon for both groups: PBS (f) and MK01 (g). E, erosion; G, goblet cells; H, hyperplasia; I, inflammatory cells. Scale bars, approximately 50 μm. h,i, Colon length (h) and lipocalin-2 levels (i) in the colon content on day 2 p.i. Mean ± s.e.m. of one experiment with n = 4 (PBS) or n = 5 (WT) mice. j, S. Typhimurium burden in the caecum and colon. DL, level of detection. k, S. Typhimurium burden in the liver. In b, c, h, j and k, mean ± s.e.m. of three pooled experiments with n = 9 (PBS) and 10 (MK01) mice. l, OMM12 mice were colonized with K. oxytoca MK01 or left untreated 4 days before infection. On day 0, mice were orally infected with S. Typhimurium, and BWL and faecal colonization were monitored until day 6 p.i. when organs were sampled for examination of S. Typhimurium burden. m,n, Faecal burden of S. Typhimurium (m) and resulting BWL over the time of infection (n). os, Visual examination of caecum and colon morphology (o) with resulting colon length (p) and histological inflammation score of the proximal colon (q), with representative HE-stained sections of both groups: PBS (r) and MK01 (s). Scale bars, 50 μm. t, Lipocalin-2 levels in the colon content on day 6 p.i., mean ± s.e.m. of two experiments with n = 5 (PBS) or n = 7 (WT) mice. u, S. Typhimurium burden in the caecum and colon. v, S. Typhimurium burden in the liver. In m, n and pv, mean ± s.e.m. of n = 3 experiments with n = 12 mice per group. In d and q, mean ± s.e.m. of one experiment with n = 4 mice. In bd, hk, m, n, p, q and tv, two-tailed Mann–Whitney U-test with *P < 0.05, **P < 0.01, ***P < 0.001 and ****P < 0.0001. See also Extended Data Figs. 1 and 2. Source data
Fig. 2
Fig. 2. Broad protective capability is shared among many K. oxytoca and K. grimontii but not K. michiganensis strains.
a, Aerobic co-cultures of different S. enterica serovars (Typhimurium, Enteritidis, Infantis, Kentucky, Choleraesuis, Agona and Derby) with K. oxytoca MK01/DSM5175T or E. coli Mt1b1 in a 1:10 ratio in isolated GF caecal content. b, Resulting CI of various S. enterica serovars against K. oxytoca MK01, DSM5175T and E. coli Mt1b1. The horizontal dashed line indicates the starting ratio of bacteria (index = 0.1). The mean ± s.e.m. of n = 2 biological experiments with n = 2 technical replicates are displayed. ST, sequence type. c, S. Typhimurium was co-cultivated with different KoSC strains from different origins as described before. d, Resulting CI of S. Typhimurium colony-forming units in co-cultures with various strains from the KoSC species, K. oxytoca, K. michiganensis and K. grimontii. The dashed line indicates the starting ratio of bacteria (index = 0.1). The different colours of each dot represent the origin of the KoSC isolate in each co-culture. Each dot represents the mean of n = 2–3 independent experiments with n = 2–3 technical replicates. e, Phylogenetic distribution of the 122 KoSC isolates in comparison with 75 publicly available genomes including three type strains depicted in the inner ring. The species identity of the strains (second inner ring), the phenotype against S. Typhimurium in the ex vivo co-culture screening (third ring) and their names are indicated. The tree is constructed based on the sequence variations within 712 core genes using fasttree. See also Extended Data Fig. 3. Source data
Fig. 3
Fig. 3. K. oxytoca toxin production is crucial for protective capability in vitro.
SNs of various KoSC strains were assessed for TM (m/z = 235) and TV (m/z = 334) using HPLC. ac, Resulting AUC for TM in sample SNs of K. oxytoca (a), K. grimontii (b) and K. michiganensis (c) strains. Mean ± s.e.m. of one experiment with n = 4 cultures. LOQ, limit of quantification. d,e, AUC for TM (d) and TV (e) of K. oxytoca MK01 WT, tKO, sKO and complemented mutant (cWT). Mean ± s.e.m. of one experiment with n = 4 cultures. f,g, CI of S. Typhimurium after 24 h of co-cultivation with K. oxytoca WT and mutants in GF caecal content media (f) and TLB (g). The dashed line indicates the starting ratio of bacteria (index = 0.1). Mean ± s.e.m. of n = 3 independent experiments with n = 2–3 technical replicates per group. h, colony-forming units of S. Typhimurium grown for 24 h in LB supplemented with various concentrations of TM/TV or EtOH as solvent control. Mean ± s.e.m. of two experiments with n = 4–6 independent cultures of S. Typhimurium. P values indicated represent one-way ANOVA with Tukey’s multiple comparisons test with *P < 0.05 and ****P < 0.0001. i, Resulting S. Typhimurium colony-forming units after co-cultivation with MK01 WT and sKO strain in the absence or presence of 320 µM TM or 32 µM TV. Mean ± s.e.m. of n = 3 experiments with n = 2 technical replicates. P values indicated represent one-way ANOVA with Dunn’s multiple comparisons test with *P < 0.05. j, Representative kymographs of S. Typhimurium mother lineages upon 4 h exposure to spent SN from MK01 WT or MK01 sKO displaying cell lysis, growth arrest or filamentation or regrowth. k, S. Typhimurium growth rates over time. Mean ± s.d. of 1 out of 3 mother machine experiments with n = 36,970 cell division cycles. l, The relative proportion of mother lineages corresponding to different phenotypes upon exposure to SN of MK01 WT or MK01 sKO. Mean from n = 2 independent experiments, corresponding to n = 552 mother cells. See also Extended Data Figs. 4 and 5. Source data
Fig. 4
Fig. 4. K. oxytoca toxin production is regulated through sugar availability and is important in GF mice.
a, Colony-forming units of S. Typhimurium grown alone or in co-culture with MK01 WT, sKO or cWT in tryptone with various sugars. Mean and s.e.m. of n = 3 experiments with n = 3 replicates. Con, control; GS, glycosides. b, Relative gene expression of npsA in MK01 WT in TB with added galactose or lactose. Mean ± s.e.m. one experiment with n = 3 samples with n = 3 replicates. Gal, galactose; Lac, lactose. c, Quantification of TM and TV in the SN of MK01 WT in TB media with galactose or lactose. Mean ± s.e.m. of n = 3 independent cultures. d, CI of S. Typhimurium in co-cultures with K. oxytoca MK01 WT, sKO or cWT in various sterile caecal contents. Mean ± s.e.m. of n = 4 experiments with n = 2 replicates. The dashed line indicates the inoculation ratio. e, Relative gene expression of npsA in MK01 WT in various caecal contents. Mean ± s.e.m. of one representative experiment from n = 3 samples with n = 3 replicates. f,g, Quantification of TM and TV (f) and of indole (g) in the SN of MK01 WT in various caecal contents. Mean ± s.e.m. of n = 3 independent cultures. h,i, Free lactose/galactose levels (h) and total free carbohydrate levels (i) from SNs of caecal content. Mean ± s.e.m. of n = 6 mice measured in duplicates. j–o, GF mice were colonized with MK01 WT or sKO or left untreated 4 days before infection. On day 0 mice were orally infected with S. Typhimurium, and BWL, survival and faecal colonization were monitored until day 6 p.i. j, BWL over the time of infection. d.p.i., days post infection; NS, not significant. k, Survival of various S. Typhimurium infected groups. Log-rank (Mantel–Cox) test between curves with ****P < 0.0001. ln, Faecal colony-forming units of S. Typhimurium (l) and K. oxytoca (m), and resulting CI at various time points (n). DL, level of detection. The solid line indicates equal amounts of bacteria (index = 1). o, Faecal TM and TV in WT colonized animals. In jn, mean ± s.e.m. of n = 2 experiments with n = 8 (PBS), n = 9 (WT) or n = 10 (sKO) mice per group. In b and e, ordinary one-way ANOVA with Holm–Šídák’s multiple comparisons test with *P < 0.05, ****P < 0.0001. In d and fi, ordinary one-way ANOVA with Tukey’s multiple comparisons test between groups with *P < 0.05, **P < 0.01, ***P < 0.001 and ****P < 0.0001. In c and jn, one-way ANOVA with Dunn’s multiple comparisons test between groups. In j and ln, two-tailed Mann–Whitney U-test between two groups with *P < 0.05, **P < 0.01, ***P < 0.001 and ****P < 0.0001. See also Extended Data Fig. 6. Source data
Fig. 5
Fig. 5. K. oxytoca toxin production plays an intermediate role in disturbed but complex microbiota settings.
a, Ampicillin-treated SPF mice were colonized with K. oxytoca MK01 WT, sKO or left untreated 4 days before infection. On day 0, mice were orally infected with S. Typhimurium, and BWL and faecal colonization were monitored until day 2 p.i. Organs were sampled for examination of S. Typhimurium burden on day 2 p.i. Amp, ampicillin. b, Resulting BWL on day 1 and day 2 p.i. c, S. Typhimurium burden in the faeces on day 1 and day 2 p.i. d.p.i., days post infection. d, Corresponding levels of K. oxytoca MK01 WT or sKO in the faeces of the mice. DL, level of detection. e, Resulting CI of K. oxytoca MK01 WT and sKO colonized animals. P values indicated represent two-tailed MannWhitney U-test between WT and sKO or Wilcoxon matched-pairs signed rank test within each group comparing the different time points. f, Absolute quantification of faecal TM and TV at various time points of the experiment in MK01 WT and sKO colonized SPF-abx animals. g, Correlation of faecal TM levels and S. Typhimurium burden in the faeces on day 1 p.i. of K. oxytoca MK01 WT colonized mice. Pearson’s correlation coefficient R2 = 0.3088 and P = 0.0315 (two-tailed test). h, Colon length on day 2 p.i. i, Histological inflammation score of the proximal colon. Mean ± s.e.m. of one experiment with n = 4 (PBS) or n = 5 (WT/sKO) mice per group. jl, Resulting S. Typhimurium burden in the lumen and tissue of the caecum and colon (j), the small intestine (k) and extra-intestinal organs including liver, spleen and mesenteric lymph nodes (MLN) (l). In bh and jl, mean ± s.e.m. of n = 3 experiments with n = 12 (PBS), n = 15 (WT/sKO) mice per group are displayed. P values indicated represent ordinary one-way ANOVA with Dunn’s multiple comparisons test (b, c, h and jl) or two-tailed Mann–Whitney U-test (e and i) with *P < 0.05, **P < 0.01, ***P < 0.001 and ****P < 0.0001. Source data
Fig. 6
Fig. 6. Protective phenotype of K. oxytoca in homeostatic microbiota is dependent on carbohydrate competition.
a, OMM12 mice were colonized with K. oxytoca MK01 WT, sKO or left untreated 4 days before infection. On day 0, mice were orally infected with S. Typhimurium, and BWL, faecal colonization and microbiome composition were monitored until day 6 p.i. when organs were sampled. be, BWL (b), faecal colony-forming units of S. Typhimurium (c) and K. oxytoca (d) and CI of WT and sKO colonized mice (e). DL, level of detection; d.p.i., days post infection. f, Faecal TM and TV over time. (b–f) Mean ± s.e.m. of n = 3 experiments with n = 12 (PBS/sKO) or n = 13 (WT) mice per group. g, Venn diagram displaying carbon source overlap of S. Typhimurium and MK01 WT/sKO based on n = 4 independent measurements. h, CI of S. Typhimurium after co-cultivation with sKO in 111 carbon sources in a 1:1 ratio. i, The top 20 K. oxytoca-dominated carbon sources displayed as CI (left y-axis) in comparison to the growth of both bacteria in single cultures (right y-axis). The dashed line indicates active growth >2. In h and i, mean ± s.e.m. of n = 4 independent measurements. j, CI of S. Typhimurium co-cultures with MK01 WT, sKO, cWT, and E. coli Mt1b1 strains in MM9 or TB supplemented with dulcitol. Mean ± s.e.m. of n = 2 experiments with n = 2 technical replicates are displayed. kn, OMM12 mice were colonized with K. oxytoca MK01 sKO, sKOΔgatABC or left untreated 4 days before infection. On day 0, mice were orally infected with S. Typhimurium, and BWL and faecal colonization was monitored until day 6 p.i. when organs were sampled. BWL (k); faecal colony-forming units of S. Typhimurium (l) and K. oxytoca (m); and resulting CI of K. oxytoca colonized mice (n). The mean and s.e.m. of n = 2 experiments with n = 7 (PBS) or n = 8 (sKO/ sKOΔgatABC) mice per group. In b, c, k and l, ordinary one-way ANOVA with Dunn’s multiple comparisons test between groups with *P < 0.05, **P < 0.01, ***P < 0.001 and ****P < 0.0001. In df, m and n, two-tailed MannWhitney U-test with *P < 0.05, **P < 0.01, ***P < 0.001 and ****P < 0.0001. In h, i, j and n, the solid line indicates the starting ratio of bacteria (index = 1). See also Extended Data Figs. 7–10. Source data
Extended Data Fig. 1
Extended Data Fig. 1. K. oxytoca provides colonization resistance in different microbiota settings.
(a) Fecal colonization levels of K. oxytoca MK01 precolonized SPF mice at day 0. (b) S. Tm burden in the lumen and tissue of small intestine and (c) various secondary organs including spleen and MLN of S. Tm-infected SPF mice at day 2 p.i. (a-c) Mean ± SEM of three independent experiments with n = 9 (PBS) or 10 (MK01) mice per group are displayed. P-values indicated represent two-tailed Mann-Whitney U-test with *p < 0.05, **p < 0.01, ***p < 0.001 and ****p < 0.0001. (d) Fecal colonization levels of K. oxytoca MK01 precolonized OMM12 mice at day 0. (e) S. Tm burden in the lumen and tissue of small intestine and (f) various secondary organs including spleen and MLN of S. Tm infected OMM12 mice at day 6 p.i. (d-f) Mean ± SEM of three independent experiments with n = 12 mice per group are displayed. P-values indicated represent two-tailed Mann-Whitney U-test with *p < 0.05, **p < 0.01, ***p < 0.001 and ****p < 0.0001. Source data
Extended Data Fig. 2
Extended Data Fig. 2. K. oxytoca MK01 inhibits S. Tm better than two reference bacteria.
Aerobic co-cultures of S. Tm with Enterobacteria (K. oxytoca MK01, K. oxytoca DSM5175T or E. coli Mt1b1) in in germfree cecal content with varying ratios and incubation times. Resulting CFUs of (a) S. Tm and (b) Enterobacteria in a 1:10 ratio and (c) corresponding competitive index (CI). Resulting CFUs of (d) S. Tm and (e) Enterobacteria in a 1:1 ratio and (f) corresponding CI. (g) Resulting CFUs of S. Tm and (h) Enterobacteria in a 10:1 ratio and (I) corresponding CI. (j-o) Titration of various inoculation densities in a 1:1 and 1:10 ratio for S. Tm. vs. K. oxytoca MK01, K. oxytoca DSM5175T and E. coli Mt1b1 after 24 h of aerobic cultivation. (j) Resulting CFUs of various inoculation densities of S. Tm in a 1:1 and (k) 1:10 starting ratio. (l) Resulting CFUs of various inoculation densities of the enterobacterial strains in a 1:1 and (m) 1:10 starting ratio. (n) Corresponding CI of both bacteria at various inoculation densities and a starting ratio of 1:1 or (o) 1:10. (a-n) The mean ± SEM of one experiment with n = 3 technical replicates is displayed. Source data
Extended Data Fig. 3
Extended Data Fig. 3. Broad protective capability is shared among many K. oxytoca and K. grimontii but not K. michiganensis strains from different origins.
(a) S. enterica and (b) Enterobacteria (K. oxytoca MK01/DSM5175T, E. coli Mt1b1) CFUs after 24 h of co-cultivation. Dashed line indicates level of detection (DL). (a-b) The mean ± SEM of two independent biological experiments with n = 2 technical replicates are displayed. (c) Resulting S. Tm (dots) and KoSC (triangles) CFUs of co-cultures with various strains from the KoSC, including K. oxytoca = KO, (d) K. grimontii = KG and (e) K. michiganensis = KM. The different colors of each dot represent the origin of the KoSC isolate in each co-culture (type strains = red star, mouse gut isolate = yellow dot, healthy children = light blue dot, healthy adults = dark blue dot, neonatal isolate from medical environment = light grey dot and adult isolate from medical environment = white dot). Dots represent the levels of S. Tm in each co-culture, while triangles represent the corresponding CFUs of the KoSC strain in each condition. (c-e) The mean of 2 (K. grimontii) or 3 (K. oxytoca / K. michiganensis panel) independent biological experiments with n = 2 technical replicates are displayed. Source data
Extended Data Fig. 4
Extended Data Fig. 4. K. oxytoca toxin production is crucial for protective capability against Salmonella ex vivo.
(a) CFUs of mono-cultures of various protective and non-protective K. oxytoca and (b) K. grimontii strains as well as (c) a representative panel of non-protective K. michiganensis strains in TLB medium. (a-c) CFUs of one culture are displayed. (d) Resulting area under curve (AUC) for TV in sample supernatants of different protective and non-protective isolates of K. oxytoca, (e) K. grimontii and (f) non-protective K. michiganensis strains. (d-f) Results represent mean ± SEM of n = 4 independent biological cultures. (G-H) S. Tm and K. oxytoca CFUs after 24 h of co-cultivation with WT, tKO, sKO and cWT MK01 strains in cecal content media and (i-j) TLB (10 g/L). (g-j) The mean ± SEM of n = 3 independent biological experiments with n = 2-3 technical replicates are displayed. Source data
Extended Data Fig. 5
Extended Data Fig. 5. K. oxytoca toxins alone inhibit S. Tm partially, but complete inhibitory phenotype requires toxins and metabolic active bacteria.
(a) OD600 of S. Tm in LB supplemented with various concentrations of TM (0 µM to 320 µM), (b) TV (0 µM to 32 µM) and (c) EtOH as a solvent control (0 µM to 320 µM) over 24 h. (a-c) The mean ±SEM of one out of two biological experiment with n = 2 technical replicates is displayed. (d) CFUs of various Salmonella enterica serovars in LB media supplemented with 320 µM TV or EtOH as solvent control. (d) The mean ± SEM of n = 2 independent biological experiments with n = 2-3 technical replicates per group are displayed. (E) K. oxytoca MK01 WT and sKO CFUs after co-cultivation with S. Tm in the absence or presence of 320 µM TM or 32 µM TV. (f) CI of S. Tm after 24 h of co-cultivation with K. oxytoca MK01 WT and sKO strains in TLB media supplemented with 320 µM TM or 32 µM TV. Solid line indicates starting ratio of bacteria (index = 0.1). (e, f) The mean ± SEM of n = 3 independent experiments with n = 2-3 technical replicates per group are displayed. (g) Representative scanning electron microscopy pictures at 4,000 X magnification of S. Tm in TLB media without and with 320 µM TM. Bar represents 2 µm. Average size of cells obtained from 10 microscopic images at randomly selected positions of S. Tm in TLB media without and with 320 µM TM after 4 h of aerobic cultivation. P-value indicated represents two-tailed Mann-Whitney U-test between groups with ****p < 0.0001. Source data
Extended Data Fig. 6
Extended Data Fig. 6. K.oxytoca toxin production plays a major role in disturbed microbiota settings with high amounts of free sugars.
(a) CI of S. Tm after 24 h of co-cultivation with K. oxytoca MK01 WT, sKO and cWT strains in various semi-defined and defined culture media. (b) Corresponding S. Tm and (c) K. oxytoca CFUs after co-cultivation in various semi-defined and defined culture media. (a-c) The mean ± SEM of n = 3 independent experiments with n = 2-technical replicates per group are displayed. (d) S. Tm was co-cultured with three different K. oxytoca WT and tKO mutant strains (MK01, LK03 and MR06) in TLB with various concentrations of lactose. Resulting S. Tm CFUs are displayed. The mean ± SEM of n = 2 independent experiments with n = 2-technical replicates per group are displayed. (e) Area under curve (AUC) for TM and TV in sample supernatants of different WT and tKO strains of K. oxytoca after 24 h of co-cultivation with S. Tm in TLB medium with 10 g/l lactose. The mean ± SEM of three independent cultures are displayed. (f) S. Tm CFUs after various time points (every 2 h over 24 h) of co-cultures with MK01 WT, sKO and cWT strains in TLB and (g) corresponding AUCs for TM and (h) TV (F-H) The mean ± SEM of n = 2 independent experiments with n = 2 technical replicates are displayed. (i) K. oxytoca CFUs (upper panel) and corresponding CI (lower panel) of co-cultures with S. Tm in tryptone broth with various mono-, di- and oligo-saccharides as carbon sources (10 g/L). Solid line indicates starting ratio of bacteria (index = 0.1). The mean ± SEM of n = 2-3 independent experiments performed in n = 3 technical replicates are displayed. (j) S. Tm and (k) K. oxytoca CFUs after co-cultivation in sterile filtered cecal content supernatants of GF, OMM12, SPF and antibiotic treated SPF mice (abx). Dashed lines display limit of detection. (j-k) The mean ± SEM of four independent experiments with n = 2-technical replicates per group are displayed. Source data
Extended Data Fig. 7
Extended Data Fig. 7. Protective phenotype in OMM12 mice is largely toxin-independent.
Mice were precolonized with WT MK01 or sKO or left untreated before infection with S. Tm. S. Tm burden in the lumen and tissue of (a) cecum, (b) colon, (c) small intestine and (d) various secondary organs including spleen, liver and MLN of infected OMM12 mice at day 6 p.i. (e) Colon length at day 6 p.i. in K. oxytoca colonized mice and control mice. (A-E) The mean ± SEM of n = 3 independent experiments with n = 12 (PBS/sKO) and n = 13 (WT) mice per group. P values indicated represent Ordinary One-Way ANOVA with Dunn’s multiple comparisons test with *p < 0.05, **p < 0.01, ***p < 0.001 and ****p < 0.0001. (f) β-diversity of OMM12 mice using non-metric multidimensional scaling (NMDS). Different groups and sampling time points are indicated. Individual effect size of tested covariates is indicated. To calculate the variance explained by individual factors such as group and time point, a permutational multivariate analysis of variance (ADONIS) was used. A significant effect was dedicated when p < 0.05 and R2 > 0.10 (equivalent to 10 % of explained variance) was observed. (g) Microbiome composition (relative abundance) of each single mouse in different groups (PBS, WT and sKO-colonized) at various time points of the experiment are displayed on species level. (f-g) Data derived from n = 3 independent experiments with n = 14 (PBS), n = 12 sKO, n = 16 (WT) mice. Source data
Extended Data Fig. 8
Extended Data Fig. 8. TM has broad spectrum activity against gut members of the OMM12 microbiome in vitro.
(a-i) Growth curves of various gut bacteria of the OMM12 community in presence of various TM concentrations ranging from 0 µM to 320 µM. Results represent the mean ± SEM of two (40 mM – 320 mM) or n = 3-4 (0 mM) independent measurements performed in n = 2 technical replicates replicates. (j) Corresponding CFUs of the same bacteria cultivated for 24 h under anaerobic conditions in BHI medium supplemented with TM concentrations ranging from 0 µM to 320 µM. Bacteria are sorted based on their phylum. Results represent the mean ± SEM of n = 2 biological experiments performed in n = 2 technical replicates. Source data
Extended Data Fig. 9
Extended Data Fig. 9. K. oxytoca and Salmonella have distinct but partially overlapping carbohydrate preferences and likely compete for various substrates.
(a-c) Heatmaps displaying growth displayed as area under curve in selected carbon sources for S. Tm in comparison with K. oxytoca MK01 WT and the sKO mutant after 24 h aerobic incubation using the Biolog microarrays PM1 and PM2a. Sugars are grouped based on their chemical structure with simple sugars and sugar alcohols displayed in (a), sugar acids, amines and ketones displayed in (b) and amino acids and nucleosides displayed in (c). Color scale bar shows AUC over the period of 24 h aerobic incubation. (a-c) Results represent mean (average growth) values of n = 3 independent measurements. (d-g) Growth curves of S. Tm and MK01 WT and sKO in selected carbon sources including (d) dulcitol, (e) raffinose, (f) sucrose and (g) tagatose. Results represent mean ± SEM growth values of n = 3 independent measurements with n = 2 technical replicates. (h) S. Tm CFUs and (i) K. oxytoca / E. coli CFUs in MM9 medium supplemented with 5 g/l or 10 g/l dulcitol after 24 h of co-cultivation in a 1:1 ratio. Results represent mean ± SEM of n = 2 independent experiments performed in n = 2 technical replicates. Source data
Extended Data Fig. 10
Extended Data Fig. 10. Metabolic competition for dulcitol is a key factor for protection against S. Tm.
OMM12 mice were colonized with 5 × 10⁸ CFUs of K. oxytoca MK01 sKO, sKOΔgatABC or left untreated four days before infection. At day 0 mice were orally infected with 5×10⁵ CFUs of S. Tm and BWL and fecal colonization were monitored until day 6 p.i. Organs were sampled at day 6 p.i. (a) Resulting CFUs in the lumen and tissue of cecum and (b) colon. (c) Colon length at day 6 p.i. and (d) resulting CFUs in the lumen and tissue of the small intestine and (e) extra-intestinal organs including spleen, liver and MLN. (a-e) The mean and SEM of two independent experiments with n = 7 (PBS) or n = 8 (sKo/WT) mice per group are displayed. P values indicated represent Ordinary One-Way ANOVA with Dunn’s multiple comparisons test with *p < 0.05, **p < 0.01, ***p < 0.001 and ****p < 0.0001. Source data

References

    1. Buffie CG, Pamer EG. Microbiota-mediated colonization resistance against intestinal pathogens. Nat. Rev. Immunol. 2013;13:790–801. doi: 10.1038/nri3535. - DOI - PMC - PubMed
    1. Kamada N, et al. Regulated virulence controls the ability of a pathogen to compete with the gut microbiota. Science. 2012;336:1325–1329. doi: 10.1126/science.1222195. - DOI - PMC - PubMed
    1. Ng KM, et al. Microbiota-liberated host sugars facilitate post-antibiotic expansion of enteric pathogens. Nature. 2013;502:96–99. doi: 10.1038/nature12503. - DOI - PMC - PubMed
    1. Osbelt L, et al. Klebsiella oxytoca causes colonization resistance against multidrug-resistant K. pneumoniae in the gut via cooperative carbohydrate competition. Cell Host Microbe. 2021 doi: 10.1016/j.chom.2021.09.003. - DOI - PubMed
    1. Fang K, Jin X, Hong SH. Probiotic Escherichia coli inhibits biofilm formation of pathogenic E. coli via extracellular activity of DegP. Sci. Rep. 2018;8:4939. doi: 10.1038/s41598-018-23180-1. - DOI - PMC - PubMed

MeSH terms

LinkOut - more resources