. 2024 Jul;9(7):1661-1675.
doi: 10.1038/s41564-024-01635-8. Epub 2024 Jun 11.

Longitudinal multi-omics analysis of host microbiome architecture and immune responses during short-term spaceflight

Affiliations

Longitudinal multi-omics analysis of host microbiome architecture and immune responses during short-term spaceflight

Braden T Tierney et al. Nat Microbiol. 2024 Jul.

Abstract

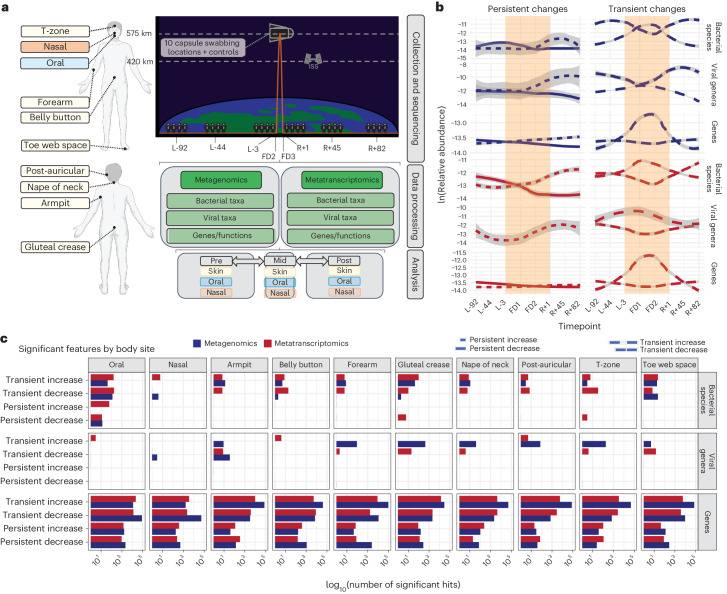
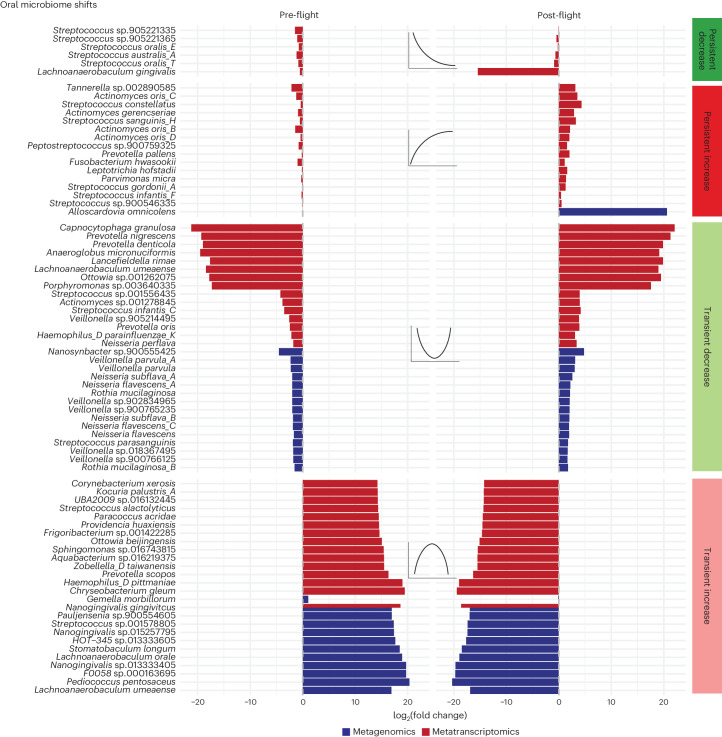
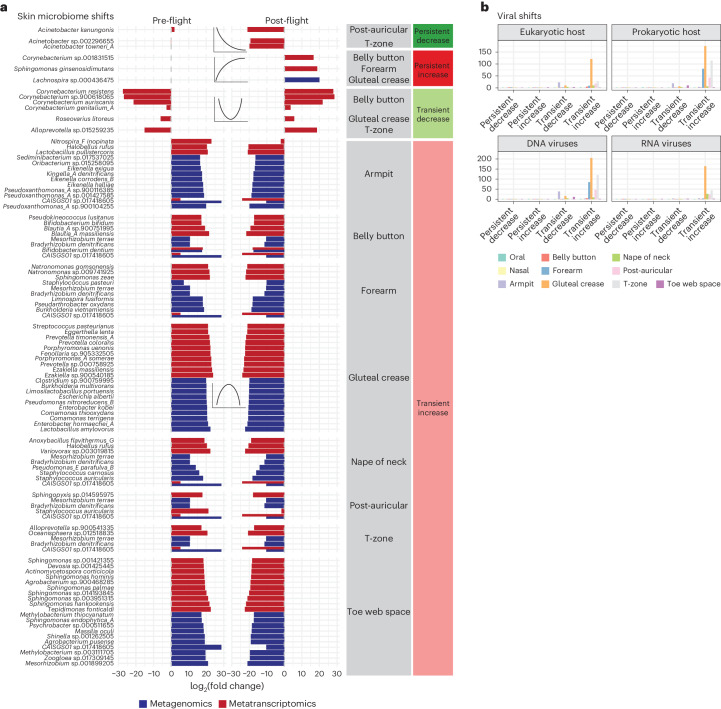
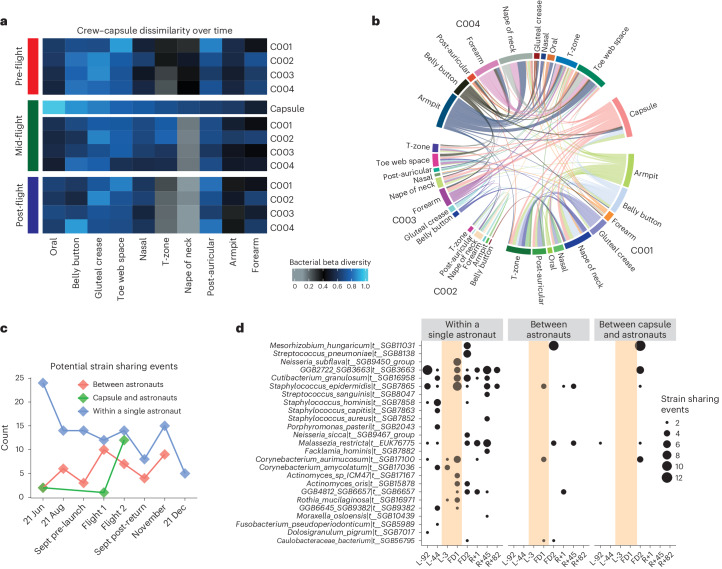
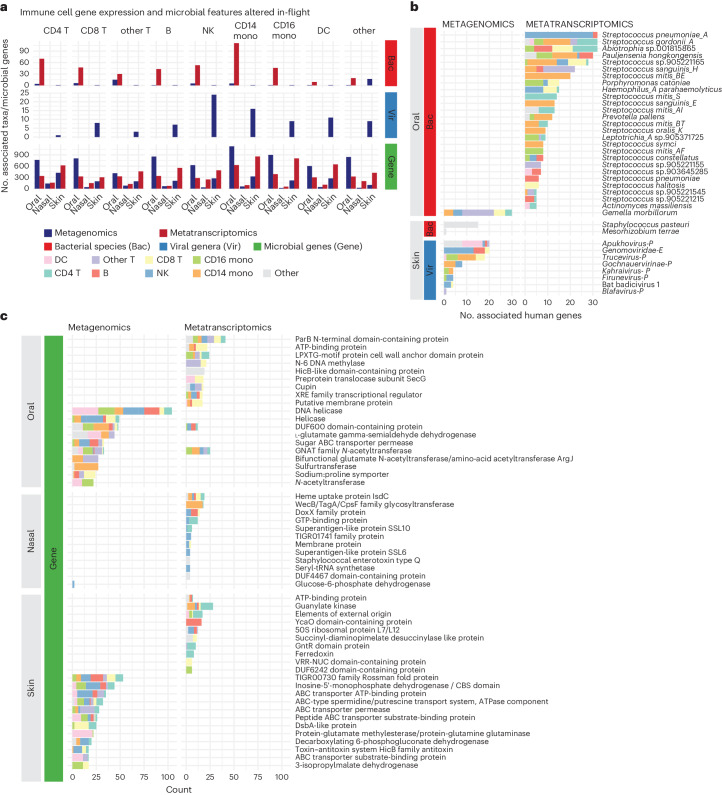
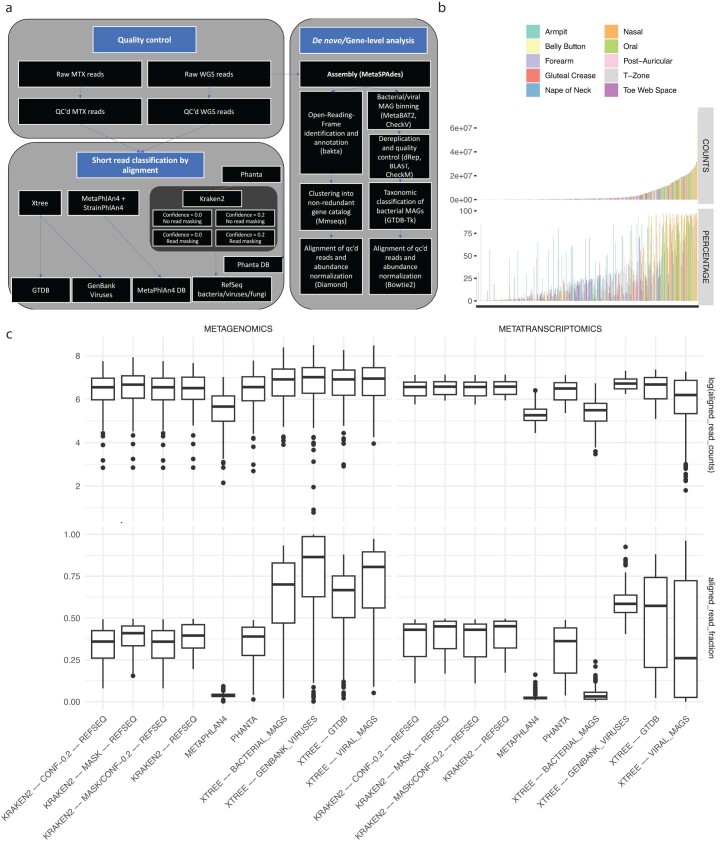
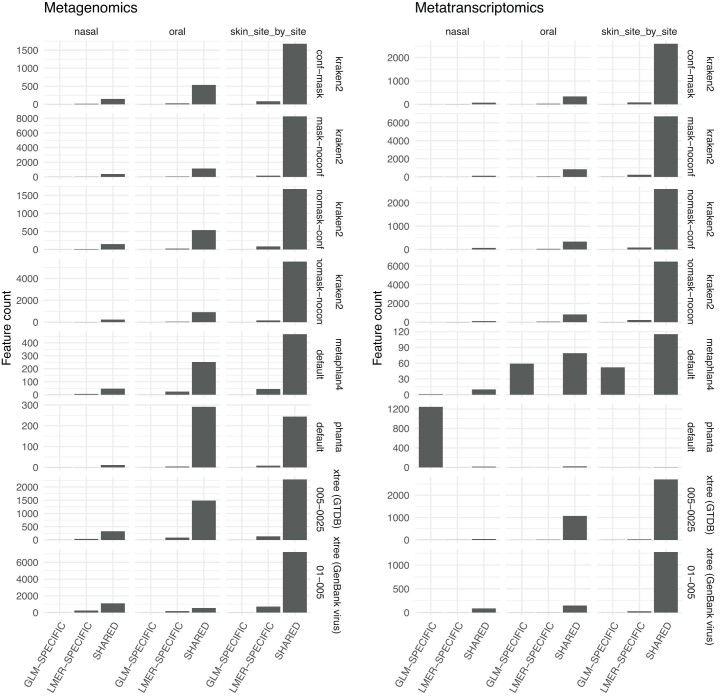
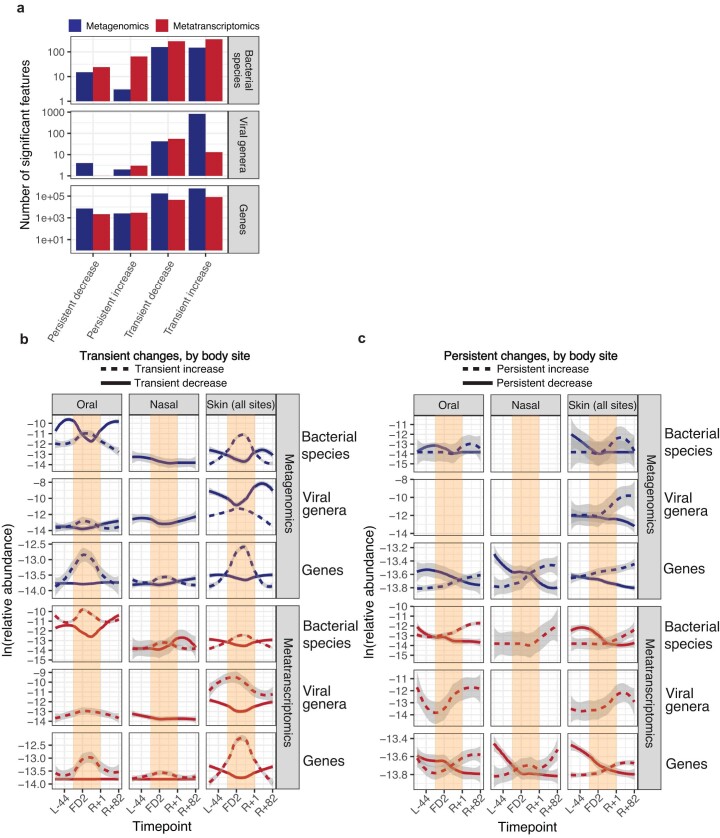
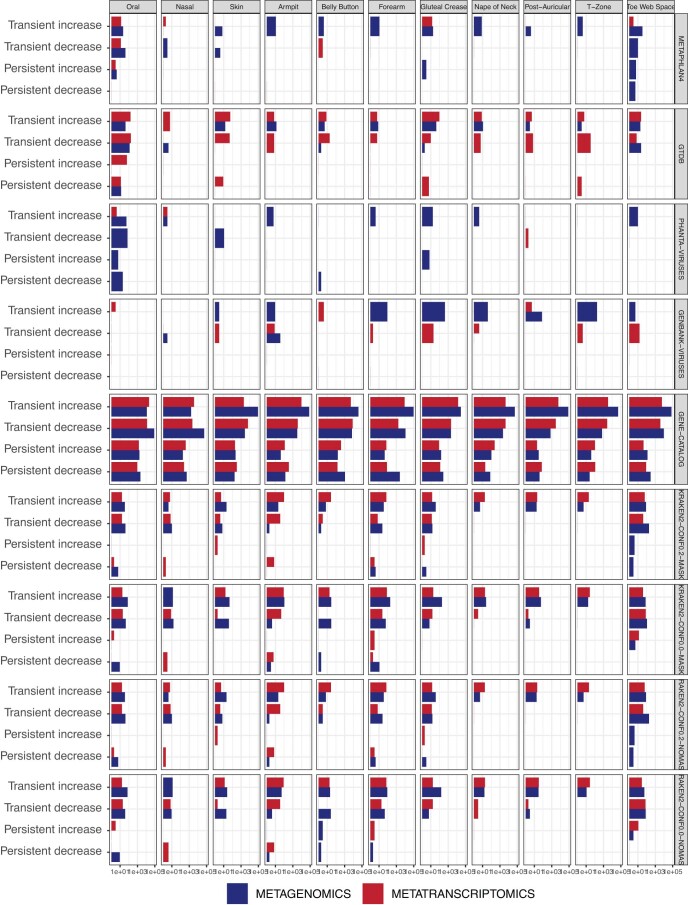
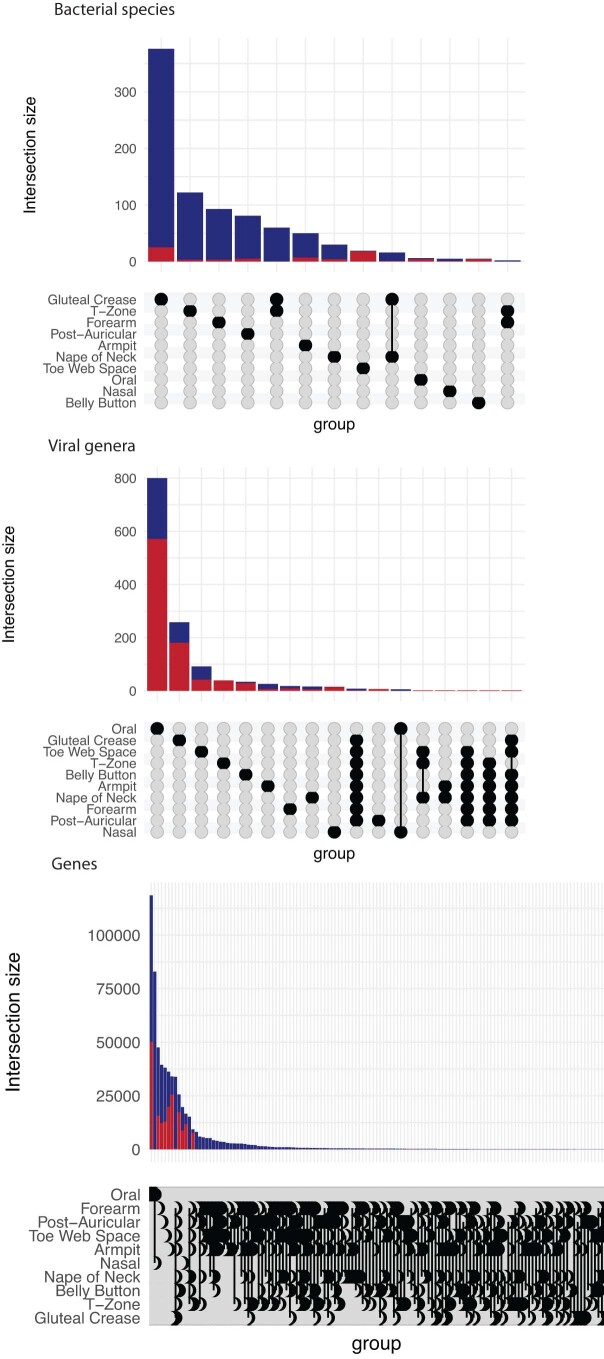
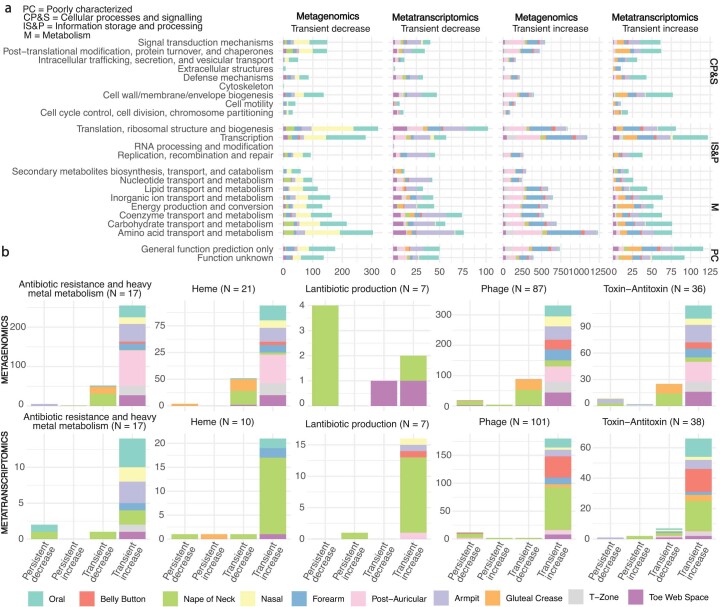
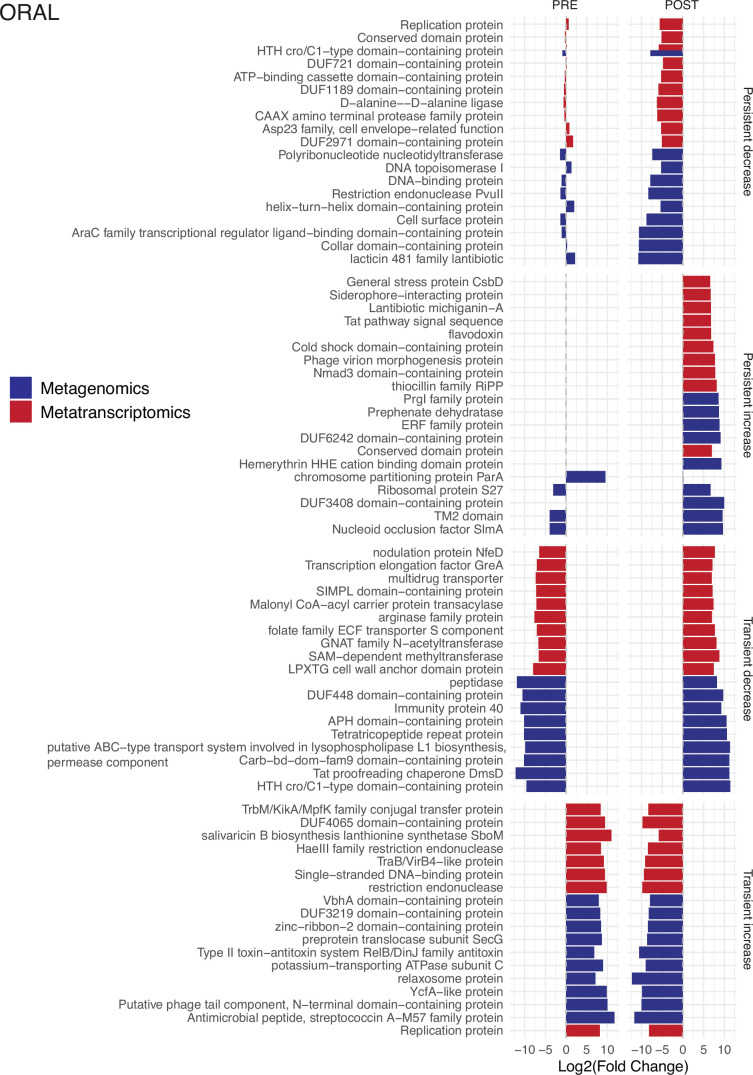
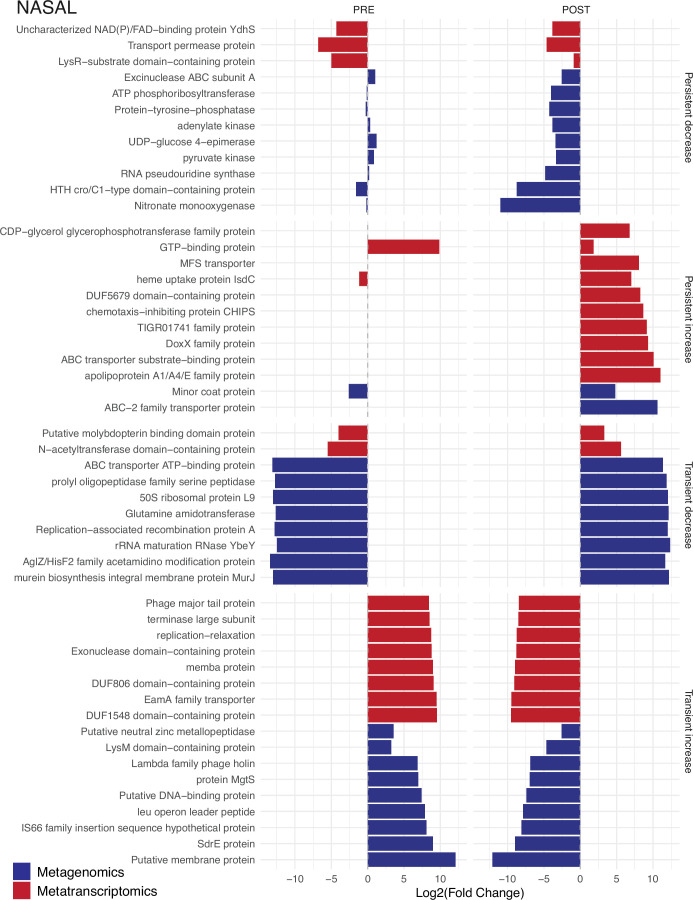
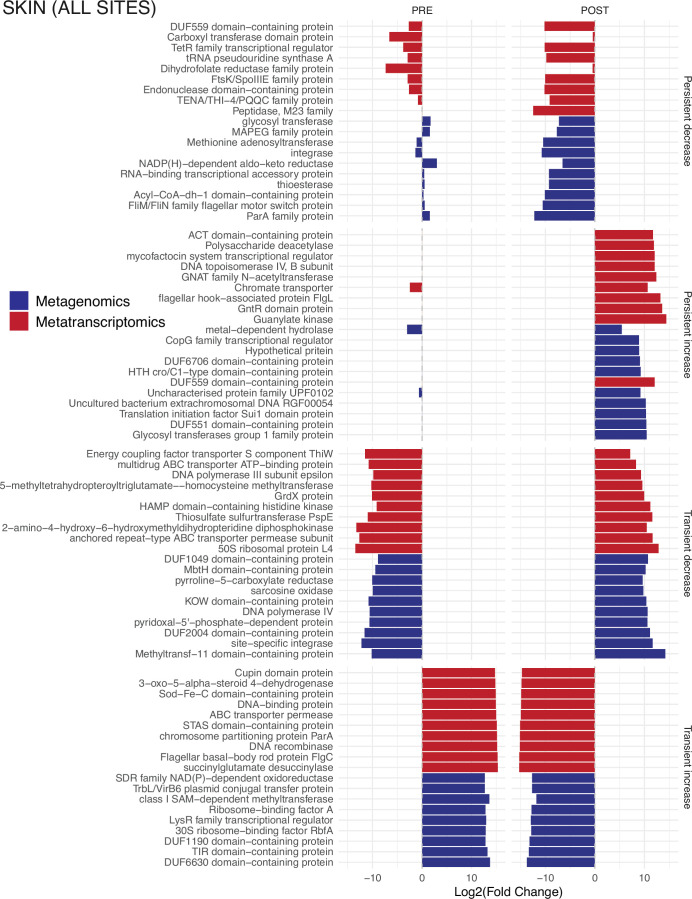
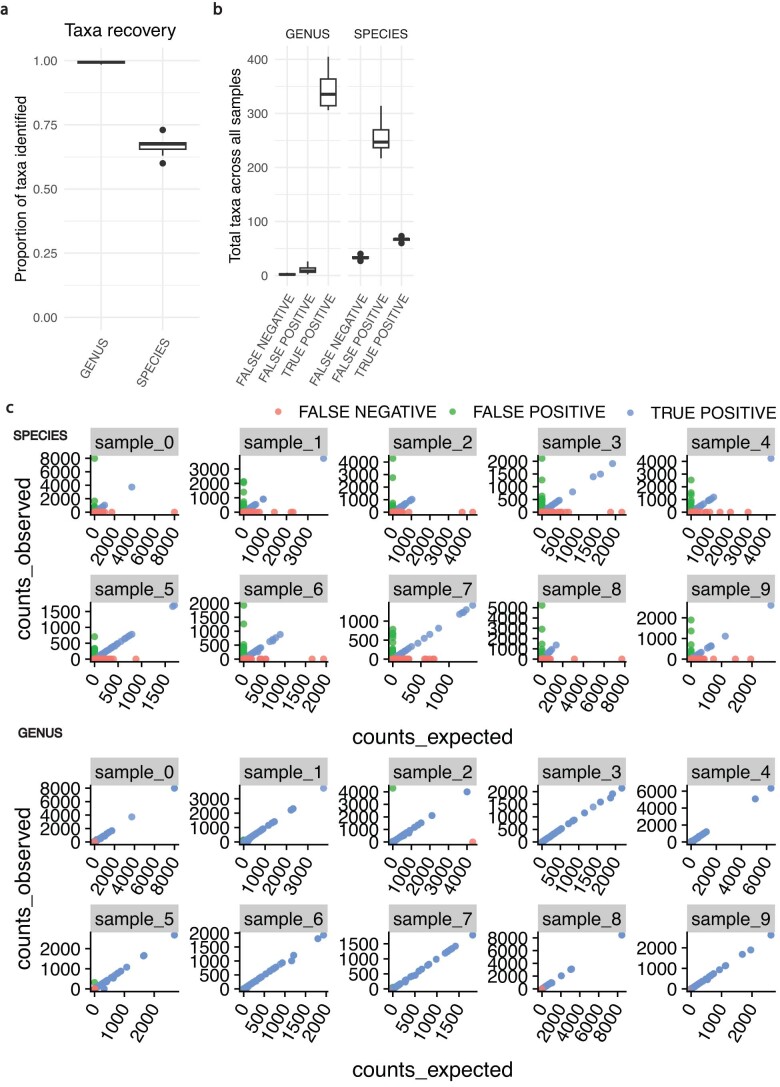
Maintenance of astronaut health during spaceflight will require monitoring and potentially modulating their microbiomes. However, documenting microbial shifts during spaceflight has been difficult due to mission constraints that lead to limited sampling and profiling. Here we executed a six-month longitudinal study to quantify the high-resolution human microbiome response to three days in orbit for four individuals. Using paired metagenomics and metatranscriptomics alongside single-nuclei immune cell profiling, we characterized time-dependent, multikingdom microbiome changes across 750 samples and 10 body sites before, during and after spaceflight at eight timepoints. We found that most alterations were transient across body sites; for example, viruses increased in skin sites mostly during flight. However, longer-term shifts were observed in the oral microbiome, including increased plaque-associated bacteria (for example, Fusobacteriota), which correlated with immune cell gene expression. Further, microbial genes associated with phage activity, toxin-antitoxin systems and stress response were enriched across multiple body sites. In total, this study reveals in-depth characterization of microbiome and immune response shifts experienced by astronauts during short-term spaceflight and the associated changes to the living environment, which can help guide future missions, spacecraft design and space habitat planning.


Conflict of interest statement

B.T.T. was compensated for consulting with Seed Health and Enzymetrics Biosciences on microbiome study design. R.D. and G.A.A.-G. are employees of Seed Health. C.E.M. is a co-founder of Cosmica Biosciences. E.E.A. is a consultant for Thorne HealthTech. G.M.C. has conflicts, detailed here: https://arep.med.harvard.edu/gmc/tech.html. J.F. and M.M. are employees of Tempus Labs. J.M., A.M.B., J.Z., B.R.L., A.A., S.K. and S.L. are employees of Element Biosciences, which sequenced a subset of samples used in this study. Unless otherwise mentioned, none of the companies listed had a role in conceiving, executing, or funding the work described here.

Figures

Fig. 1
Fig. 1. Overview of dataset and summary of changes.
a, Collection and analytic approach. Body swabs were collected from ten different sites, comprising three microbial ecosystems (oral, nasal, skin) around the body at eight different timepoints surrounding launch. These are referred to as L-92, L-44, L-3, FD2, FD3, R+1, R+45, R+82, where ‘L’ refers to pre-launch, ‘FD’ corresponds to flight day (that is, in-flight) and ‘R’ refers to return (that is, post-flight). Following collection and paired metagenomic/metatranscriptomic sequencing, samples were processed with a MAS to extract taxonomic (bacterial or viral) and functional features to determine their changes relative to flight. b, The time trajectories of persistently/transiently increased/decreased significant findings, filtering for strong associations (see Methods). Plots with one line had either no significant findings or none that met the filtering criteria. Grey shaded area indicates 95% confidence intervals. The orange shaded area refers to the samples collected while subjects were in orbit. c, Significant features by specific swabbing sites. Source data
Fig. 2
Fig. 2. The oral microbiome architecture of spaceflight.
The strongest associations between bacteria and flight for the oral microbiome. X axes are average log2 fold change (L2FC) of all pre-flight or post-flight timepoints compared to the average mid-flight abundances for a given taxon. Columns correspond to different association categories that are described visually by the example line plots on top of each one. Red bars refer to associations in metatranscriptomic data. Blue bars refer to associations in metagenomic data. Dashed grey vertical lines demarcate an L2FC of zero. Plotted taxa were selected by ranking significant features in each category and sequencing type (RNA/DNA) by L2FC and showing up to 15 at once. Source data
Fig. 3
Fig. 3. The skin microbiome and viral architecture of spaceflight.
a, The strongest associations between bacteria and flight for the skin microbiome. X axes are the average L2FC of all pre- or post-flight timepoints compared to the average mid-flight abundances for a given taxon. Columns correspond to different association categories that are described visually by the example line plots on top of each one. Dashed grey vertical lines demarcate an L2FC of zero. Plotted taxa were selected by ranking significant features in each category and sequencing type (RNA/DNA) by L2FC and showing up to 10 at once. b, Host and molecular type of viral genera associated with flight. Source data
Fig. 4
Fig. 4. Microbial propagation through the Dragon capsule and the crew.
a, Beta diversities for bacterial metagenomics. Heat map colour corresponds to average beta diversity, with black being the midpoint (0.5), blue being totally dissimilar (1.0) and grey being highly similar (0.0). Columns are hierarchically clustered. The interpretation for a single cell is for the crew member annotated on the right-hand side: the value encoded refers to the dissimilarity of that individual’s body site (as indicated on the column) to all other cells in that column (so the capsule and all other crew samples from the same site). For example, the bottom right cell indicates C004’s average forearm dissimilarity to all other crew member’s forearm swabs. b, Strain-sharing events between the crew and the capsule during the mid-flight timepoints. c, The number of strain-sharing events across time, where an event is defined as the detection of the same strain between two different swabbing locations. d, Organisms with at least two strain-sharing events detected within a given timepoint. Source data
Fig. 5
Fig. 5. The landscape of potential immune–microbiome associations related to spaceflight.
a, The total number of microbial features, by type, associated with different immune cell subtypes gene expression for those that were long-term increased (left) or decreased (right) after flight. b, The spaceflight-associated (increased in abundance or expression) bacteria and viruses that were associated with the greatest number of host genes. Viral genera are labelled ‘E’ for targeting a eukaryotic host and ‘P’ for targeting a prokaryote. If no definite host is known, no label was assigned. c, The spaceflight-associated microbial genes that were associated with the greatest number of host genes. We sorted for genes within each body site and selected the top 15 with the greatest number of human gene associations. The legend at the bottom of a is relevant for all figures where those colours appear. Source data
Extended Data Fig. 1
Extended Data Fig. 1. Data processing workflow and summary statistics.
a) After quality-controlling reads, we executed two different, parallel, workflows to identify the microbial taxa and genes that comprised each sample. We used seven different algorithmic approaches (Xtree, MetaPhlAn4/StrainPhlAn4, Phanta, Kraken2 with multiple parameter settings) and four different databases to classify short reads into different taxonomic categories (bottom left). We also did a de novo assembly analysis to identify the abundance of non-redundant genes/functions as well as Metagenome-Assembled bacterial and viral genomes. We executed all regression analyses for every resultant abundance matrix across the taxonomic ranks ranging from species to phylum. b) Counts and percentages of reads aligning to the human reference genome. c) Aligned reads by taxonomic classification method. For metagenomics, N per column is 385 biologically independent samples, for metatranscriptomics, N is 365 biologically independent samples. These numbers correspond to all microbiome samples collected. Lines on box plots indicate minimum and maximum values. The median is the centerline, and the bounds of the box are the interquartile range. The whiskers extend to 1.5 times the interquartile range of the upper and lower quartiles. Source data
Extended Data Fig. 2
Extended Data Fig. 2. Null model results.
Similarity between FDR-significant associations fit with mixed versus generalized linear models (sans a random effect). Source data
Extended Data Fig. 3
Extended Data Fig. 3. Supplemental Microbiome Association Study output.
a) The total number of features (bacterial species, viral genera, or genes) found to be statistically associated with either pre- or post-flight timepoints across sequencing methods. Features are grouped by the categories laid out in the Methods regarding the nature of their changes relative to flight b–c) The time trajectories of persistently/transiently increased/decreased significant findings split by body site, filtering for strong [see Methods] associations. Plots with one or no lines had either no significant findings or none that met the filtering criteria. Gray shaded area indicates 95% confidence intervals. Source data
Extended Data Fig. 4
Extended Data Fig. 4. Regression results by specific body sites.
Regression results across short-read taxonomic classification methods. Source data
Extended Data Fig. 5
Extended Data Fig. 5. Similarity of regression output by body site.
Degree of overlap in the identity of significant bacterial and viral features as a function of body site and sequencing type. Source data
Extended Data Fig. 6
Extended Data Fig. 6. The functional response of the microbiome to spaceflight.
a) COG categories of all genes associated with flight. b) Groups of specific protein products that were associated with spaceflight. The legend in the black box is relevant for all figures where those colors appear. Source data
Extended Data Fig. 7
Extended Data Fig. 7. Gene level analysis, oral microbiome.
The strongest associations between genes and flight for the oral microbiome. X-axes are the average L2FC of all pre- or post-flight timepoints compared to the average mid-flight abundances for a given taxon. Columns correspond to different association categories that are described visually by the example line plots on top of each one. Dotted, gray, horizontal lines demarcate an L2FC of zero. Plotted taxa were selected by ranking significant features in each category by L2FC and showing up to 10 at once. Source data
Extended Data Fig. 8
Extended Data Fig. 8. Gene level analysis, nasal microbiome.
The strongest associations between genes and flight for the nasal microbiome. X-axes are the average L2FC of all pre- or post-flight timepoints compared to the average mid-flight abundances for a given taxon. Columns correspond to different association categories that are described visually by the example line plots on top of each one. Dotted, gray, horizontal lines demarcate an L2FC of zero. Plotted taxa were selected by ranking significant features in each category by L2FC and showing up to 10 at once. Source data
Extended Data Fig. 9
Extended Data Fig. 9. Gene level analysis, skin microbiome.
The strongest associations between genes and spaceflight for the skin microbiome. X-axes are the average L2FC of all pre- or post-flight timepoints compared to the average mid-flight abundances for a given taxon. Columns correspond to different association categories that are described visually by the example line plots on top of each one. Dotted, gray, horizontal lines demarcate an L2FC of zero. Plotted taxa were selected by ranking significant features in each category by L2FC and showing up to 10 at once. Source data
Extended Data Fig. 10
Extended Data Fig. 10. Viral classifier benchmarking.
Benchmarking a viral classifier across taxonomic ranks. Synthetic viral communities were generated from 100 genomes at random levels of abundance (from the GenBank database used in the rest of this study). a) The number of recovered genomes out of 100, for 10 mock communities for the genus and species levels. N = 10 independently generated mock communities. b) The number of true positive (identified and present in the sample), false positive (identified but not present in the sample), and false negative (that is, not recovered) genomes for the genus and species levels. N = 10 independently generated mock communities. c) The correlation between observed and expected read counts for each taxon as a function of being a true positive, false positive, or false negative. Lines on box plots in A and B indicate minimum and maximum values. The median is the centerline, and the bounds of the box are the interquartile range. The whiskers extend to 1.5 times the interquartile range of the upper and lower quartiles. Source data

Update of

References

    1. Jennings RT, et al. Medical qualification of a commercial spaceflight participant: not your average astronaut. Aviat. Space Environ. Med. 2006;77:475–484. - PubMed
    1. Stepanek J, Blue RS, Parazynski S. Space medicine in the era of civilian spaceflight. N. Engl. J. Med. 2019;380:1053–1060. doi: 10.1056/NEJMra1609012. - DOI - PubMed
    1. Iovino P, et al. Gastrointestinal function in simulated space flight microgravity. Dig. Liver Dis. 2009;41:S140. doi: 10.1016/S1590-8658(09)60368-6. - DOI
    1. Smith SM, Uchakin PN, Tobin BW. Space flight nutrition research: platforms and analogs. Nutrition. 2002;18:926–929. doi: 10.1016/S0899-9007(02)00904-8. - DOI - PubMed
    1. Turroni S, et al. Gut microbiome and space travelers’ health: state of the art and possible pro/prebiotic strategies for long-term space missions. Front. Physiol. 2020;11:553929. doi: 10.3389/fphys.2020.553929. - DOI - PMC - PubMed

LinkOut - more resources