. 2024 Jun 11;7(1):721.
doi: 10.1038/s42003-024-06389-x.

Multi-omics analysis reveals the dynamic interplay between Vero host chromatin structure and function during vaccinia virus infection

Affiliations

Multi-omics analysis reveals the dynamic interplay between Vero host chromatin structure and function during vaccinia virus infection

Vrinda Venu et al. Commun Biol. .

Abstract

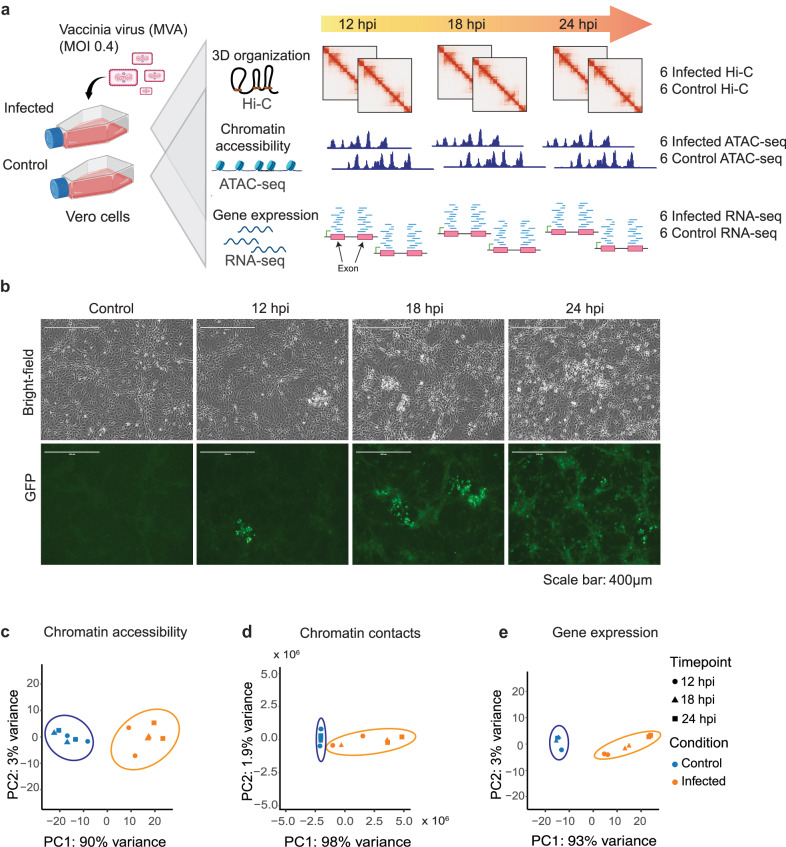
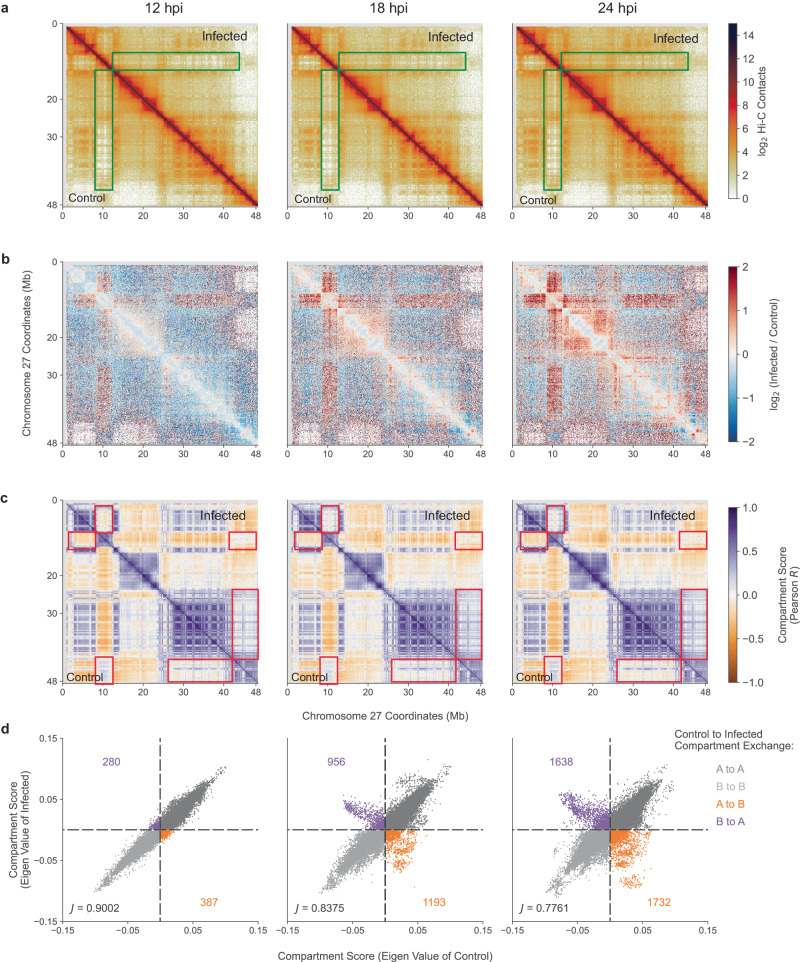
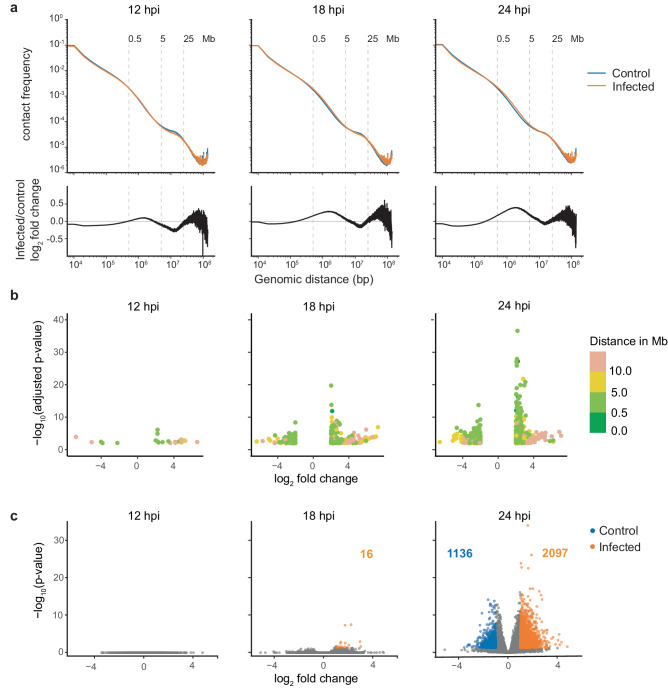
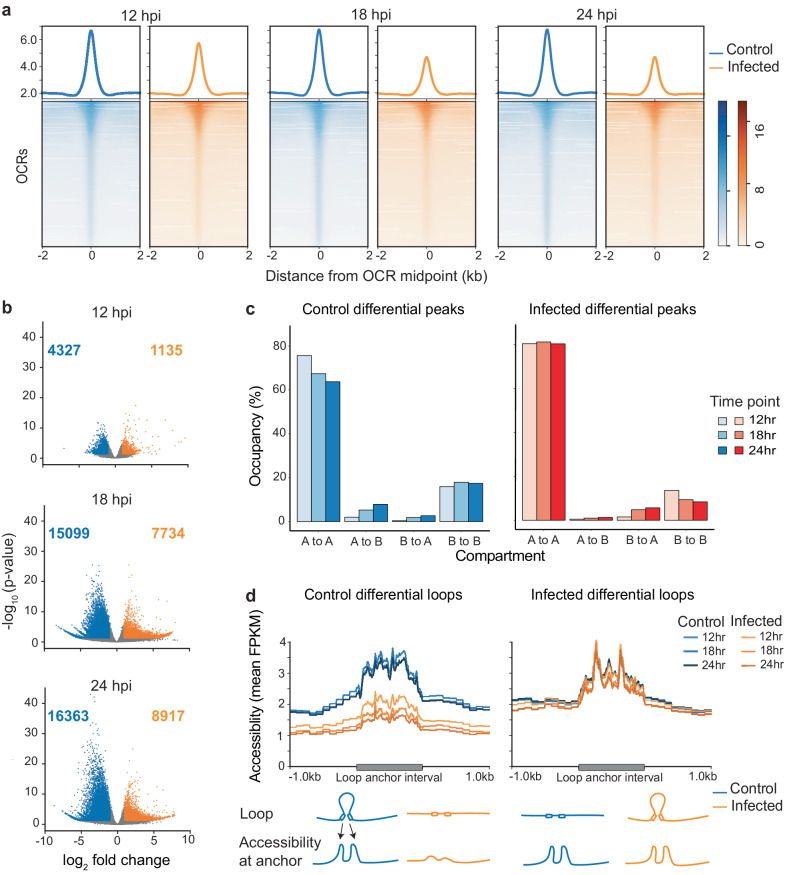
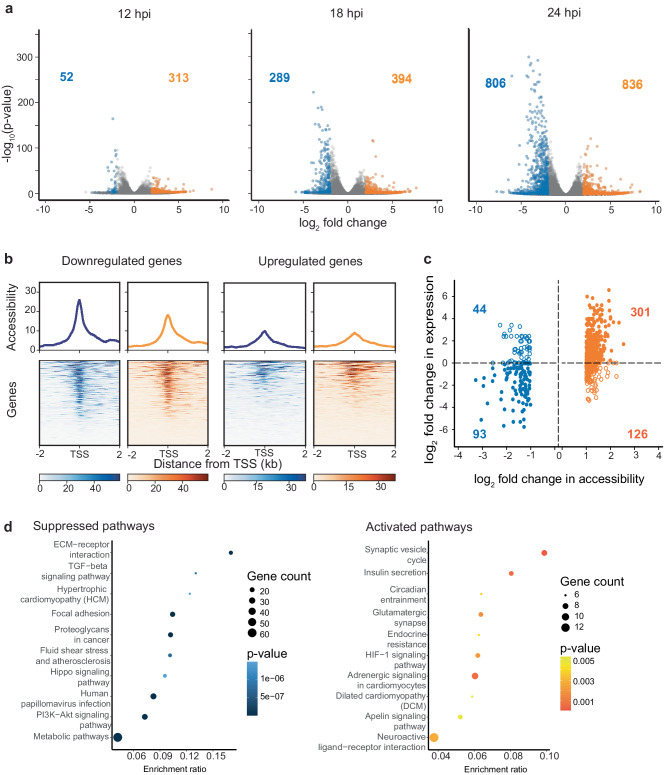
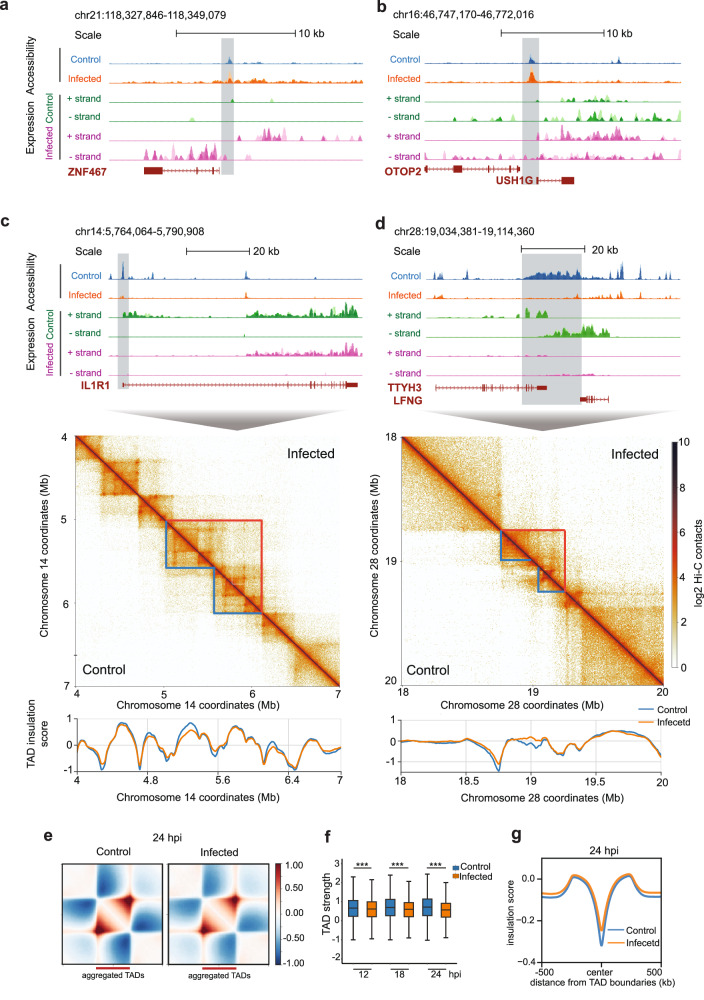
The genome folds into complex configurations and structures thought to profoundly impact its function. The intricacies of this dynamic structure-function relationship are not well understood particularly in the context of viral infection. To unravel this interplay, here we provide a comprehensive investigation of simultaneous host chromatin structural (via Hi-C and ATAC-seq) and functional changes (via RNA-seq) in response to vaccinia virus infection. Over time, infection significantly impacts global and local chromatin structure by increasing long-range intra-chromosomal interactions and B compartmentalization and by decreasing chromatin accessibility and inter-chromosomal interactions. Local accessibility changes are independent of broad-scale chromatin compartment exchange (~12% of the genome), underscoring potential independent mechanisms for global and local chromatin reorganization. While infection structurally condenses the host genome, there is nearly equal bidirectional differential gene expression. Despite global weakening of intra-TAD interactions, functional changes including downregulated immunity genes are associated with alterations in local accessibility and loop domain restructuring. Therefore, chromatin accessibility and local structure profiling provide impactful predictions for host responses and may improve development of efficacious anti-viral counter measures including the optimization of vaccine design.


Conflict of interest statement

The authors declare no competing interests.

Figures

Fig. 1
Fig. 1. Infection model system reveals changes in chromatin architecture, accessibility, and gene expression over time.
a Schematic representation of the experimental design where Modified Vaccinia virus Ankara (MVA) was used to infect Vero cells with an MOI of 0.40. Figure cartoon created with Biorender. Vero cells cultivated in the same flask were divided for Hi-C, ATAC-seq, and RNA-seq experiments to provide paired data sets for direct comparison. Cells from mock-infected (control) and MVA-infected cultures were collected at 12, 18, and 24 hours post infection (hpi) with two biological replicates each. A total of 12 Hi-C libraries, 12 ATAC-seq libraries, and 12 RNA-seq libraries were prepared. b Infection efficiency was verified by immunofluorescence using an anti-vaccinia virus monoclonal antibody (green). Cell density and morphology can be seen in the bright-field images. c Principal component analysis of genome-wide chromatin accessibility from ATAC-seq data, d Chromatin contacts from Hi-C sequencing data, e Gene expression levels from RNA-seq data demonstrate clear separation between mock-infected control and MVA-infected cultures.
Fig. 2
Fig. 2. Modified Vaccinia virus Ankara (MVA) infection induced progressive changes in Vero host chromatin 3D architecture.
a Hi-C contact matrices of chromosome 27 in mock-infected control (lower diagonal region) versus MVA-infected (upper diagonal region) cells at 12, 18, and 24 hours post infection (hpi). Green boxes indicate regions with pronounced contact differences between control and MVA-infected cells, where the bin size is 100 kb. b Differential (infected/control) contact matrices of chromosome 27 across all three time points are shown at 100 kb resolution. Blue indicates control-biased contacts, where more contacts were observed in control cells, and red indicates infection-biased contacts, where more contacts were observed in MVA-infected cells. c) Pearson correlation matrix of chromosome 27 in mock-infected control (lower diagonal region) versus MVA-infected (upper diagonal region) cells, where bin size is 100 kb. Red boxes highlight the regions with altered compartmentalization. d Scatterplots demonstrating replicate averaged compartment scores (eigen value) of control vs infected cells in 100 kb bins across the genome at all three time points. Off-diagonal points represents the compartment exchange events, where orange indicates A to B compartment exchange and purple indicates B to A compartment exchange. Counts of compartment exchange are annotated along the off diagonal. The Jaccard index is annotated in the bottom left and measures the overlap between compartment assignments between mock-infected control and MVA-infected scores.
Fig. 3
Fig. 3. MVA infection predominantly alters mid- to long-range chromatin interactions.
a Contact frequency in control (blue) and MVA-infected (orange) cells as a function of genomic distance in log scale is plotted for all three time points; replicates are combined. Bottom panel: log2 fold change in contact frequency between control and infected cells is plotted as a function of genomic distance in log scale. b Genomic regions with significant differences in the number of contacts between mock-infected control and MVA-infected cultures were identified using multiHiCcompare at 100 kb resolution and plotted as log2 fold change in contact frequency (x-axis) and negative log10 adjusted p-value (y-axis). Color scale annotates the distance between contacting regions. Points in the positive axis represent infection-biased regions (more contacts due to MVA-infection than in control) and points in the negative axis represent control-biased regions. c Volcano plots represent identified differential loops between control and MVA-infected cells at all three time points. Gray dots represent all called differential loops where significant (adjusted p-value < 0.05) control-biased loops (log2 fold change < -1) are shown in blue and infection-biased loops (log2 fold change > 1) are shown in orange.
Fig. 4
Fig. 4. A global decrease in chromatin accessibility in response to viral infection.
a Chromatin accessibility across consensus open chromatin regions (OCRs) is plotted for each time point 12, 18, and 24 hours post infection (hpi), where blue indicates mock-infected control cells and orange indicates MVA-infected cells. The ATAC-seq reads from all biological replicates are combined. The normalized average read count profile is plotted in the top panel, while the bottom panel shows the normalized read count per OCR, where each row represents one consensus OCR. Read counts were determined at ± 2 kb region around all consensus OCRs. b Volcano plots demonstrate differentially accessible OCRs between mock-infected control and MVA-infected cells at each time point (12, 18 and 24 hpi). Gray dots represent all OCRs. Blue dots indicate significantly different (adjusted p value < 0.05) control-biased OCRs (log2 fold change < −1), while orange dots indicate significantly different infection-biased OCRs (log2 fold change > 1). Control-biased OCRs are regions that are accessible in control cells, while infection-biased OCRs are regions that are accessible in infected cells. c Bar plots depict the percentage overlap between mock-infected control (left) and MVA-infected (right) biased differential OCRs and various compartment categories at all three time points. d Time- and condition-wise chromatin accessibility (replicate combined normalized ATAC-seq read pileup) across control-biased (left) and infection-biased (right) loop anchor intervals ± 1 kb is plotted in the top panel. A schematic describing the observed relationship between loop anchor points and accessibility is shown in the bottom panel.
Fig. 5
Fig. 5. MVA infection induced gene expression changes and moderately correlates with local chromatin accessibility.
a Volcano plots demonstrate differentially expressed genes between mock-infected control and MVA-infected Vero cells at each time point: 12, 18, and 24 hpi. Gray dots represent all genes. Blue dots indicate significantly different (adjusted p value < 0.05) down regulated genes (log2 fold change < −2), while orange dots indicate significantly upregulated genes (log2 fold change > 2). b Chromatin accessibility around TSS (± 2000 bp) of strongly downregulated (left two panels) and upregulated (right two panels) genes at 24 hpi is plotted. Blue indicates accessibility data from mock-infected control Vero cells and orange indicates MVA-infected cells. The ATAC-seq reads from all biological replicates at 24 hpi are combined. The normalized average read count profile is plotted in the top panel, while the bottom panel shows the normalized read count around TSS where each row represents one consensus gene. c Log2 fold change in accessibility at promoter-annotated OCRs (OCRs overlapping with TSS ± 500 bp) vs log2 fold change in expression in corresponding genes is plotted. OCRs accessible in control cells are shown in the negative x-axis (blue colored) and OCRs accessible in MVA-infected cells are shown in the positive x-axis (orange colored). Positive fold change in gene expression indicates upregulated genes in infected cells and vice versa. d Top gene regulatory pathways that are affected by MVA infection predicted by Kegg Orthology analysis of differentially expressed genes. Top 10 suppressed pathways (left panel) and activated pathways (right panel) are shown in the decreasing order of their gene enrichment ratio.
Fig. 6
Fig. 6. Functional responses correlate with changes in chromatin architecture and accessibility.
a, b ATAC-seq and RNA-seq signal tracks from 24 hpi at example regions with infection-biased accessibility and gene expression are shown. Replicate signals are overlaid. Blue: accessibility in mock-infected control cells, Orange: accessibility in MVA-infected cells, Green: control gene expression, Purple: infected gene expression. c, d ATAC-seq and RNA-seq signal tracks from 24 hpi at example regions with control-biased accessibility and gene expression are shown in the top panel (color scheme the same as a and b). The corresponding Hi-C contact heat map of a larger region including the corresponding differential accessible window is shown in the middle panel. Control and MVA-infected contacts are shown in the lower and upper diagonal parts of the figure, respectively. Blue and orange markings highlight contact domains with increased mixing in MVA-infected cells. The TAD insulation score for the corresponding region is shown in the bottom panel. Control (blue) and infected (orange) TAD insulation scores are overlaid. e Control (left) and infected (right) average log2 observed over expected contact frequency within scaled aggregated TADs at 24 hpi are shown as heatmaps. TAD location is denoted by the maroon bar and additional same sized flanking regions are included on both sides. f Comparison of TAD strength between control and infected cells at all three timepoints shows significant weakening of infected TADs. Welch two sample two-tailed t test p value: 5.053e-11, < 2.2e-16, < 2.2e-16 and df 25224, 23776, 26407 respectively at 12, 18, and 24 hpi. The central horizontal line in box plot mark median TAD strength per category. Outliers are omitted from the plot. g A profile plot of insulation scores (control: blue, infected: orange) computed from all TAD boundary midpoints ± 500 kb region identified at 24 hpi.

Similar articles

Cited by

References

    1. Rao SS, et al. A 3d map of the human genome at kilobase resolution reveals principles of chromatin looping. Cell. 2014;159:1665–1680. doi: 10.1016/j.cell.2014.11.021. - DOI - PMC - PubMed
    1. Misteli T. Beyond the sequence: cellular organization of genome function. Cell. 2007;128:787–800. doi: 10.1016/j.cell.2007.01.028. - DOI - PubMed
    1. Keizer VIP, et al. Live-cell micromanipulation of a genomic locus reveals interphase chromatin mechanics. Science. 2022;377:489–495. doi: 10.1126/science.abi9810. - DOI - PubMed
    1. Meijering AEC, et al. Nonlinear mechanics of human mitotic chromosomes. Nature. 2022;605:545–550. doi: 10.1038/s41586-022-04666-5. - DOI - PMC - PubMed
    1. Hnisz D, Shrinivas K, Young RA, Chakraborty AK, Sharp PA. A phase separation model for transcriptional control. Cell. 2017;169:13–23. doi: 10.1016/j.cell.2017.02.007. - DOI - PMC - PubMed

Publication types