. 2024 Jun 11;7(1):692.
doi: 10.1038/s42003-023-05213-2.

Spaceflight induces changes in gene expression profiles linked to insulin and estrogen

Affiliations

Spaceflight induces changes in gene expression profiles linked to insulin and estrogen

Begum Aydogan Mathyk et al. Commun Biol. .

Abstract

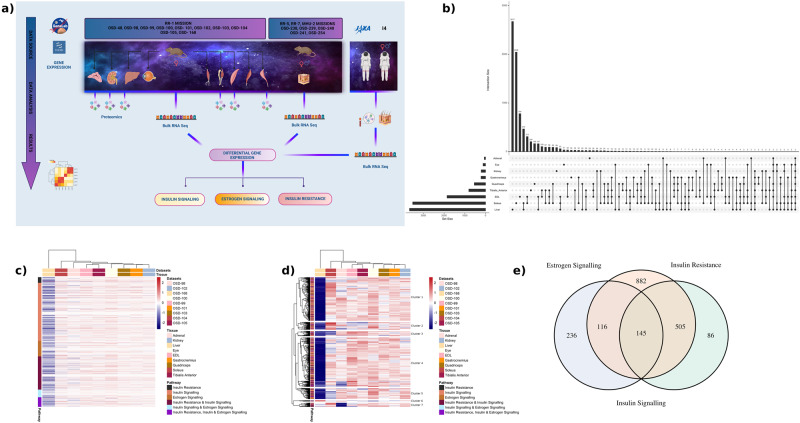
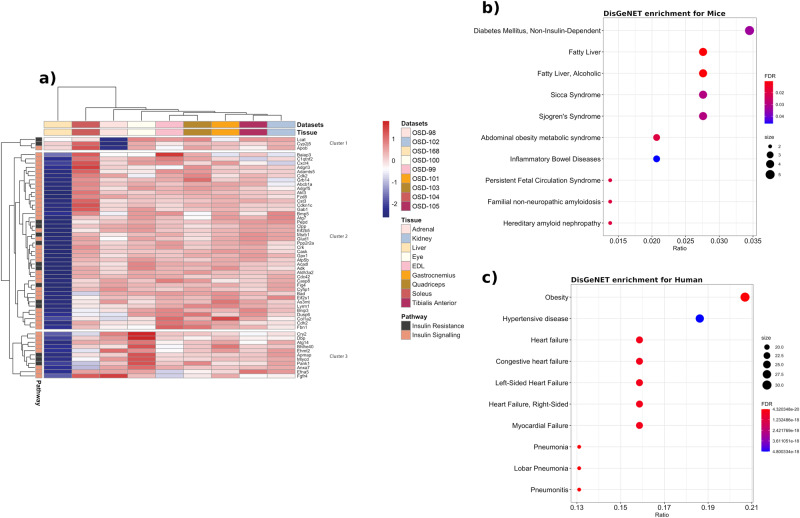
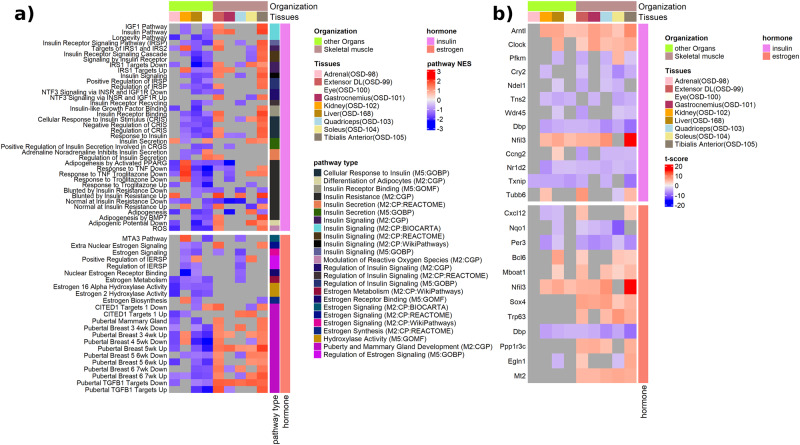
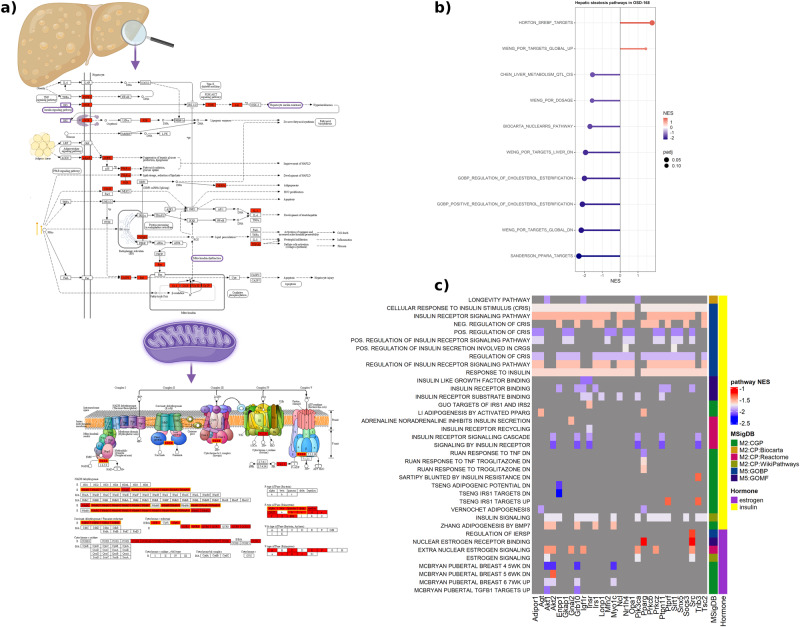
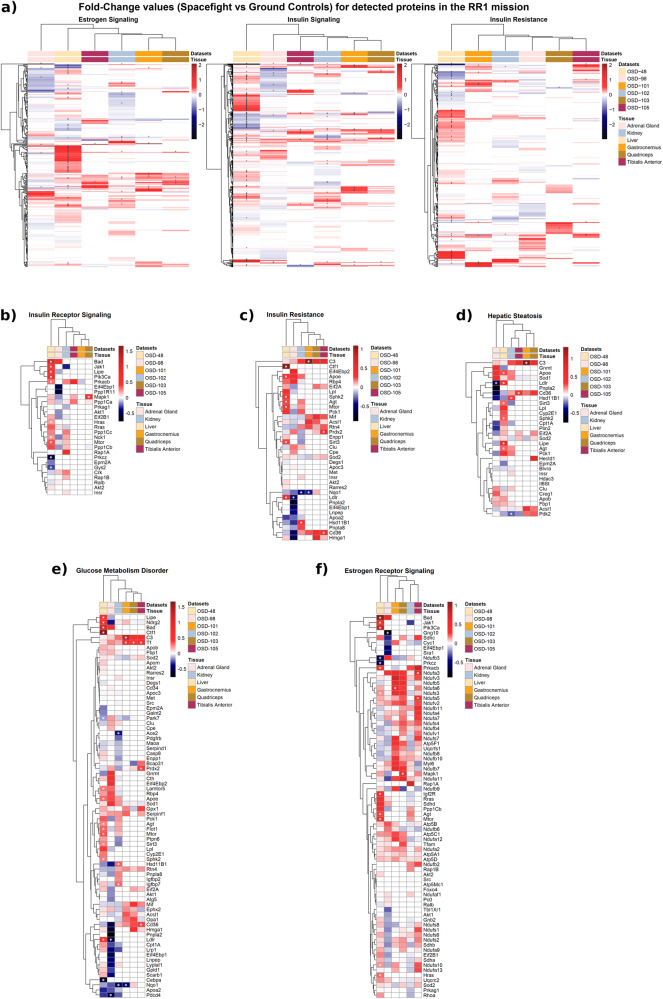
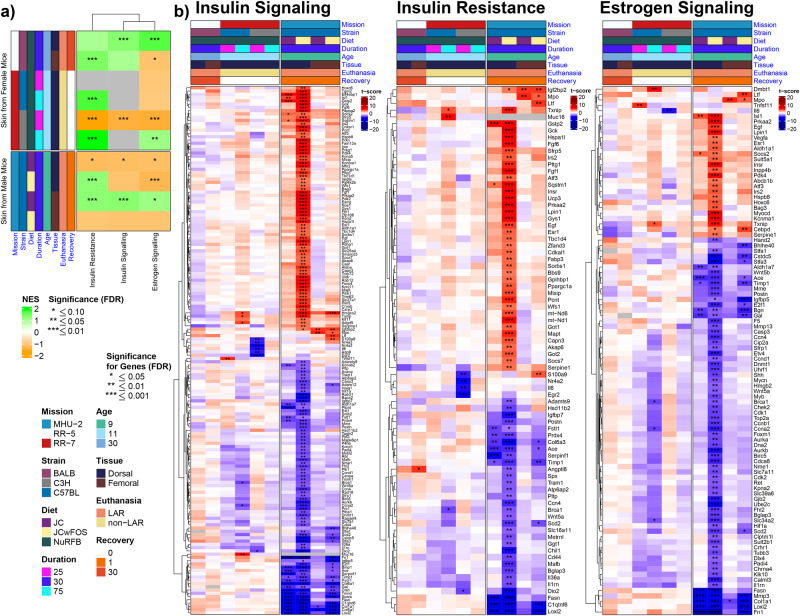
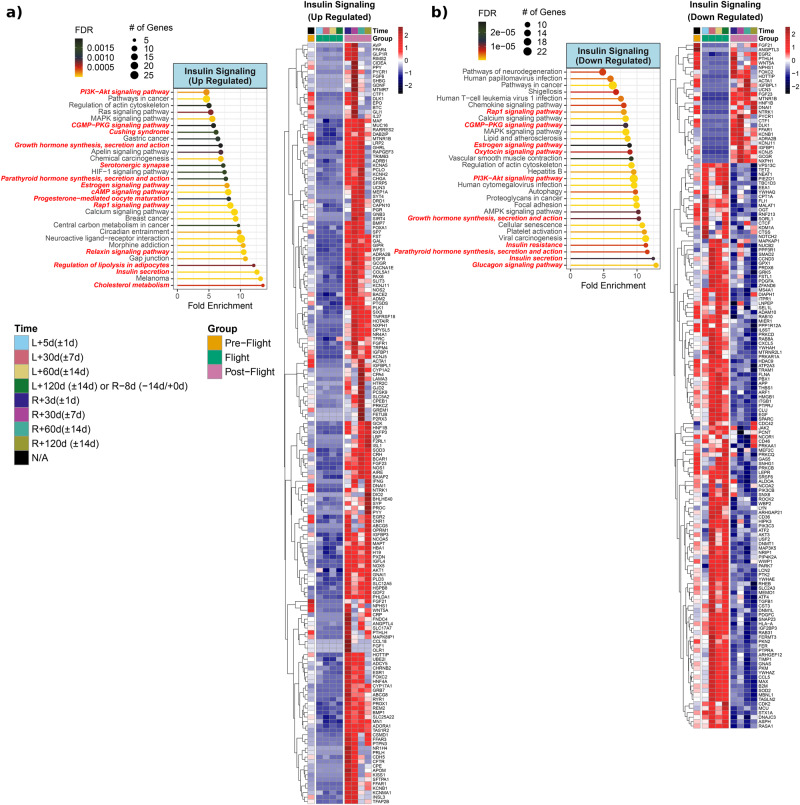
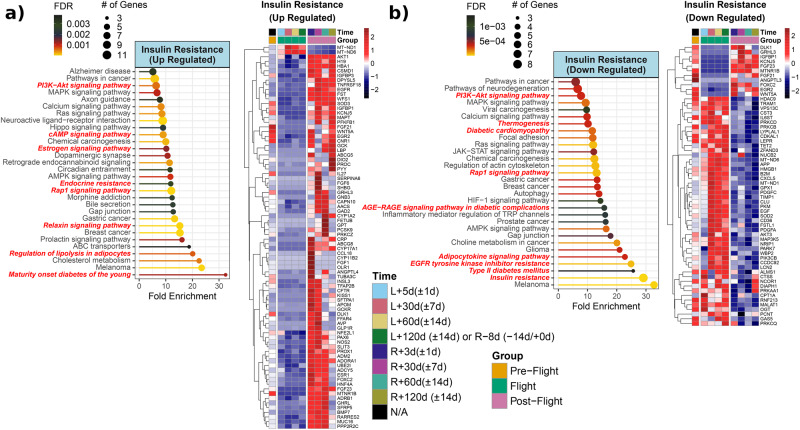
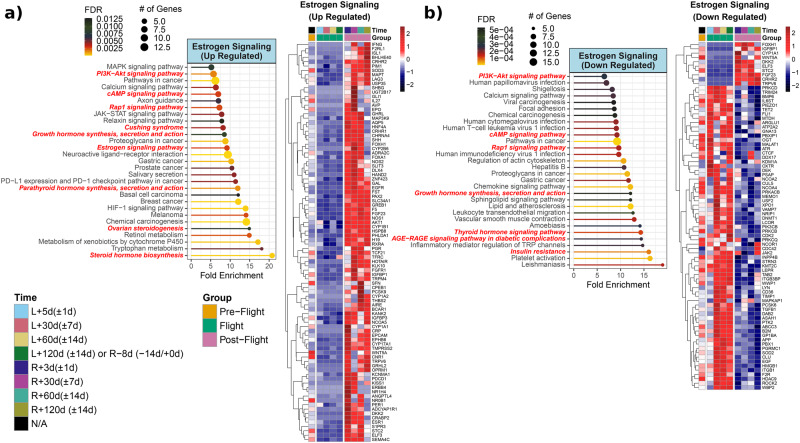
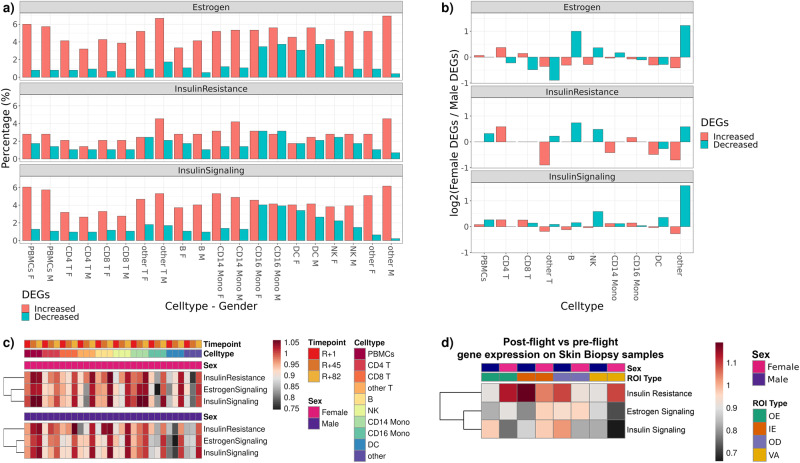
Organismal adaptations to spaceflight have been characterized at the molecular level in model organisms, including Drosophila and C. elegans. Here, we extend molecular work to energy metabolism and sex hormone signaling in mice and humans. We found spaceflight induced changes in insulin and estrogen signaling in rodents and humans. Murine changes were most prominent in the liver, where we observed inhibition of insulin and estrogen receptor signaling with concomitant hepatic insulin resistance and steatosis. Based on the metabolic demand, metabolic pathways mediated by insulin and estrogen vary among muscles, specifically between the soleus and extensor digitorum longus. In humans, spaceflight induced changes in insulin and estrogen related genes and pathways. Pathway analysis demonstrated spaceflight induced changes in insulin resistance, estrogen signaling, stress response, and viral infection. These data strongly suggest the need for further research on the metabolic and reproductive endocrinologic effects of space travel, if we are to become a successful interplanetary species.


Conflict of interest statement

The authors declare no competing interests.

Figures

Fig. 1
Fig. 1. Unique differentially expressed genes across tissues in mice.
a Graphical abstract showing the samples and analysis created in BioRender. b UpSet plot showing the number of differentially expressed genes (FC cutoff of 1.2 and p-adj<0.05) that are unique to each tissue and overlapping different tissues. The liver had the highest number of unique genes while adrenal had the lowest. The two genes that were common across all nine tissues were related to circadian rhythm and insulin signaling. c Global gene level heatmap of 1970 unique genes from NCBI curated gene list which are common across insulin resistance, insulin signaling and estrogen signaling pathways. Genes are the rows and columns are the nine tissues analyzed from the RR1 mission. Genes were further divided into being unique to only one of these pathways or a combination of the pathways. Heatmap shows the z-scores of logFC values from the nine tissues and the tissues are clustered using hierarchical clustering. Liver was the most affected with genes being downregulated across all pathways when comparing flight vs pre-flight. d Heatmap of 645 unique genes from NCBI curated gene list which have log fold change values across all 9 tissues. Hierarchical clustering of genes shows clusters being related to GO biological processes relevant to insulin resistance, insulin signaling and estrogen signaling (Fig. S1). e Venn diagram of insulin resistance, insulin signaling and estrogen signaling pathways with their corresponding unique and overlapping genes from the NCBI curated gene list. There are a total of 145 genes that are common across all three pathways.
Fig. 2
Fig. 2. Insulin resistance, insulin and estrogen signaling related genes and diseases.
a Heatmap for 56 out of 145 common genes across the insulin resistance and insulin signaling pathways for which there were gene expression values across all nine tissues. b Disease enrichment plot showing top 10 diseases from mouse genome database (MGD) being enriched using 145 unique genes common across insulin resistance, insulin signaling and estrogen signaling. The y axis shows the disease labels and the x axis shows the ratio of disease relevant genes to the total number of genes found from the 145 genes that were present in MGD. The dots in the enrichment plots are colored by the FDR values and the sizes of the dots indicate the number of genes found to be enriched for a disease. Diabetes and fatty liver are the top two enriched diseases which are related to estrogen and insulin signaling. c Disease enrichment plot is shown with top 10 diseases from human curated sources (e.g., UniProt, ClinGen) using species relevant genes out of 145 genes from the NCBI list. Obesity and fatty liver are the top two enriched diseases which are also related to estrogen and insulin signaling.
Fig. 3
Fig. 3. Gene set enrichment analysis of insulin and estrogen pathways.
a A heatmap of the normalized enrichment scores (NES) of estrogen and insulin pathways impacted by spaceflight in datasets of RR-1 mission samples. The dark gray locations in the heatmap indicate missing values for the NES, resulting from off-range adjusted p-values (padj) at which the NES is obtained. The assumed range is padj < 0.3. A positive NES indicates activation of the pathways, while at negative NES the pathway is inhibited. In the pathways, the full meaning of CRGS is ‘Cellular Response to Glucose Stimulus’; and the full meaning of IERSP is ‘Intracellular Estrogen Receptor Signaling Pathway’. The pathways are categorized into several types, and the MSigDB database from which the pathway is sourced is indicated in parentheses. b A heatmap of the t-score of the overlapping leading-edge pathway genes across the datasets of the RR-1 mission samples. The dark gray locations in the heatmap indicate the absence of a value for the t-score, resulting from off-range adjusted p-values (padj) at which the t-score is obtained. The assumed range is padj < 0.05. The leading-edge genes are the genes that contribute to the GSEA predicted pathways. The overlapping leading-edge genes are commonly leading-edge genes to at least four of the datasets.
Fig. 4
Fig. 4. Hepatic steatosis in mice liver.
a The hepatic steatosis canonical pathway with the significantly regulated genes for liver tissue from mice flown to space compared to ground control mice. The lower panel is the mitochondrial complexes and the significantly regulated genes involved visualized by ShinyGo v0.76.3 and KEGG pathway diagrams. The boxes highlighted in yellow indicate genes related to estrogen receptor signaling. Panel was created in BioRender. b Lollipop plot illustrating the normalized enrichment scores (NES) of hepatic steatosis pathways in OSD-168 (liver tissue). Only pathways with a NES obtained at an adjusted p-value <0.3 (padj < 0.3) are shown. c An illustration of common leading-edge genes across pathways of insulin and estrogen in a heatmap of the normalized enrichment scores (NES) of the pathways impacted by spaceflight in OSD-168 (liver tissue). Only pathways with NES at padj < 0.3 are shown, and only genes that are among leading edge genes seven (7) or more of the pathways are shown.
Fig. 5
Fig. 5. Quantitative proteomics screening of different tissues from the RR1 mission samples.
a Heatmaps for logFC (Flight vs. Ground) of proteins across the estrogen signaling, insulin signaling, and insulin resistance pathways. Normalized protein intensity values were used to calculate the logFC through the Limma package. Columns represent datasets from different tissues in the RR1 missions, and rows correspond to proteins. The gray cells in the heatmap indicate missing values. Asterisks (*) overlaying cells denote statistical significance (p-value < 0.05). Liver displayed the most protein abundance changes across these pathways. Protein abundance changes for (b) insulin receptor signaling, (c) insulin resistance, (d) hepatic steatosis, (e) glucose metabolism disorders, and (f) estrogen receptor signaling, were also depicted in different heatmaps. All 0 values for bf are for proteins which were not present in the data.
Fig. 6
Fig. 6. Insulin and estrogen signaling, insulin resistance pathways in skin rodent samples.
a Pathway enrichment heatmap. Heatmap of normalized enrichment scores for insulin resistance, insulin signaling, and estrogen signaling pathways in spaceflight vs ground control comparisons of murine skin. Columns represent pathways, while rows represent datasets from multiple spaceflight missions, split by biological sex. Asterisks (*) overlaying cells denote statistical significance. b Gene-level heatmaps (one for each pathway). Heatmap of t-scores for highly significant (FDR ≤ 0.01) differentially expressed genes associated with the insulin and estrogen signaling as well as insulin resistance. Columns represent datasets from multiple spaceflight missions, and rows correspond to genes. Asterisks (*) overlaying cells denote statistical significance; genes must be significant in at least one of the datasets to be displayed.
Fig. 7
Fig. 7. Insulin Signaling linked genes and pathways from JAXA Cell-Free Epigenome (CFE).
a Heatmap of the significantly upregulated genes compared to pre-flight for either flight or post-flight of normalized plasma cell-free RNA expression values and associated pathways for insulin signaling over time for the six astronauts over 120 days in space from JAXA study. The values shown on are the averaged normalized expression values for all six astronauts each time point during flight and post-flight. The four pre-flight time points were averaged together, since the changes for genes in the time leading up to flight are considered to be the same and part of the baseline values. For the time, L = Launch (i.e., meaning time after launch from Earth and length in space) and R = Return to Earth. Based on heatmap, pathway analysis performed using ShinyGO to reveal the top 30 pathways (FDR < 0.05) being regulated for postflight upregulated insulin linked genes. The red bold font texts are the pathways that are directly known to regulate the insulin pathway in the pathway figure. b Heatmap and associated pathways showing insulin signaling linked downregulated genes in postflight or flight vs preflight. Based on heatmap, pathway analysis performed using ShinyGO to reveal which pathways are being regulated for downregulated insulin linked genes. The pathways and lollipop plots demonstrate top 30 pathways (based on FDR). The red bold font texts are the pathways that are directly known to regulate the insulin pathway in the pathway figure.
Fig. 8
Fig. 8. Insulin Resistant linked genes and pathways from JAXA Cell-Free Epigenome (CFE).
a Heatmap of the significantly upregulated genes compared to pre-flight for either flight or post-flight of normalized plasma cell-free RNA expression values and associated pathways for insulin resistant over time for the six astronauts over 120 days in space from JAXA study. The values shown on are the averaged normalized expression values for all six astronauts each time point during flight and post-flight. The four pre-flight time points were averaged together, since the changes for genes in the time leading up to flight are considered to be the same and part of the baseline values. For the time, L = Launch (i.e., meaning time after launch from Earth and length in space) and R = Return to Earth. Based on heatmap, pathway analysis performed using ShinyGO to reveal the top 30 pathways (FDR < 0.05) being regulated for postflight upregulated insulin-resistant linked genes. The red bold font texts are the pathways that are directly known to regulate the insulin pathway in the pathway figure. b Heatmap and associated pathways showing insulin resistant linked downregulated genes in postflight or flight vs preflight. Based on heatmap, pathway analysis performed using ShinyGO to reveal which pathways are being regulated for downregulated insulin-linked genes. The pathways and lollipop plots demonstrate top 30 pathways (based on FDR). The red bold font texts are the pathways that are directly known to regulate the insulin-resistant pathway in the pathway figure.
Fig. 9
Fig. 9. Estrogen Signaling linked genes and pathways from JAXA Cell-Free Epigenome (CFE).
a Heatmap of the significantly upregulated genes compared to pre-flight for either flight or post-flight of normalized plasma cell-free RNA expression values and associated pathways for estrogen signaling over time for the six astronauts over 120 days in space from JAXA study. The values shown on are the averaged normalized expression values for all six astronauts each time point during flight and post-flight. The four pre-flight time points were averaged together, since the changes for genes in the time leading up to flight are considered to be the same and part of the baseline values. For the time, L = Launch (i.e., meaning time after launch from Earth and length in space) and R = Return to Earth. Based on heatmap, pathway analysis performed using ShinyGO to reveal the top 30 pathways (FDR < 0.05) being regulated for postflight upregulated estrogen signaling linked genes. The red bold font texts are the pathways that are directly known to regulate the insulin pathway in the pathway figure. b Heatmap and associated pathways showing estrogen signaling linked downregulated genes in postflight or flight vs preflight. Based on heatmap, pathway analysis performed using ShinyGO to reveal which pathways are being regulated for downregulated estrogen signaling linked genes. The pathways and lollipop plots demonstrate top 30 pathways (based on FDR). The red bold font texts are the pathways that are directly known to regulate the estrogen signaling pathway in the pathway figure.
Fig. 10
Fig. 10. Insulin and estrogen signaling in inspiration4 astronaut PBMC and skin samples.
a Percent overlap of genes associated with insulin and estrogen signaling in single cell RNA-seq PBMC data, by cell types. b Log2 Female to male gene ratios from panel c. Fold changes of enrichment scores in response to spaceflight by sex, postflight collection time points, and cell types, PBMC data. The color scale bar represents fold change values are relative to pre-flight. d Fold changes of enrichment scores in postflight relative to preflight time point, by sex and tissue compartments (OE outer epidermis, IE inner epidermis, OD outer dermis, VA vasculature) in skin biopsy data. The color scale bar represents fold change values.

References

    1. Afshinnekoo E, et al. Fundamental biological features of spaceflight: advancing the field to enable deep-space exploration. Cell. 2020;183:1162–1184. doi: 10.1016/j.cell.2020.10.050. - DOI - PMC - PubMed
    1. da Silveira WA, et al. Comprehensive multi-omics analysis reveals mitochondrial stress as a central biological hub for spaceflight impact. Cell. 2020;183:1185–1201.e20. doi: 10.1016/j.cell.2020.11.002. - DOI - PMC - PubMed
    1. Norton L, Shannon C, Gastaldelli A, DeFronzo RA. Insulin: the master regulator of glucose metabolism. Metabolism. 2022;129:155142. doi: 10.1016/j.metabol.2022.155142. - DOI - PubMed
    1. Petersen MC, Shulman GI. Mechanisms of insulin action and insulin resistance. Physiol. Rev. 2018;98:2133–2223. doi: 10.1152/physrev.00063.2017. - DOI - PMC - PubMed
    1. Hubbard SR. The insulin receptor: both a prototypical and atypical receptor tyrosine kinase. Cold Spring Harb. Perspect. Biol. 2013;5:a008946–a008946. doi: 10.1101/cshperspect.a008946. - DOI - PMC - PubMed

Publication types