. 2024 Jun 11;7(1):722.
doi: 10.1038/s42003-024-06411-2.

Activation of the cell wall integrity pathway negatively regulates TORC2-Ypk1/2 signaling through blocking eisosome disassembly in Saccharomyces cerevisiae

Affiliations

Activation of the cell wall integrity pathway negatively regulates TORC2-Ypk1/2 signaling through blocking eisosome disassembly in Saccharomyces cerevisiae

Wataru Nomura et al. Commun Biol. .

Abstract

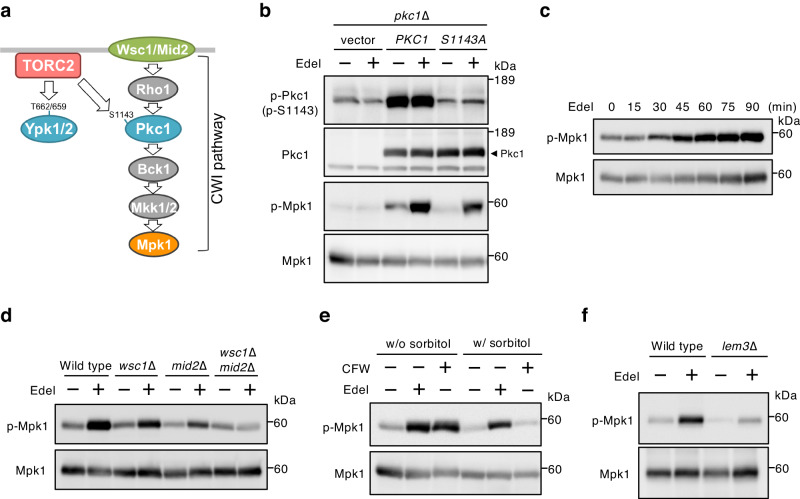
The target of rapamycin complex 2 (TORC2) signaling is associated with plasma membrane (PM) integrity. In Saccharomyces cerevisiae, TORC2-Ypk1/2 signaling controls sphingolipid biosynthesis, and Ypk1/2 phosphorylation by TORC2 under PM stress conditions is increased in a Slm1/2-dependent manner, under which Slm1 is known to be released from an eisosome, a furrow-like invagination PM structure. However, it remains unsolved how the activation machinery of TORC2-Ypk1/2 signaling is regulated. Here we show that edelfosine, a synthetic lysophospholipid analog, inhibits the activation of TORC2-Ypk1/2 signaling, and the cell wall integrity (CWI) pathway is involved in this inhibitory effect. The activation of CWI pathway blocked the eisosome disassembly promoted by PM stress and the release of Slm1 from eisosomes. Constitutive activation of TORC2-Ypk1/2 signaling exhibited increased sensitivity to cell wall stress. We propose that the CWI pathway negatively regulates the TORC2-Ypk1/2 signaling, which is involved in the regulatory mechanism to ensure the proper stress response to cell wall damage.


Conflict of interest statement

The authors declare no competing interests.

Figures

Fig. 1
Fig. 1. Edelfosine inhibits TORC2-Ypk1/2 signaling.
a, b Wild-type (BY4741) cells were cultured in SD medium until the log phase of growth and pretreated with 5 µM amphotericin B (AmB), 5 µM nystatin (Nys), 5 µg/ml filipin (Fili), or 5 µM edelfosine (Edel) for 15 min, and were then further grown for another 60 min after the addition of 1.25 µM AbA (a) or 15 mM MG (b). Phosphorylated Ypk1/2 or Ypk1 was detected with anti-phosphorylated Ypk1T662 and Ypk2T659, or anti-Ypk1 antibody, respectively; a band of phosphorylated Ypk1/2 or Ypk1 was indicated by arrowhead. c Wild-type (BY4741) cells were cultured in SD medium until the log phase of growth and treated with 5 µM amphotericin B (AmB), 5 µM nystatin (Nys), or 5 µM edelfosine (Edel) for 60 min, and viability was determined by counting the number of colonies after plating cells on YPD agar plates. The viability before the addition of the reagents was set as 100%. Data are from three independent experiments (mean ± s.d.). d Wild-type (BY4741) cells were cultured in SD medium until the log phase of growth and pretreated with 5 µM edelfosine for 15 min, and were then further grown for another 60 min after addition of 1.25 µM AbA, 1.25 µM myriocin (Myr), or 15 mM MG. The phosphorylated Ypk1/2 or Ypk1 was detected as described in (a). e Wild-type (BY4741) cells were cultured in SD medium until the log phase of growth and pretreated with 0, 2.5, 5, or 10 µM edelfosine for 15 min, and further grown for another 60 min after addition of 1.25 µM AbA. Phosphorylated Ypk1/2 or Ypk1 was detected as described in (a). f Wild-type (BY4741) cells were cultured in SD medium until the log phase of growth and pretreated with 5 µM edelfosine for 15 min, and treated with 1.25 µM AbA for the prescribed times. Phosphorylated Ypk1/2 or Ypk1 was detected as described in (a). g Wild-type (BY4741) cells were cultured in SD medium until the log phase of growth and treated using 5 µM edelfosine for 60 min, and then were spotted in 5-fold serial dilution onto SD agar plates with AbA. The plates were scanned after incubation for 3 days at 28 °C. h Wild type (BY4741) and lem3∆ cells were cultured in SD medium until the log phase of growth and pretreated with 5 µM edelfosine for 15 min and were then further grown for another 60 min after the addition of 1.25 µM AbA. Phosphorylated Ypk1/2 or Ypk1 was detected as described in (a). i fps1∆ cells were cultured in SD medium with 1 M sorbitol until the log phase of growth and pretreated with 5 µM edelfosine for 45 min. Cells were collected and transferred to SD medium without sorbitol to expose them to hypo-osmotic shock. Phosphorylated Ypk1/2 or Ypk1 at the prescribed times after hypo-osmotic shock was detected as described in (a). The intensity of the immunoreactive bands was quantified by image analysis. The ratio of phosphorylated Ypk1/2 (p-Ypks) to that of total Ypk1 was normalized to that of the sample at 0 min set as one. Data are from three independent experiments (mean ± s.d.). j ORM1-TAP cells were cultured in SD medium until the log phase of growth and pretreated with 5 µM edelfosine for 15 min, and were then further grown for another 120 min after the addition of 1.25 µM AbA or 1.25 µM myriocin. A portion of the untreated control sample was treated with calf intestinal alkaline phosphatase. Orm1-TAP was detected using PAP antibody.
Fig. 2
Fig. 2. Edelfosine activates the CWI pathway.
a Conserved sites of Pkc1 in addition to Ypk1/2 are phosphorylated by TORC2. Although Pkc1 is a component of the CWI pathway, TORC2 regulates Pkc1 independently of the CWI pathway. b pkc1∆ (DL376) cells carrying an empty vector, YEp352-PKC1 (pFR22), or YEp352-PKC1S1143A (pFR74) were cultured in SD medium with 1 M sorbitol until the log phase of growth and treated with 5 µM edelfosine for 60 min. Phosphorylated Pkc1, Pkc1, phosphorylated Mpk1, or Mpk1 was detected with anti-phosphorylated Pkc1S1143, anti-Pkc1, anti-phosphorylated Mpk1, or anti-Mpk1 antibody, respectively; a band of Pkc1 is indicated by an arrowhead. c Wild-type (BY4741) cells were cultured in SD medium until the log phase of growth and treated with 5 µM edelfosine for the prescribed times. Phosphorylated Mpk1, or Mpk1 was detected as described in (b). d Wild-type (BY4741), wsc1∆, mid2∆, and wsc1mid2∆ cells were cultured in SD medium until the log phase of growth and treated with 5 µM edelfosine for 60 min. The phosphorylated Mpk1 or Mpk1 was detected as described in (b). e Wild-type (BY4741) cells were cultured in SD medium with or without 1 M sorbitol until the log phase of growth and treated with 5 µM edelfosine or 40 µg/ml CFW for 60 min. Phosphorylated Mpk1 or Mpk1 was detected as described in (b). f Wild-type (BY4741) and lem3∆ cells were cultured in SD medium until the log phase of growth, and the phosphorylation of Mpk1 induced by edelfosine was determined as described in (b).
Fig. 3
Fig. 3. CWI pathway inhibits TORC2-Ypk1/2 signaling.
a Wild-type (BY4741) and wsc1mid2∆ cells were cultured in SD medium until the log phase of growth and pretreated with 5 µM edelfosine for 15 min, and were further grown for another 60 min after the addition of 1.25 µM AbA. Phosphorylated Ypk1/2, Ypk1, phosphorylated Mpk1, or Mpk1 was detected with anti-phosphorylated Ypk1T662 and Ypk2T659, anti-Ypk1, anti-phosphorylated Mpk1, or anti-Mpk1 antibody, respectively. b PKC1 and PKC1L54S_4C/S cells were cultured in SD medium with 1 M sorbitol until the log phase of growth and pretreated with 5 µM edelfosine for 15 min, and were then further grown for another 60 min after addition of 1.25 µM AbA. Phosphorylated Ypk1/2, Ypk1, phosphorylated Mpk1, or Mpk1 was detected as described in (a). c Wild-type (BY4741), bck1∆, and mpk1∆ cells were cultured in SD medium until the log phase of growth and pretreated with 5 µM edelfosine for 15 min, and were then further grown for another 60 min after the addition of 1.25 µM AbA. Phosphorylated Ypk1/2, Ypk1, phosphorylated Mpk1, or Mpk1 was detected as described in (a). d Wild-type (BY4741) cells carrying an empty vector, YCpLG-WSC1, or YCpLG-MID2 were cultured in raffinose medium until the log phase of growth, and galactose was added to the medium to a concentration of 2%. After incubation for 2 h, cells were treated with 1.25 µM AbA for 60 min. Phosphorylated Ypk1/2, Ypk1, phosphorylated Mpk1, or Mpk1 was detected as described in (a). The intensity of the immunoreactive bands was quantified by image analysis. The ratio of phosphorylated Ypk1/2 (p-Ypks) to that of total Ypk1 was normalized to that of the control sample with the empty vector set as one. Data are from three independent experiments (mean ± s.d.). e Wild-type (BY4741) cells carrying an empty vector, YCpLG-PKC1, or YCpLG-PKC1R398P, were cultured and treated with AbA as described in (d). The ratio of phosphorylated Ypk1/2 was determined as described in (d). Data are from three independent experiments (mean ± s.d.). ****p < 0.0001 (one-way ANOVA with Tukey’s multiple comparisons test).
Fig. 4
Fig. 4. CWI pathway blocks eisosome disassembly and Slm1 release from eisosome.
a PM stress induces eisosome disassembly and the release of Slm1/2, which are eisosome-localized proteins necessary for activating TORC2-Ypk1/2 signaling, from eisosome. b SUR7-mCherry cells were cultured in SD medium until the log phase of growth and pretreated with 5 µM edelfosine for 15 min, and were then further grown for another 60 min after addition of 1.25 µM AbA. Sur7-mCherry was observed using a fluorescence microscope. The graphs show the fluorescence intensity profiles of Sur7-mCherry from the line scan (yellow line on midsection images of cells indicated by asterisks) along the PM. Scale bar: 10 µm. c SUR7-mCherry cells carrying an empty vector, YCpLG-WSC1, or YCpLG-MID2 were cultured in raffinose medium until the log phase of growth, and galactose was added to the medium to a concentration of 2%. After incubation for 2 h, cells were treated with 1.25 µM AbA for 60 min. The fluorescence intensity profiles of Sur7-mCherry were determined as described in (b). Scale bar: 10 µm. d SUR7-mCherry SLM1-GFP cells were cultured and treated with AbA as described in (b). Sur7-mCherry and Slm1-GFP were observed using a fluorescence microscope. The graphs show the fluorescence intensity profiles of Sur7-mCherry (red line) and Slm1-GFP (green line) from a line scan along the PM. Scale bar: 2.5 µm. e SUR7-mCherry SLM1-GFP cells were cultured and treated with AbA as described in (b). Cortical localization of Sur7-mCherry and Slm1-GFP was observed using a fluorescence microscope. Quantitation of Sur7-mCherry and Slm1-GFP colocalization (Pearson’s coefficient) was performed. Data represent mean ± s.d. Total number of cells analyzed in three independent experiments: control n = 61, AbA n = 60, edel n = 55, edel + AbA n = 62. Scale bar: 2.5 µm. f SUR7-mCherry SLM1-GFP cells carrying an empty vector or YCpLG-PKC1R398P were cultured and treated with AbA as described in (c). Quantitation of Sur7-mCherry and Slm1-GFP colocalization was performed as described in (e). Total number of cells analyzed in three independent experiments: empty vector_control n = 63, vector_AbA n = 61, PKC1R398P_control n = 59, PKC1R398P_AbA n = 64. *p < 0.05; ***p < 0.001; ****p < 0.0001 (one-way ANOVA with Tukey’s multiple comparisons test).
Fig. 5
Fig. 5. Involvement of eisosome structures in the inhibitory effect of the CWI pathway on TORC2-Ypk1/2 signaling.
a Wild-type (BY4741) and pil1lsp1∆ cells were cultured in SD medium until the log phase of growth and pretreated with 5 µM edelfosine for 15 min, and were then further grown for another 60 min after addition of 1.25 µM AbA. Phosphorylated Ypk1/2, Ypk1, phosphorylated Mpk1, or Mpk1 was detected as described in Fig. 3a. The intensity of immunoreactive bands was quantified using image analysis. The ratio of phosphorylated Ypk1/2 (p-Ypks) to total Ypk1 was normalized to that of the control sample of wild-type cells set as one. Data are from three or four independent experiments (mean ± s.d.). b Wild-type (BY4741) and pil1lsp1∆ cells carrying an empty vector or pRS413-pGAL1-MID2 were cultured in raffinose medium until the log phase of growth, and galactose was added to the medium to a concentration of 2%. After incubation for 2 h, cells were treated with 1.25 µM AbA for 60 min. The phosphorylated Ypk1/2, Ypk1, phosphorylated Mpk1, or Mpk1 was detected as described in Fig. 3a. The intensity of the immunoreactive bands was quantified by image analysis. The ratio of phosphorylated Ypk1/2 (p-Ypks) to total Ypk1 was normalized to that of the control sample of wild-type cells carrying an empty vector set as one. Data are from four independent experiments (mean ± s.d.). c Wild-type (BY4741), pil1∆, and pil1lsp1∆ cells were cultured in SD medium until the log phase of growth and treated with 5 µM edelfosine for 60 min, and then were spotted in 5-fold serial dilution onto SD agar plates with 0.03 µM AbA. The plates were scanned after incubation for 3 days at 28 °C. d pil1∆ cells carrying an empty vector pRS416-PIL1-13myc or pRS416-PIL1S230A/T233A-13myc were cultured in SD medium until the log phase of growth and pretreated with 5 µM edelfosine for 15 min, were then further grown for another 60 min after addition of 1.25 µM AbA. Phosphorylated Ypk1/2 or Ypk1 was detected as described in Fig. 1a. The intensity of the immunoreactive bands was quantified using image analysis. The ratio of phosphorylated Ypk1/2 (p-Ypks) to total Ypk1 was normalized to that of the control sample of pil1∆ cells carrying pRS416-PIL1-13myc cells set as one. Data are from three independent experiments (mean ± s.d.). *p < 0.05; **p < 0.01; ***p < 0.001; ****p < 0.0001 (one-way ANOVA with Tukey’s multiple comparisons test).
Fig. 6
Fig. 6. The effect of cell wall stress on the inhibitory effect on TORC2-Ypk1/2 signaling.
a, b Wild-type (BY4741) and pil1∆ cells were cultured in SD medium until the log phase of growth and pretreated with 40 µg/ml CFW for 30 min, and were then further grown for another 60 min after the addition of 1.25 µM AbA. Phosphorylated Ypk1/2, Ypk1, phosphorylated Mpk1, or Mpk1 was detected as described in Fig. 3a. The intensity of immunoreactive bands was quantified using image analysis (b). The ratio of phosphorylated Ypk1/2 (p-Ypks) to total Ypk1 was normalized to that of the control sample of wild-type cells set as one. Data are from four independent experiments (mean ± s.d.). c Wild-type (BY4741) and pil1∆ cells were cultured in SD medium at 28 °C until the log phase of growth and serially diluted (1:5) using 0.85% NaCl solution. 5 µl each cell suspension was spotted onto SD agar plates with 400 µg/ml CFW and incubated at 28 °C or 35 °C for 3 days. d Wild-type (BY4741) cells carrying an empty vector, pRS423-YPK1-3HA, or pRS423-YPK1D242A-3HA were cultured and diluted as described in (c). 5 µl each cell suspension was spotted onto SD agar plates with 400 µg/ml CFW and incubated at 28 °C for 3 days. e Wild-type (BY4741) and gas1∆ cells were cultured in SD medium until the log phase of growth and pretreated with 5 µM edelfosine for 15 min, and treated with 1.25 µM AbA for the prescribed times. The phosphorylated Ypk1/2, Ypk1, phosphorylated Mpk1, or Mpk1 was detected as described in Fig. 3a. The intensity of the immunoreactive bands of phosphorylated Ypk1/2 and Ypk1was quantified by image analysis. The ratio of phosphorylated Ypk1/2 (p-Ypks) to that of total Ypk1 was normalized to the sample at 0 min set as one. Data are from three independent experiments (mean ± s.d.). f Wild-type (BY4741) and gas1∆ cells carrying an empty vector or pRS423-YPK1D242A-3HA were cultured and diluted as described in (c). 5 µl each cell suspension was spotted onto an SD agar plate and incubated at 28 °C for 3 days. g Schematic model for the negative regulation of TORC2-Ypk1/2 signaling by the CWI pathway. *p < 0.05 (one-way ANOVA with Tukey’s multiple comparisons test).

Similar articles

Cited by

References

    1. Heitman J, Movva NR, Hall MN. Targets for cell cycle arrest by the immunosuppressant rapamycin in yeast. Science. 1991;253:905–909. doi: 10.1126/science.1715094. - DOI - PubMed
    1. Saxton RA, Sabatini DM. mTOR signaling in growth, metabolism, and disease. Cell. 2017;168:960–976. doi: 10.1016/j.cell.2017.02.004. - DOI - PMC - PubMed
    1. Tatebe H, Shiozaki K. Evolutionary conservation of the components in the TOR signaling pathways. Biomolecules. 2017;7:77. doi: 10.3390/biom7040077. - DOI - PMC - PubMed
    1. Tafur L, Kefauver J, Loewith R. Structural insights into TOR signaling. Genes (Basel) 2020;11:885. doi: 10.3390/genes11080885. - DOI - PMC - PubMed
    1. Partovian C, Ju R, Zhuang ZW, Martin KA, Simons M. Syndecan-4 regulates subcellular localization of mTOR Complex2 and Akt activation in a PKCα-dependent manner in endothelial cells. Mol. Cell. 2008;32:140–149. doi: 10.1016/j.molcel.2008.09.010. - DOI - PMC - PubMed

Publication types

MeSH terms

Substances