. 2024 Jun 11;14(1):13367.
doi: 10.1038/s41598-024-64197-z.

Construction of a nomogram for predicting HNSCC distant metastasis and identification of EIF5A as a hub gene

Affiliations

Construction of a nomogram for predicting HNSCC distant metastasis and identification of EIF5A as a hub gene

Xin Chen et al. Sci Rep. .

Abstract

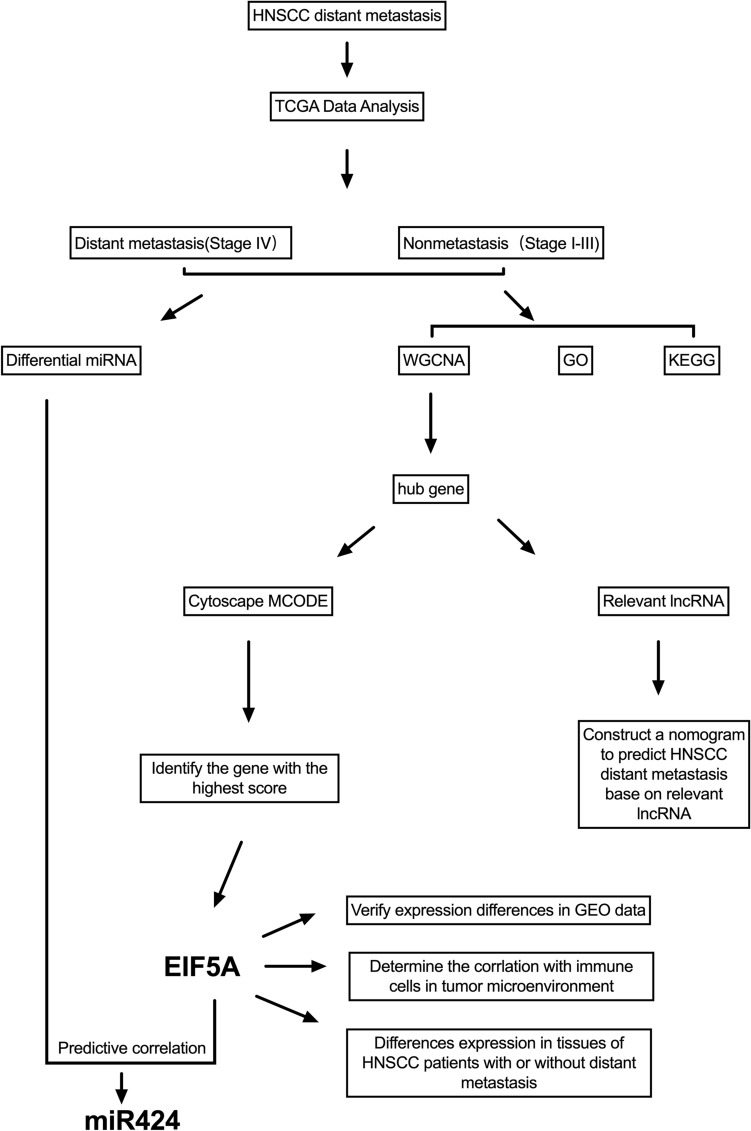
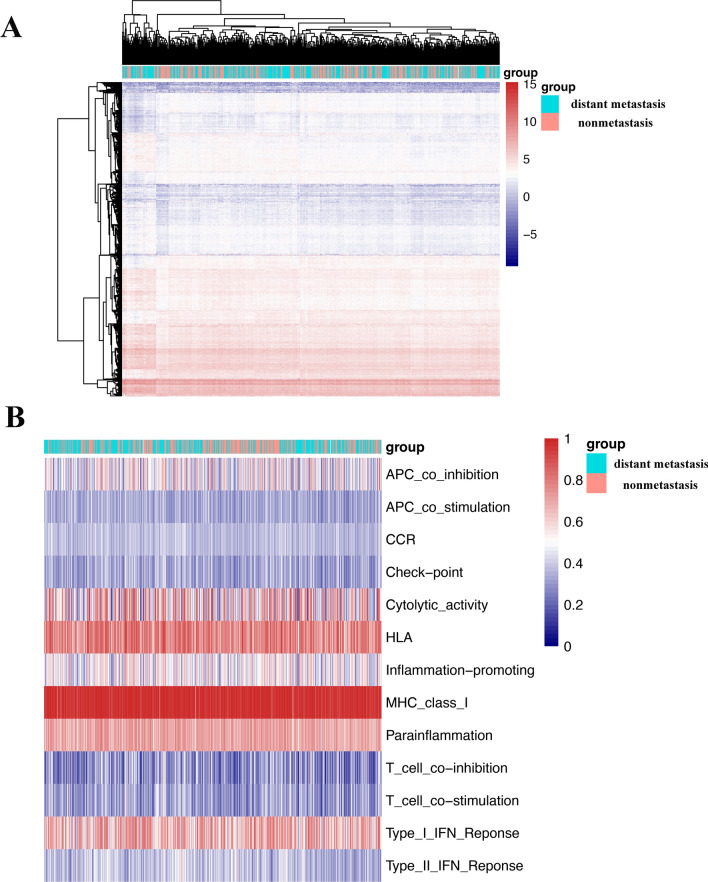
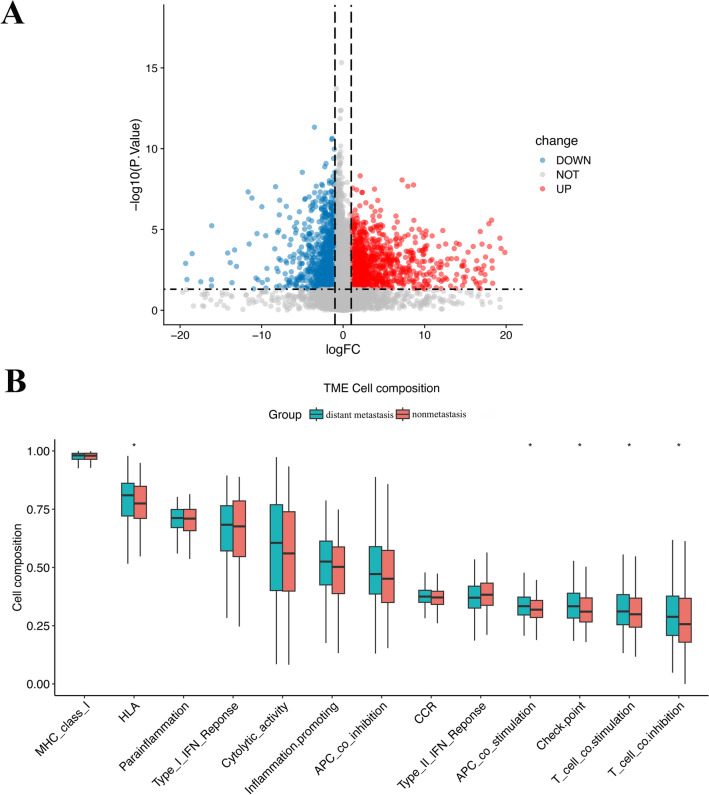
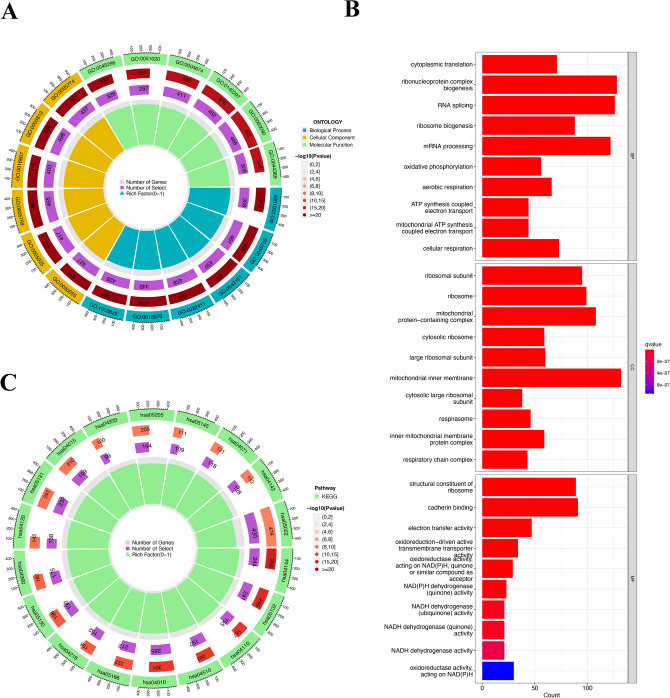
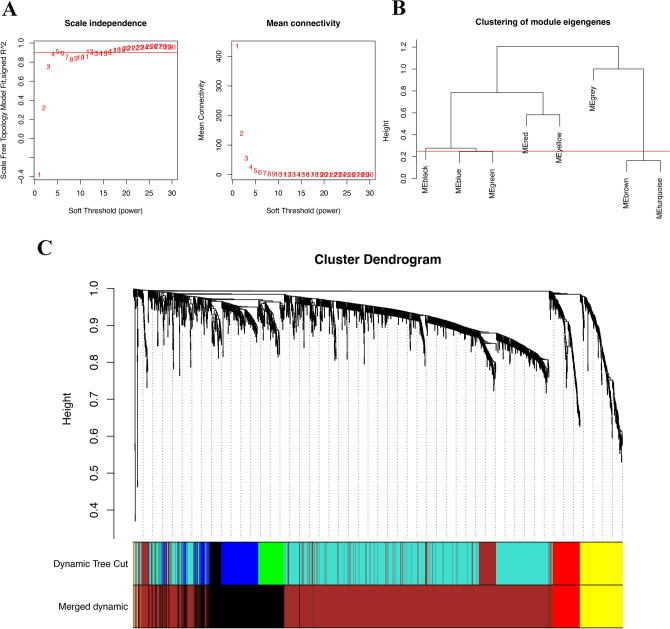
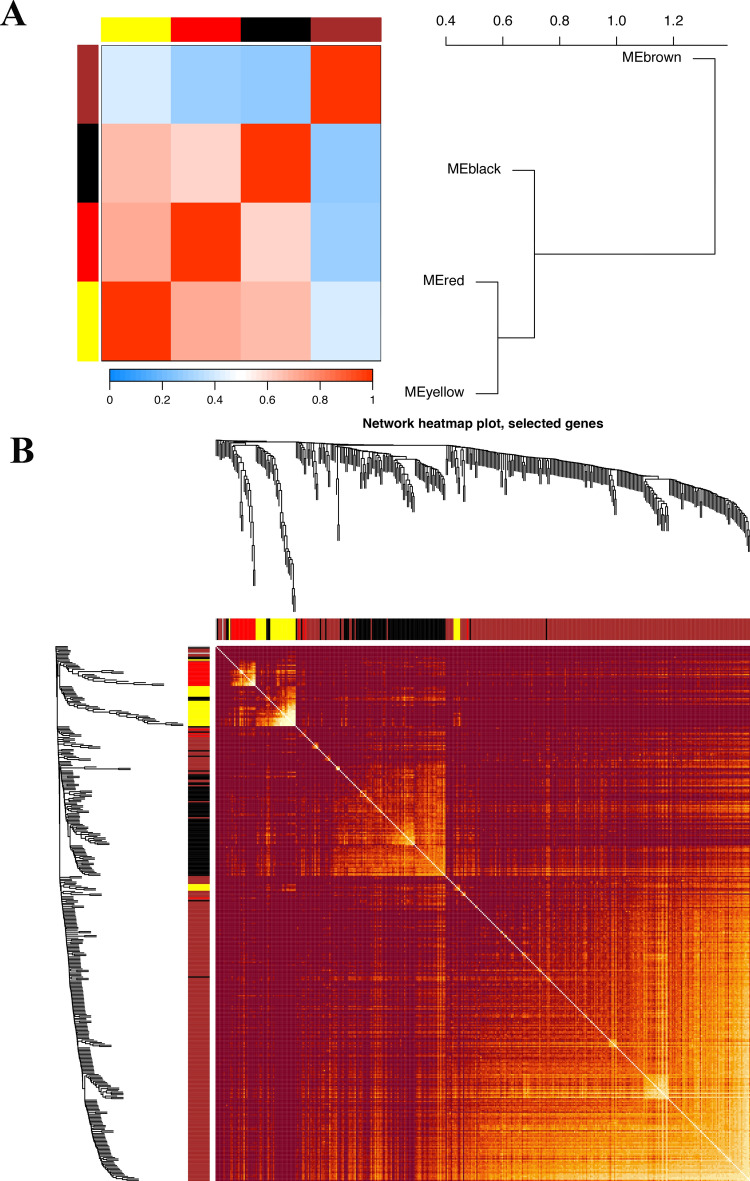
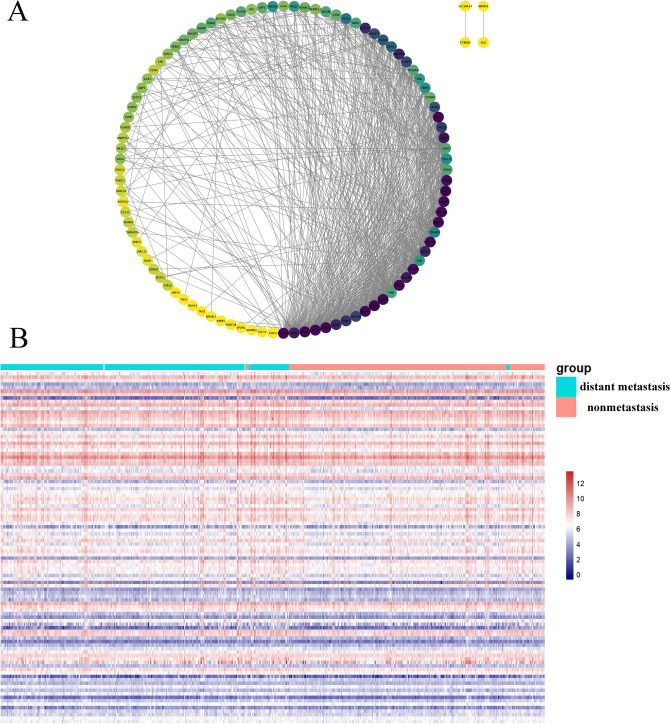
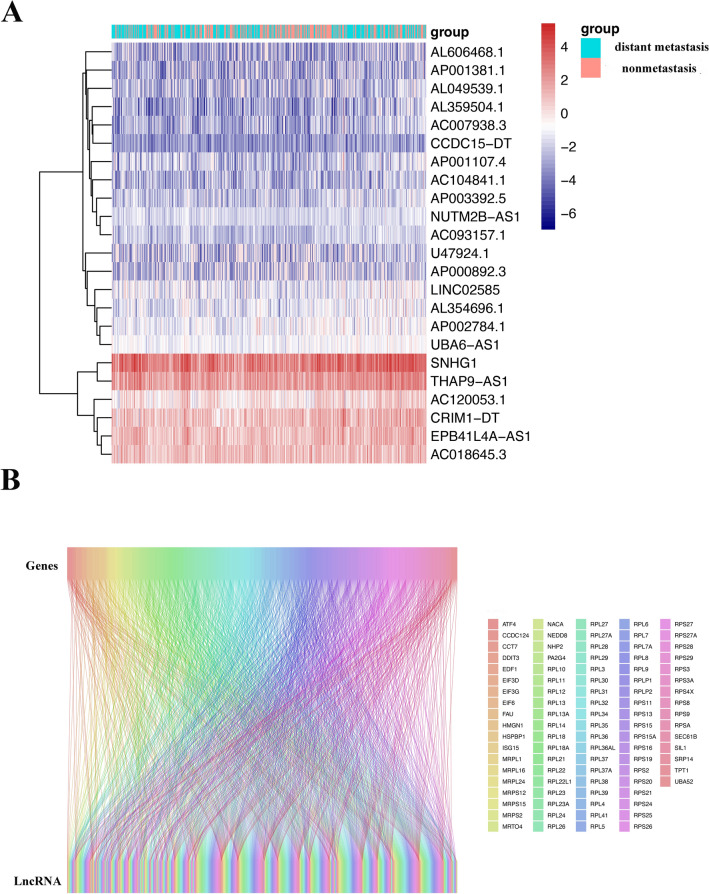
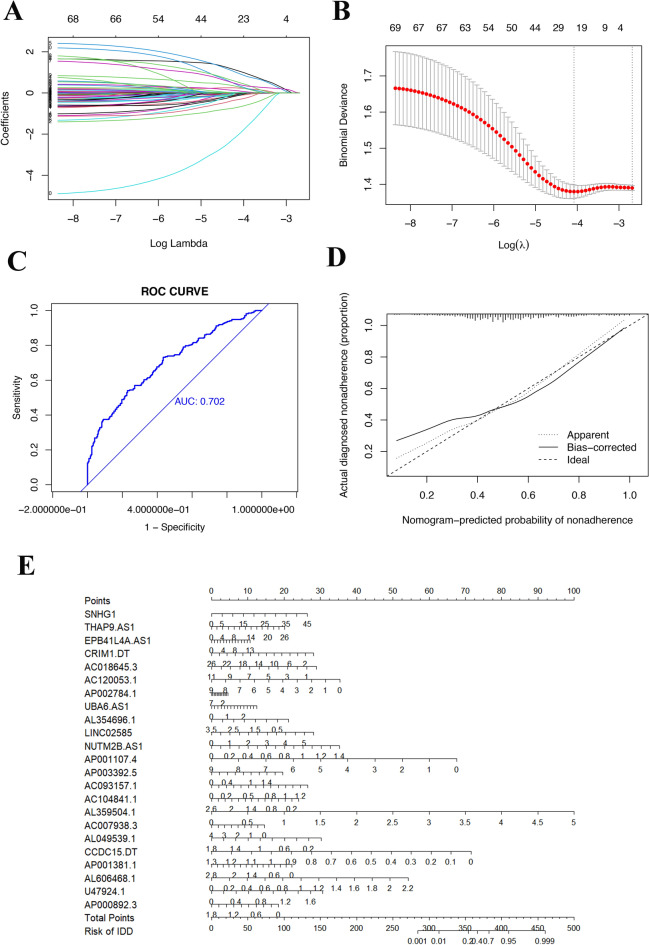
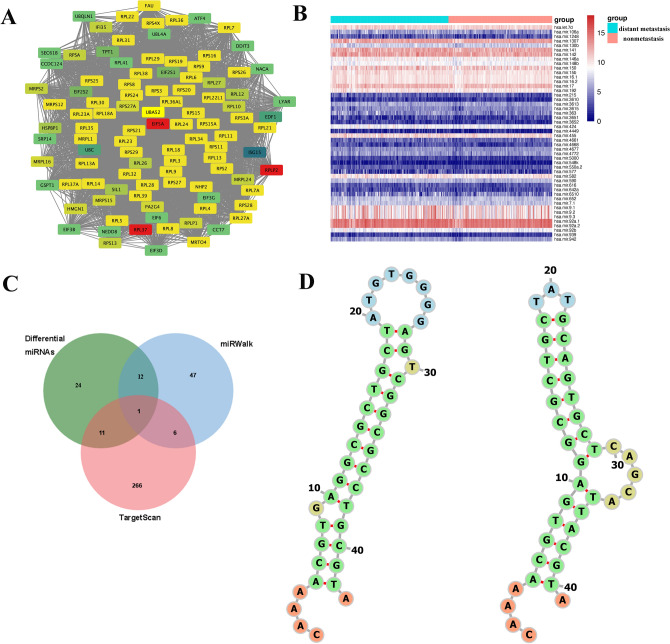
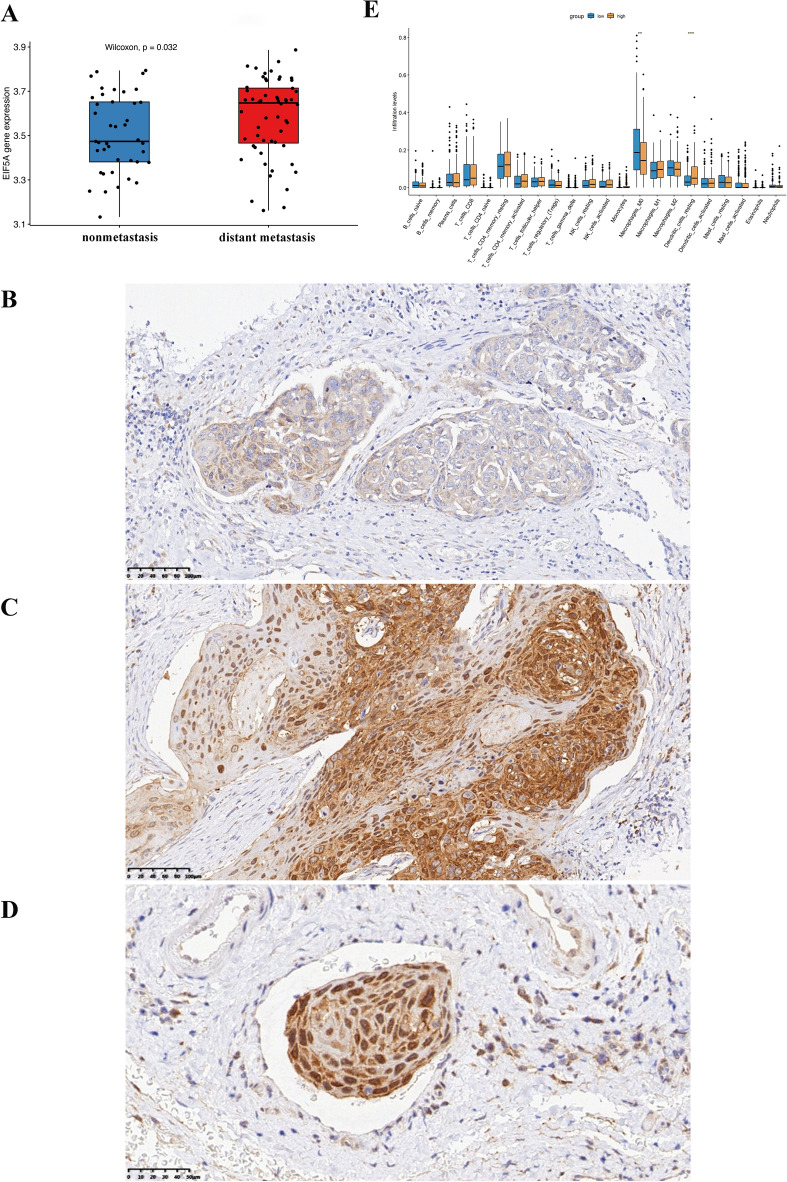
Patients with distant metastasis of head and neck squamous cell carcinoma (HNSCC) often have a poor prognosis. However, early diagnosis of distant metastasis is challenging in clinical practice, and distant metastasis is often only detected in the late stages of tumor metastasis through imaging techniques. In this study, we utilized data from HNSCC patients collected from the TCGA database. Patients were divided into distant metastasis and nonmetastasis groups based on the tumor-node-metastasis (TNM) stage. We analyzed the differentially expressed genes between the two groups (DM/non-M DEGs) and their associated lncRNAs and generated a predictive model based on 23 lncRNAs that were significantly associated with the occurrence of distant metastasis in HNSCC patients. On this basis, we built a nomogram to predict the distant metastasis of HNSCC patients. Moreover, through WGCNA and Cytoscape software analysis of DM/non-M DEGs, we identified the gene most closely related to HNSCC distant metastasis: EIF5A. Our findings were validated using GEO data; EIF5A expression was significantly increased in the tumor tissues of HNSCC patients with distant metastasis. We then predicted miRNAs that can directly bind to EIF5A via the TargetScan and miRWalk websites, intersected them with differentially expressed miRNAs in the two groups from the TCGA cohort, and identified the only overlapping miRNA, miR-424; we predicted the direct binding site of EIF5A and miR-424 via the miRWalk website. Immunohistochemistry further revealed high expression of EIF5A in the primary tumor tissue of HNSCC patients with distant metastasis. These results provide a new perspective for the early diagnosis of distant metastasis in HNSCC patients and the study of the mechanisms underlying HNSCC distant metastasis.

Keywords: Distant metastasis; EIF5A; HNSCC; Nomogram; miR-424.


Conflict of interest statement

The authors declare no competing interests.

Figures

Figure 1
Figure 1
The main process of this study.
Figure 2
Figure 2
Gene expression and immune-related functions in HNSCC patient tumor tissue. (A) Heatmap of total gene expression in HNSCC patient tissue. (B) Heatmap of immune-related functional genes in the tumor microenvironment of HNSCC patients. Red represents high expression, and blue represents low expression.
Figure 3
Figure 3
Differential gene expression and immune-related functions in HNSCC patients with and without diatant metastasis. (A) Volcano plot of differential gene expression in the two groups of patients. (B) Diagram of differential immune-related functions in the tumor microenvironment of the two groups of patients. The X-axis represents immune-related functions. The Y-axis represents the proportion of immune-related functional genes. *P < 0.05.
Figure 4
Figure 4
Diagram of the result of GO and KEGG enrichment analyses of DM/non-M DEGs. (A) Circle diagram of the GO analysis results. Green, yellow, and blue represent molecular function, cellular component, and biological process respectively. (B) GO analysis bar chart. The redder the color is, the stronger the correlation. (C) Circle diagram of the KEGG analysis results. The redder the color is, the greater the proportion of enriched genes among all pathway genes.
Figure 5
Figure 5
WGCNA of DM/non-M DEGs and identification of significantly related modules. (A) Selection of the soft threshold and determination of weight. (B) Clustering of module eigengenes. The Y-axis represents the similarity between genomic modules. Lower values indicate higher similarity among the modules. (C) Cluster dendrogram base on topological overlap, together with assigned merged dynamic and dynamic tree cut. The Y-axis represents the measure of dissimilarity between modules, while the X-axis denotes the clustered gene modules.
Figure 6
Figure 6
WGCNA module correlation and merging. (A) Heatmap of intermodule correlations. The redder the color is, the stronger the correlation between modules. (B) Heatmap of gene correlations. The brighter the color is, the stronger the interaction between genes.
Figure 7
Figure 7
DM/non-M DEGs correlation analysis and key gene expression heatmap. (A) MCODE analysis revealed 100 key genes among the DM/non-M DEGs. (B) Heatmap of key gene expression in HNSCC patient tissues. Green represents the diatant metastasis group, and red represents the nonmetastasis group. The redder the color is, the greater the expression.
Figure 8
Figure 8
Heatmap of the expression of lncRNAs related to key DM/non-M DEGs. (A) Heatmap of the expression of lncRNAs related to key DM/non-M DEGs. Green represents the distant metastasis group, and red represents the nonmetastasis group. The redder the color is, the greater the expression. (B) Sankey diagram of lncRNA and mRNA correlations.
Figure 9
Figure 9
Construction of the nomogram model for predicting the risk of distant metastasis in HNSCC patients. (A,B) LASSO and lambda of the risk score model. (C) AUC of the prediction model. (D) Calibration curve of the nomogram. The X-axis represents the predicted risk of distant metastasis in HNSCC patients. The Y-axis represents the actual diagnosis of distant metastasis in HNSCC. The diagonal dashed line signifies the perfect prediction of an ideal model. (E) The nomogram was used to estimate the probability of distant metastasis in HNSCC patients. The predicted points corresponding to each subject variable on the top point scale were calculated and summed. The total score projected to the bottom scale represents the probability of distant metastasis.
Figure 10
Figure 10
Identification of hub genes related to HNSCC distant metastasis and their associated miRNAs. (A) Identification of hub genes related to distant metastasis in HNSCC. Each gene’s color represents its importance score in the gene module, with a higher score resulting in a redder color. (B) Heatmap of differential miRNA expression in HNSCC patients with and without distant metastasis. Green represents the distant metastasis group, and red represents the nonmetastasis group. The higher the expression, the redder the color. (C) A Venn diagram showing the intersection of differentially expressed miRNAs and predicted EIF5A-associated miRNAs. (D) The miRWalk database was used to predict the binding site of EIF5A with miR-424.
Figure 11
Figure 11
Differences in EIF5A expression between the distant metastasis and nonmetastasis groups and its correlation with immune cell expression. (A) Differential expression of the EIF5A gene in the GSE41613 dataset. P = 0.032. (B) Expression of the EIF5A protein in the primary tumors of nonmetastatic HNSCC patients. (C) Expression of the EIF5A protein in the primary tumors of distant metastatic HNSCC patients. (D) Expression of the EIF5A protein in cancer thrombi in the small blood vessels of primary tumors from metastatic HNSCC patients. (E) Differences in immune cell expression between HNSCC patients with high EIF5A expression and those with low EIF5A expression according to TCGA database analysis. *P < 0.05, **P < 0.01, ***P < 0.001.

Similar articles

References

    1. Johnson DE, et al. Head and neck squamous cell carcinoma. Nat. Rev. Dis. Primers. 2020;6:92. doi: 10.1038/s41572-020-00224-3. - DOI - PMC - PubMed
    1. Bugshan A, Farooq I. Oral squamous cell carcinoma: metastasis, potentially associated malignant disorders, etiology and recent advancements in diagnosis. F1000Res. 2020;9:229. doi: 10.12688/f1000research.22941.1. - DOI - PMC - PubMed
    1. Kunieda F, et al. Randomized phase II/III trial of post-operative chemoradiotherapy comparing 3-weekly cisplatin with weekly cisplatin in high-risk patients with squamous cell carcinoma of head and neck: Japan Clinical Oncology Group Study (JCOG1008) Jpn. J. Clin. Oncol. 2014;44:770–774. doi: 10.1093/jjco/hyu067. - DOI - PubMed
    1. Lau A, Yang WF, Li KY, Su YX. Systemic therapy in recurrent or metastatic head and neck squamous cell carcinoma: A systematic review and meta-analysis. Crit. Rev. Oncol. Hematol. 2020;153:102984. doi: 10.1016/j.critrevonc.2020.102984. - DOI - PubMed
    1. Elmusrati A, Wang J, Wang CY. Tumor microenvironment and immune evasion in head and neck squamous cell carcinoma. Int. J. Oral Sci. 2021;13:24. doi: 10.1038/s41368-021-00131-7. - DOI - PMC - PubMed

MeSH terms