. 2024 Jun 11;7(1):719.
doi: 10.1038/s42003-024-06400-5.

Mechanistic analysis of enhancer sequences in the estrogen receptor transcriptional program

Affiliations

Mechanistic analysis of enhancer sequences in the estrogen receptor transcriptional program

Shayan Tabe-Bordbar et al. Commun Biol. .

Abstract

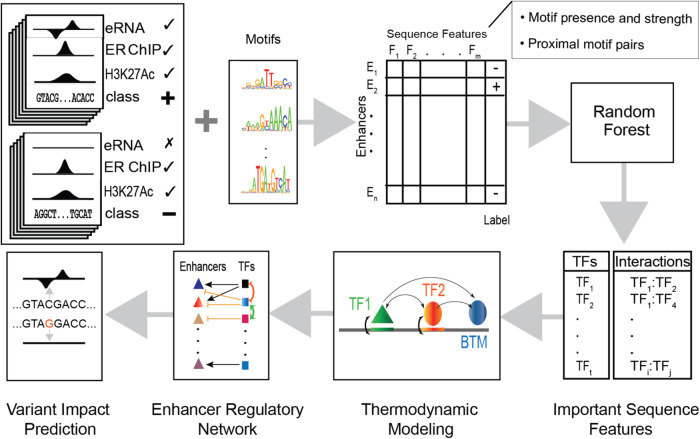
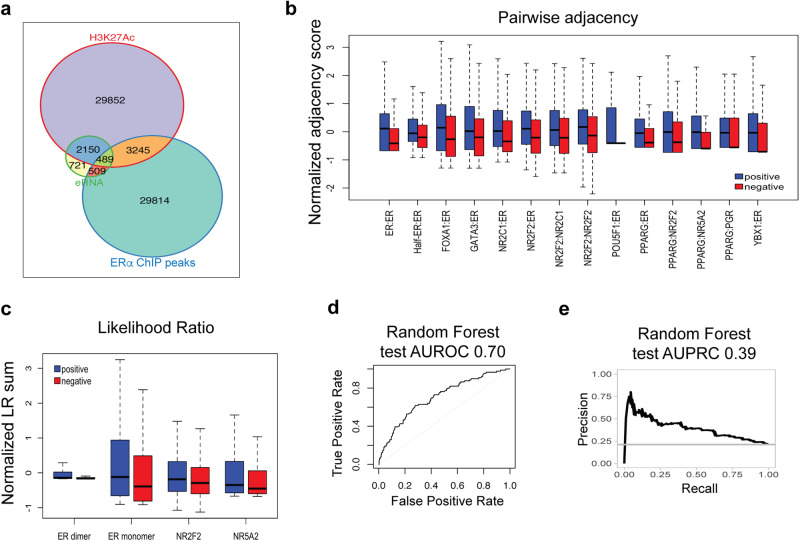
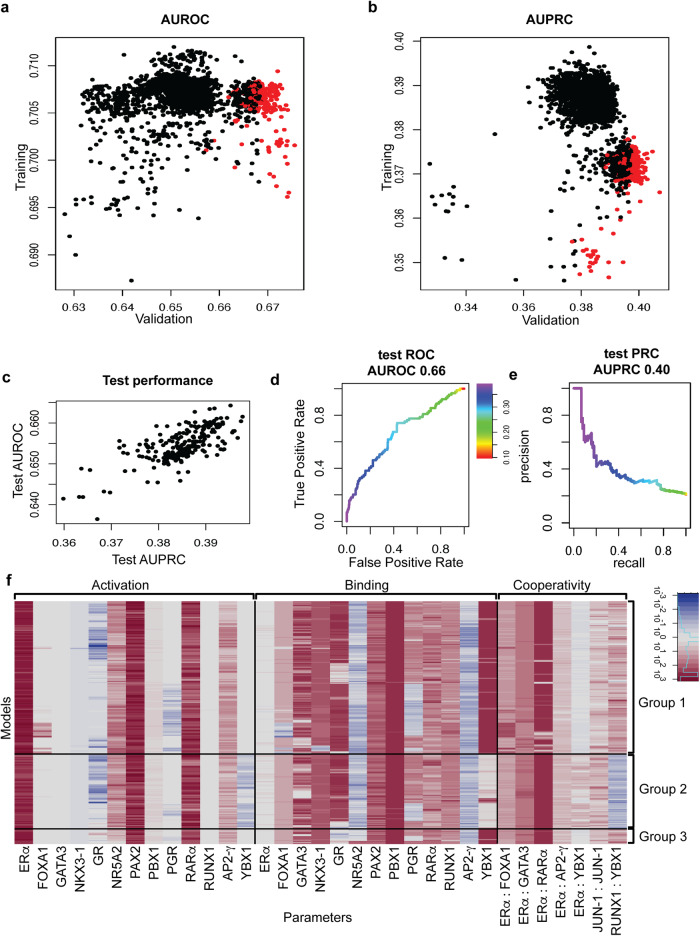
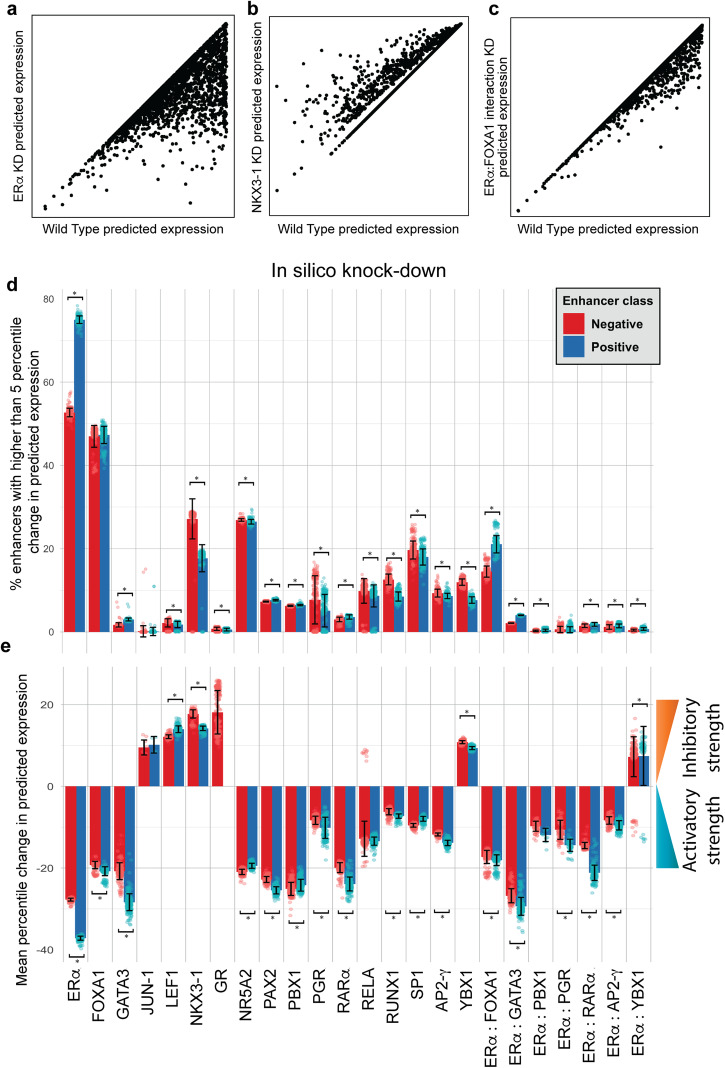
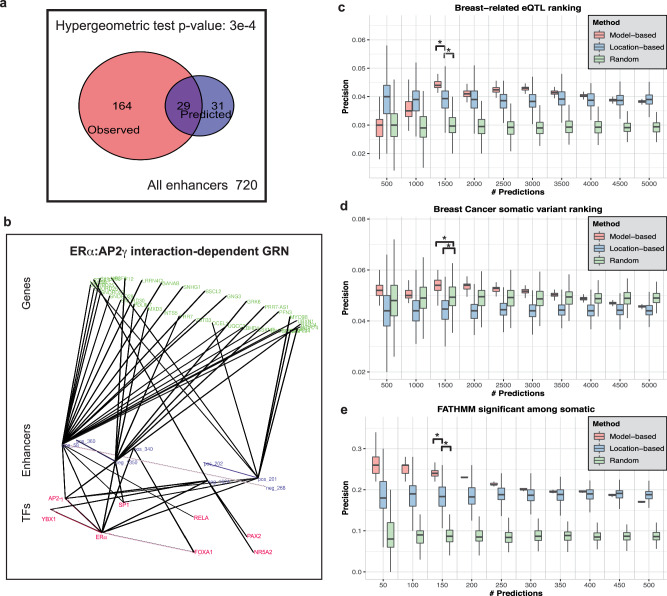
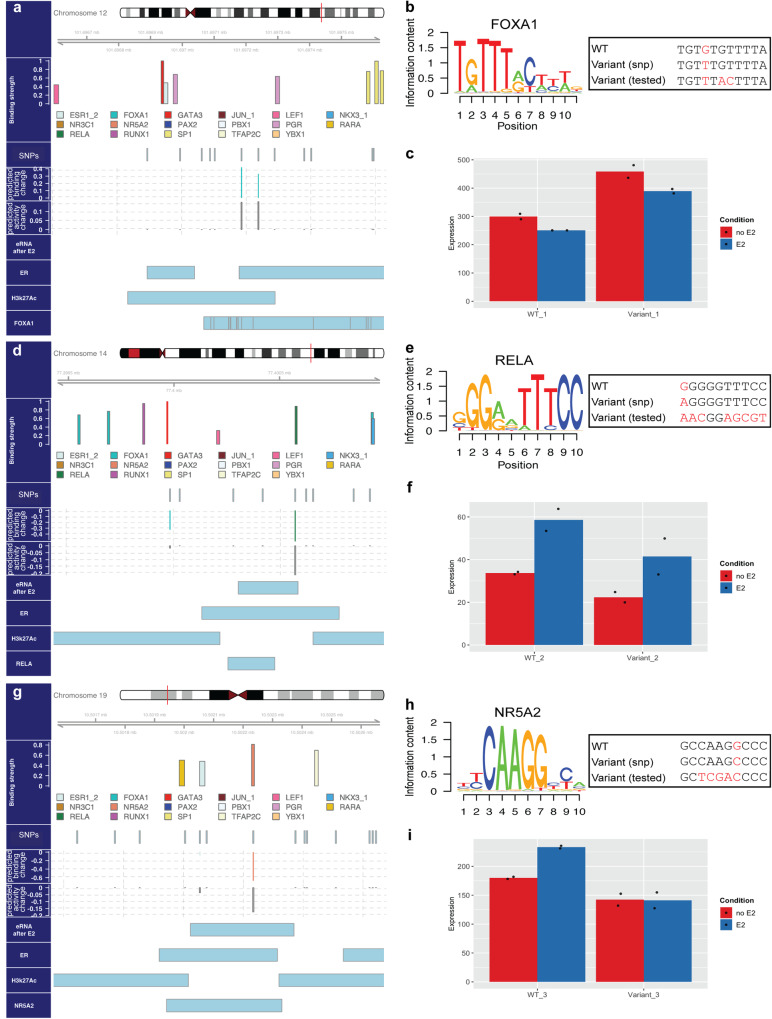
Estrogen Receptor α (ERα) is a major lineage determining transcription factor (TF) in mammary gland development. Dysregulation of ERα-mediated transcriptional program results in cancer. Transcriptomic and epigenomic profiling of breast cancer cell lines has revealed large numbers of enhancers involved in this regulatory program, but how these enhancers encode function in their sequence remains poorly understood. A subset of ERα-bound enhancers are transcribed into short bidirectional RNA (enhancer RNA or eRNA), and this property is believed to be a reliable marker of active enhancers. We therefore analyze thousands of ERα-bound enhancers and build quantitative, mechanism-aware models to discriminate eRNAs from non-transcribing enhancers based on their sequence. Our thermodynamics-based models provide insights into the roles of specific TFs in ERα-mediated transcriptional program, many of which are supported by the literature. We use in silico perturbations to predict TF-enhancer regulatory relationships and integrate these findings with experimentally determined enhancer-promoter interactions to construct a gene regulatory network. We also demonstrate that the model can prioritize breast cancer-related sequence variants while providing mechanistic explanations for their function. Finally, we experimentally validate the model-proposed mechanisms underlying three such variants.


Conflict of interest statement

The authors declare no competing interests.

Figures

Fig. 1
Fig. 1. Schematic overview.
Genomic regions marked by ERα ChIP peaks and H3K27Ac ChIP peaks were divided into positive/negative sets based on the presence/absence of eRNA signal from GRO-seq data. Enhancer sequences from both classes were scanned using motifs of relevant TFs to quantify binding affinity. Additionally, the number of adjacent sites (within 50 bp) for each pair of TFs was counted. Motif- and motif pair-based features thus defined were used in a Random Forest (RF) classifier and important features were extracted. Thus, identified TFs and their pairwise interactions were used to train a thermodynamics-based model. The trained model led to an Enhancer Regulatory Network (through in silico knock-downs of TFs) as well as predictions of regulatory variants (through expression prediction on enhancers with alternative alleles).
Fig. 2
Fig. 2. RF classification.
a Venn diagram of datasets used in this study. Regions colored orange (3245) and green (489) make up the universe set of our classification examples. The green region contains positive examples (449 out of 489, see “Methods”), and orange region contains negative examples (1669 out of 3245, see “Methods”). b Boxplot illustrates pairwise adjacency scores for a selection of TF pairs with statistically significant difference between positive and negative sets (p value < 0.05). Blue and red boxes represent enhancers in the positive and negative sets, respectively. Y-axis represents the z-score normalized pairwise adjacency score, which reflects the frequency of co-occurrence of motifs of the TF pair within 50 bp of each other. c Boxplot shows TF affinity scores for four TFs with significantly different affinity scores between positive (blue) and negative (red) sets of enhancers (p value < 0.05). Y-axis represents z-score normalized sum of Likelihood Ratios under the PWM model versus the background model. d Receiver operating characteristic curve indicating the performance of Random Forest classifier on the test set. e Precision-Recall curve shows performance of Random Forest classifier on the test set. Note that for all the boxplots in this manuscript center line indicates median; box limits are upper and lower quartiles; whiskers show 1.5x interquartile range, and outliers are removed to aid visualization.
Fig. 3
Fig. 3. GEMSTAT performance measures and parameters.
a Scatter plot shows the training and validation performance (area under ROC curve, or AUROC) of 4624 GEMSTAT models in constructed ensemble. Each point represents a model, Y-axis shows its training AUROC, and X-axis shows validation AUROC. Points in red indicate models that are in the top 150 of the ensemble by either the validation AUROC or the validation AUPRC; these models were selected for testing on unseen data (c). b Same as (a), except the performance metric shown is area under PR curve (AUPRC), instead of AUROC; red points have the same meaning as in (a). c Scatter plot represents the test performance (AUROC and AUPRC) of models colored red in (a, b). d, e ROC and PR curves indicating test performance of the best model in terms of AUPRC on the test set. Color bar indicates raw prediction threshold values used to generate the ROC and PRC curves. f Heatmap representation GEMSTAT ensemble model parameters. Rows represent 244 GEMSTAT models forming the ensemble, and falling into three broad clusters. Columns correspond to model parameter values that belong to “Activation”, “Binding”, or “Cooperativity” categories. Larger values of Binding parameter indicate greater binding potential for a TF. Activation parameter greater/less than 1, represents activatory/repressive role for a TF, respectively and its absolute log10 transformed value represents the regulatory strength of the TF. Cooperativity parameter of greater/less than 1 represents cooperative/antagonistic interaction, respectively, and its absolute log10 transformed value represents the strength of interaction.
Fig. 4
Fig. 4. In silico perturbations reveal TF target enhancers.
Results of in silico knock-down experiments using a representative GEMSTAT model for ERα (a), NKX3-1 (b), and ERα-FOXA1 interaction (c). d, e Bars depict the extent to which in silico perturbations of TFs or TF-TF interactions affect enhancers, shown separately for positive (eRNA expressing) and negative (silent) enhancer classes. Bar height represents the average over 244 top ranking models (shown as individual points), and error bars represent the standard deviation. The extent of perturbation effect is shown as (d) the fraction of enhancers whose expression changes by at least 5 percentile points in each perturbation experiment, and (e) the percentile change in expression after perturbation, averaged over enhancers that were affected by at least 5 percentile points. Pairs with statistically significant difference between positive and negative group enhancers (adjusted Wilcoxon p value < 1e−6) are marked with asterisks (*).
Fig. 5
Fig. 5. GRN visualization and statistical assessment of model predictions.
a Venn diagram indicates the overlap between experimentally observed targets of AP2-γ (enhancers that are transcribed in estrogen-treated MCF7 cells but not so in AP2-γ knock-down condition) and model-predicted targets (enhancers whose predicted activity in AP2-γ knock-down is at least 5 percentile points lower). The overlap is statistically significant with Hypergeometric test p value 3e−4. b Visualization of the GRN components under the effect of ERα and AP2-γ cooperativity. The three layers of the network from bottom to top correspond to TFs, enhancers and genes, respectively. ce illustrate evaluations of the variant impact prediction exercise. Three different methods for prioritizing functional variants were evaluated: an ensemble of GEMSTAT models used to predict variant impact on enhancer activity (“Model-based”), selection based solely on presence of ERα and H3K27Ac ChIP peaks (“Location-based”), and random selection (“Random”). Each method was used to prioritize a large number of common SNPs within enhancers from both classes, and top predictions were examined for presence of known breast cancer/tissue-related variants. Y-axis represents the proportion of True Positives among the prioritized variants and X-axis shows the number of prioritized variants, by each method. Known variants were defined to be breast cancer/tissue-related eQTLs, from GTEx and PanCan (c), non-coding somatic variants in breast cancer, from COSMIC (d), and FATHMM functionally significant somatic variants (FATHMM non-coding score >0.7) in breast cancer, from COSMIC (e) respectively.
Fig. 6
Fig. 6. Selected breast cancer-related SNPs with potential regulatory function.
a, d, g show evidence for our proposed hypothesis explaining the underlying mechanism of action for the studied variants. Each panel contains multiple tracks characterizing the region harboring the variant. From top to bottom, horizontal tracks depict the chromosomal location of the 1 kb region, color coded motif-based estimate of binding strength for all TFs included in the models (Binding strength), locations of common SNPs, breast tissue/cancer eQTLs and somatic variants (Variants) present in the vicinity of the studied variant highlighted in gray, predicted change in binding strength due to a variant, measured by the change in LLR score of a binding site normalized by maximum LLR score among all sites of that TF (Binding change), predicted percentile change in enhancer activity due to a variant (Activity change), presence or absence of transcribed eRNA after E2 stimulation of MCF7 cells (eRNA after E2), and presence or absence of ERα, H3K27Ac and other TF ChIP peaks. a Schematic representation of the enhancer region containing rs3809260 variant (highlighted). b Tested variant enhancer differs from wild-type enhancer in a putative FOXA1 binding site sequence; three nucleotide changes (including the SNP) create a consensus FOXA1 site. c Results of dual-luciferase assays on WT enhancer (shown in a) and variant (tested) enhancer, in MCF7 cells without or with E2 treatment. Note that experiments were done in duplicates. d Schematic representation of the enhancer region containing rs12890411 variant (highlighted). e Tested variant enhancer differs from wild-type in a putative RELA binding site sequence; a strong RELA site is abolished in the variant. f Results of dual-luciferase assays on WT enhancer (shown in d) and variant (tested) enhancer, with and without E2 treatment. g Schematic representation of the enhancer region harboring the somatic variant chr19_10502235_G_C (highlighted). h Change in putative NR5A2 binding site sequence in the tested variant enhancer; a strong NR5A2 site is abolished. i Results of dual-luciferase assays on WT enhancer (shown in g) and variant (tested) enhancer, in MCF7 cells with and without E2 treatment.

Similar articles

Cited by

References

    1. Desantis, C. E. Breast cancer statistics, 2017, racial disparity in mortality by state. CA Cancer J. Clin.67, 439–448 (2017). - PubMed
    1. Carroll JS, et al. Genome-wide analysis of estrogen receptor binding sites. Nat. Genet. 2006;38:1289–1297. doi: 10.1038/ng1901. - DOI - PubMed
    1. Carroll JS. Eje prize 2016: mechanisms of oestrogen receptor (ER) gene regulation in breast cancer. Eur. J. Endocrinol. 2016;175:R41–R49. doi: 10.1530/EJE-16-0124. - DOI - PMC - PubMed
    1. Shlyueva D, Stampfel G, Stark A. Transcriptional enhancers: from properties to genome-wide predictions. Nat. Rev. Genet. 2014;15:272–286. doi: 10.1038/nrg3682. - DOI - PubMed
    1. Carroll JS, et al. Chromosome-wide mapping of estrogen receptor binding reveals long-range regulation requiring the forkhead protein FoxA1. Cell. 2005;122:33–43. doi: 10.1016/j.cell.2005.05.008. - DOI - PubMed

Publication types

Substances