

Most genetic roots of fungal and animal aging are hundreds of millions of years old according to phylostratigraphy analyses of aging networks
- PMID: 38862758
- PMCID: PMC11335996
- DOI: 10.1007/s11357-024-01234-9
Most genetic roots of fungal and animal aging are hundreds of millions of years old according to phylostratigraphy analyses of aging networks
Abstract
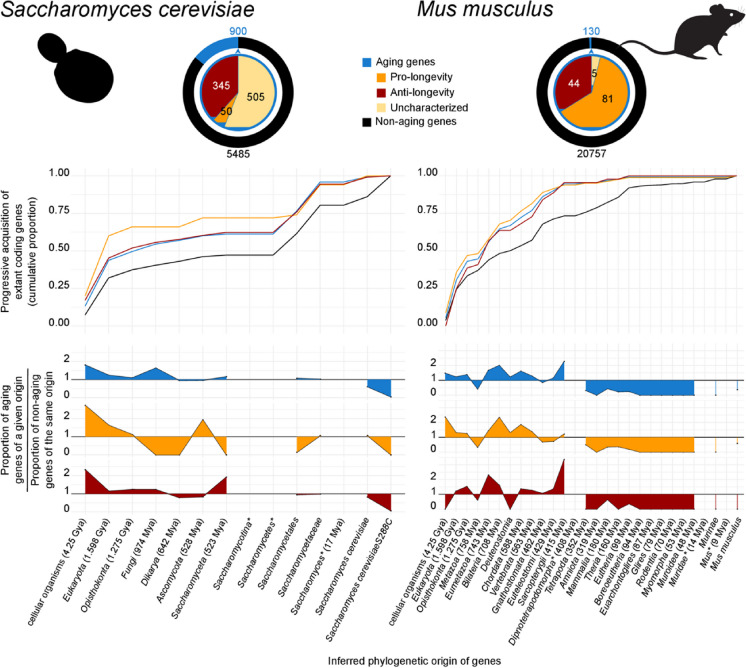
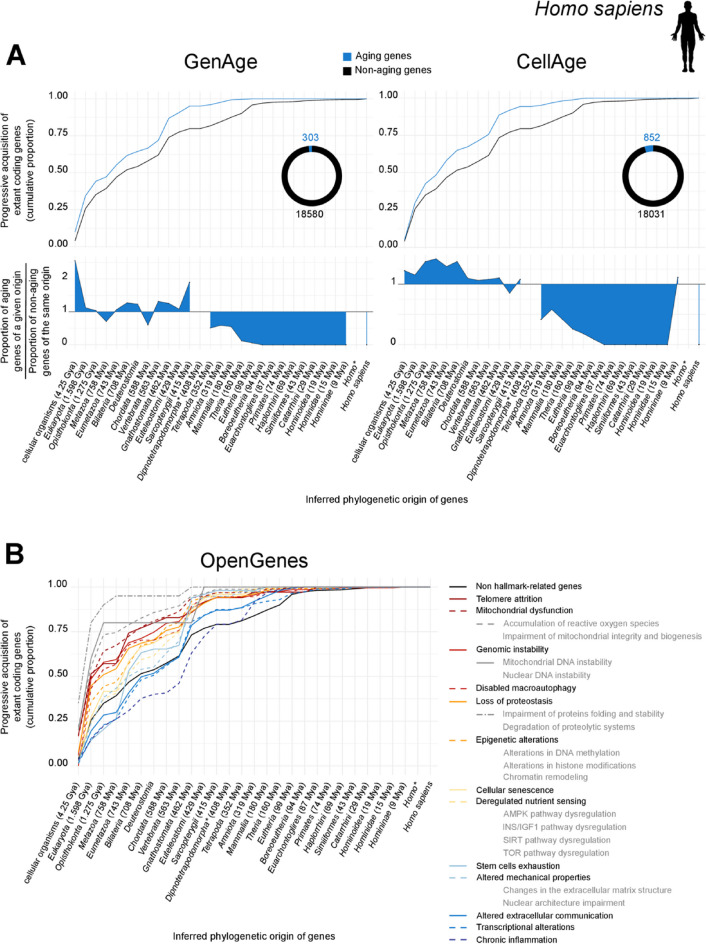
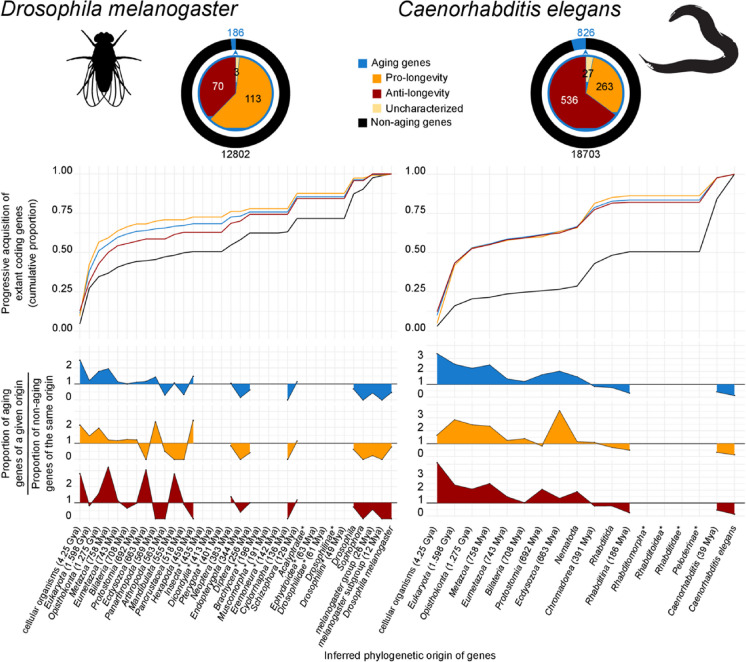
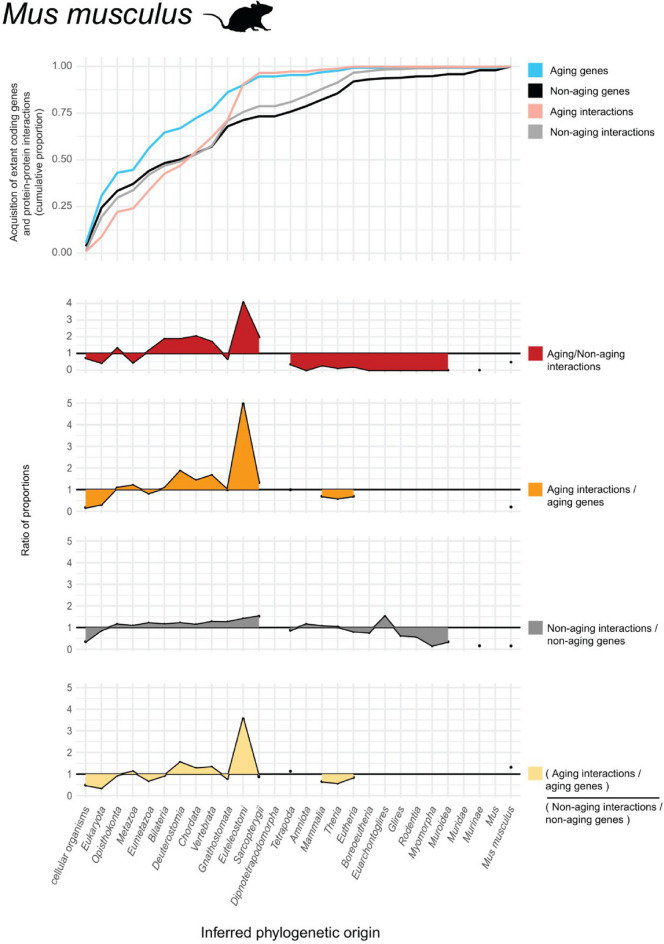
Few studies have systematically analyzed how old aging is. Gaining a more accurate knowledge about the natural history of aging could however have several payoffs. This knowledge could unveil lineages with dated genetic hardware, possibly maladapted to current environmental challenges, and also uncover "phylogenetic modules of aging," i.e., naturally evolved pathways associated with aging or longevity from a single ancestry, with translational interest for anti-aging therapies. Here, we approximated the natural history of the genetic hardware of aging for five model fungal and animal species. We propose a lower-bound estimate of the phylogenetic age of origination for their protein-encoding gene families and protein-protein interactions. Most aging-associated gene families are hundreds of million years old, older than the other gene families from these genomes. Moreover, we observed a form of punctuated evolution of the aging hardware in all species, as aging-associated families born at specific phylogenetic times accumulate preferentially in genomes. Most protein-protein interactions between aging genes are also old, and old aging-associated proteins showed a reduced potential to contribute to novel interactions associated with aging, suggesting that aging networks are at risk of losing in evolvability over long evolutionary periods. Finally, due to reshuffling events, aging networks presented a very limited phylogenetic structure that challenges the detection of "maladaptive" or "adaptative" phylogenetic modules of aging in present-day genomes.
Keywords: Aging; Antagonistic pleiotropy hypothesis; Evolution; Geroscience; Network.
© 2024. The Author(s), under exclusive licence to American Aging Association.
Conflict of interest statement
The authors declare no competing interests.
Figures
Similar articles
-
Network analyses unveil ageing-associated pathways evolutionarily conserved from fungi to animals.Geroscience. 2023 Apr;45(2):1059-1080. doi: 10.1007/s11357-022-00704-2. Epub 2022 Dec 12. Geroscience. 2023. PMID: 36508078 Free PMC article.
-
What Is Antagonistic Pleiotropy?Biochemistry (Mosc). 2019 Dec;84(12):1458-1468. doi: 10.1134/S0006297919120058. Biochemistry (Mosc). 2019. PMID: 31870250 Review.
-
Accelerated protein evolution analysis reveals genes and pathways associated with the evolution of mammalian longevity.Age (Dordr). 2013 Apr;35(2):301-14. doi: 10.1007/s11357-011-9361-y. Epub 2011 Dec 29. Age (Dordr). 2013. PMID: 22205409 Free PMC article.
-
Architecture of an antagonistic tree/fungus network: the asymmetric influence of past evolutionary history.PLoS One. 2008 Mar 5;3(3):e1740. doi: 10.1371/journal.pone.0001740. PLoS One. 2008. PMID: 18320058 Free PMC article.
-
Evolutionary defined role of the mitochondrial DNA in fertility, disease and ageing.Hum Reprod Update. 2015 Sep-Oct;21(5):671-89. doi: 10.1093/humupd/dmv024. Epub 2015 May 14. Hum Reprod Update. 2015. PMID: 25976758 Review.
Cited by
-
The ageing virus hypothesis: Epigenetic ageing beyond the Tree of Life.Bioessays. 2025 Jan;47(1):e2400099. doi: 10.1002/bies.202400099. Epub 2024 Oct 14. Bioessays. 2025. PMID: 39400402 Free PMC article. Review.
References
-
- Bapteste E, Huneman P, Keller L, Teulière J, Lopez P, Teeling EC, Lindner AB, Baudisch A, Ludington WB, Franceschi C. Expanding evolutionary theories of ageing to better account for symbioses and interactions throughout the Web of Life. Ageing Res Rev. 2023;89:101982. 10.1016/j.arr.2023.101982 - DOI - PMC - PubMed
MeSH terms
Grants and funding
LinkOut - more resources
Full Text Sources
Medical
